
Daily Technical Analysis & Forecast – 1 October 2025
EURUSD Forecast
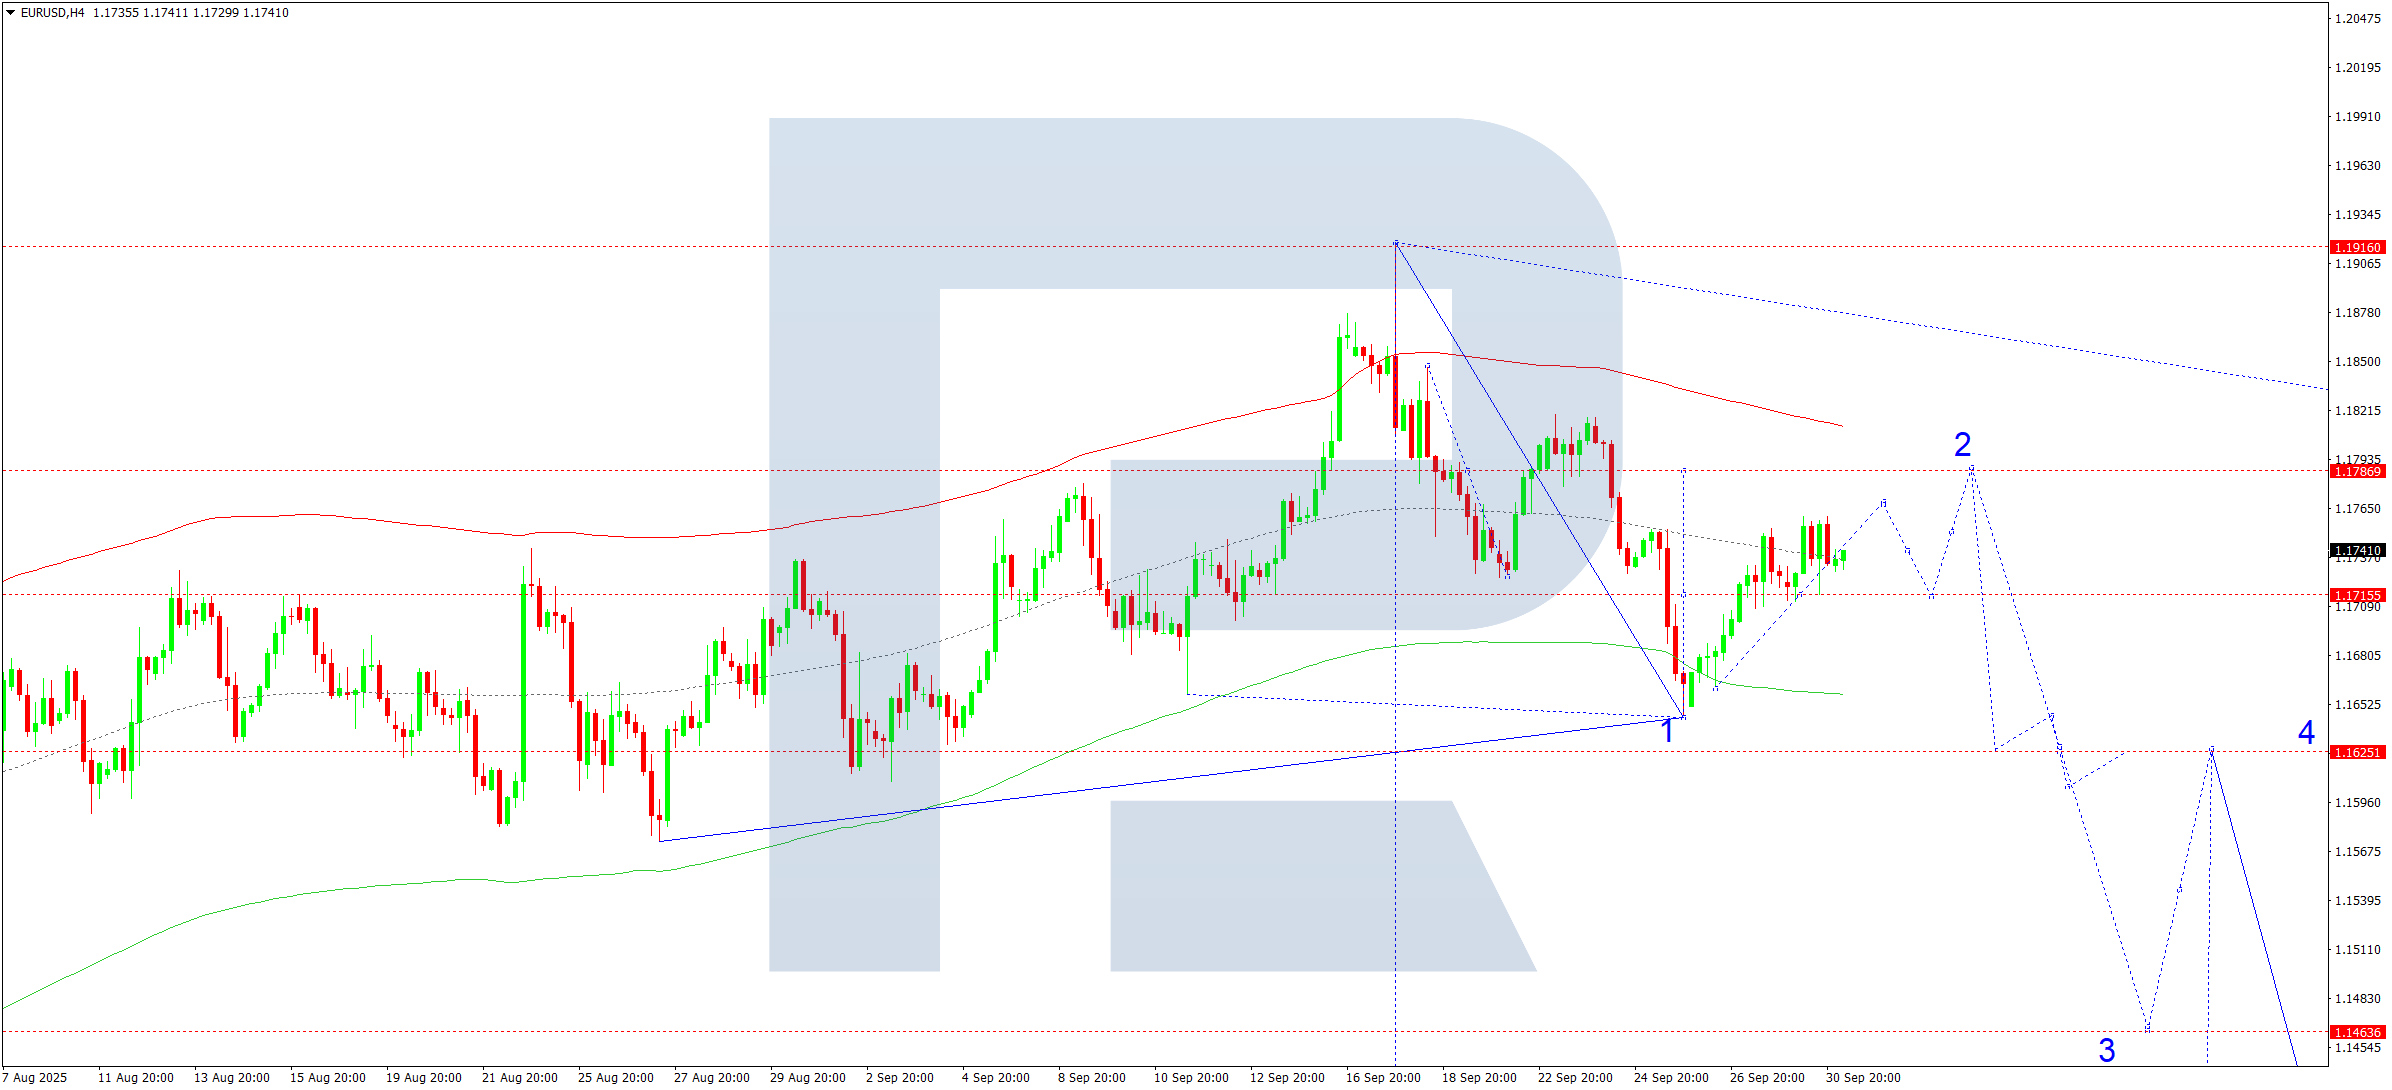
On the H4 chart, EURUSD is consolidating above the 1.1715 level. For today, 1 October 2025, a rise towards 1.1770 is anticipated, followed by a pullback to retest 1.1715 from above. The corrective phase may then extend higher to 1.1786, testing this level from below. Once the correction completes, a new downward wave is likely to unfold, initially targeting 1.1625, with further potential towards 1.1464.
The Elliott Wave structure and the bearish wave matrix centered around the 1.1786 pivot support this outlook. The price has previously touched the lower boundary of the Price Envelope at 1.1645 and is now consolidating near its central line at 1.1715, with the upper boundary at 1.1786 in focus.
Technical Insight: A corrective move towards 1.1786 remains in play before renewed downside pressure.
USDJPY Forecast
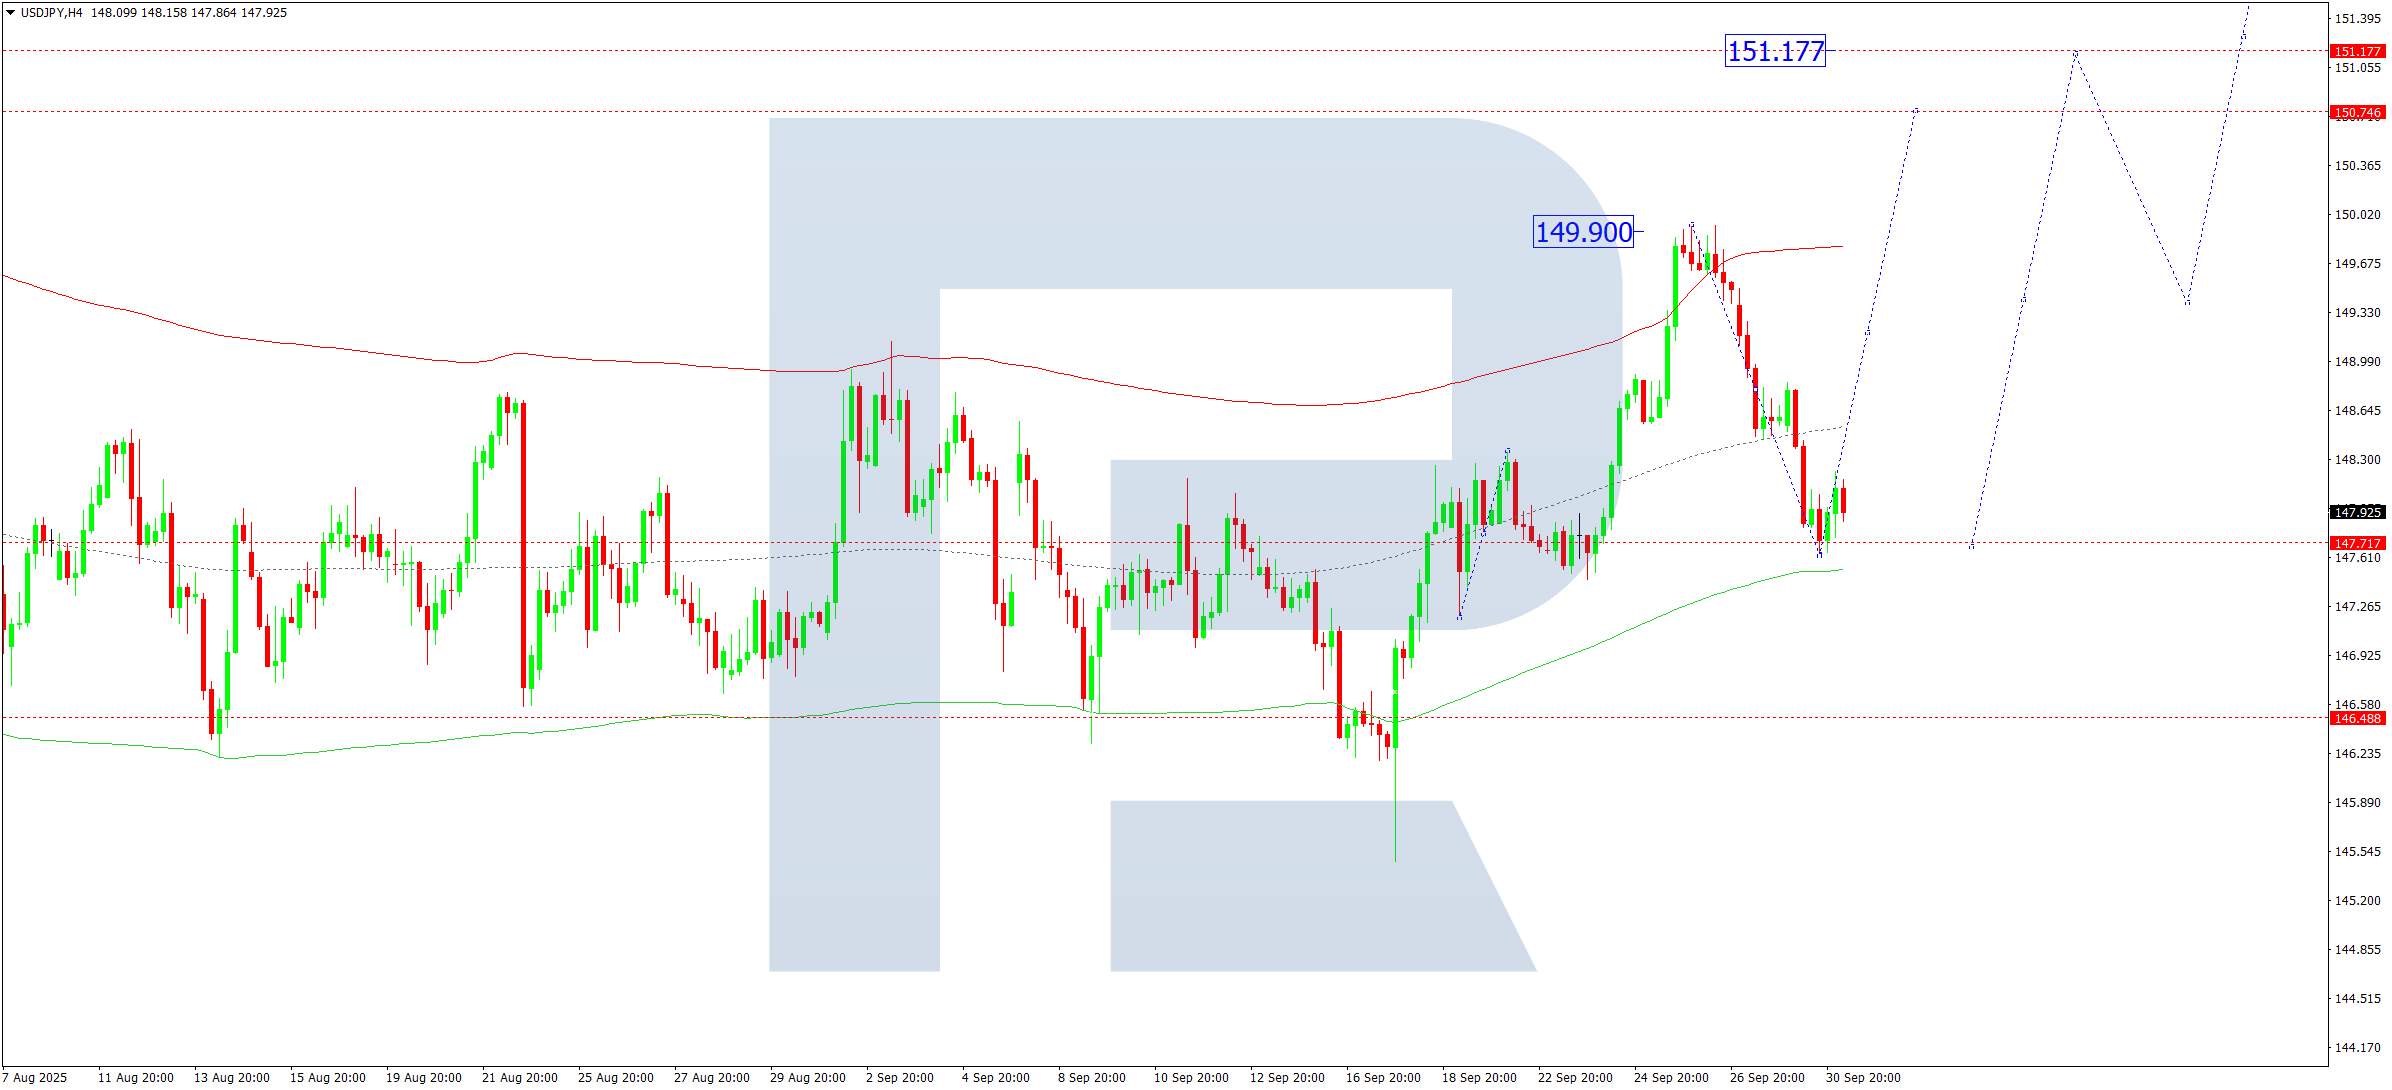
USDJPY recently completed a corrective dip to 147.45 on the H4 timeframe. On 1 October 2025, the pair is expected to resume its upward trend, aiming for 149.30 and extending to 151.17 as the next target. A pullback to 149.30 could follow, after which the rally may continue towards 153.15.
The Elliott Wave pattern and the bullish wave matrix pivoting around 147.75 support this projection. The price previously tested the upper Price Envelope boundary at 149.90, and the recent correction found support at the lower boundary near 147.45.
Technical Insight: Expect continuation of upward movement towards 151.15 and potentially higher.
GBPUSD Forecast
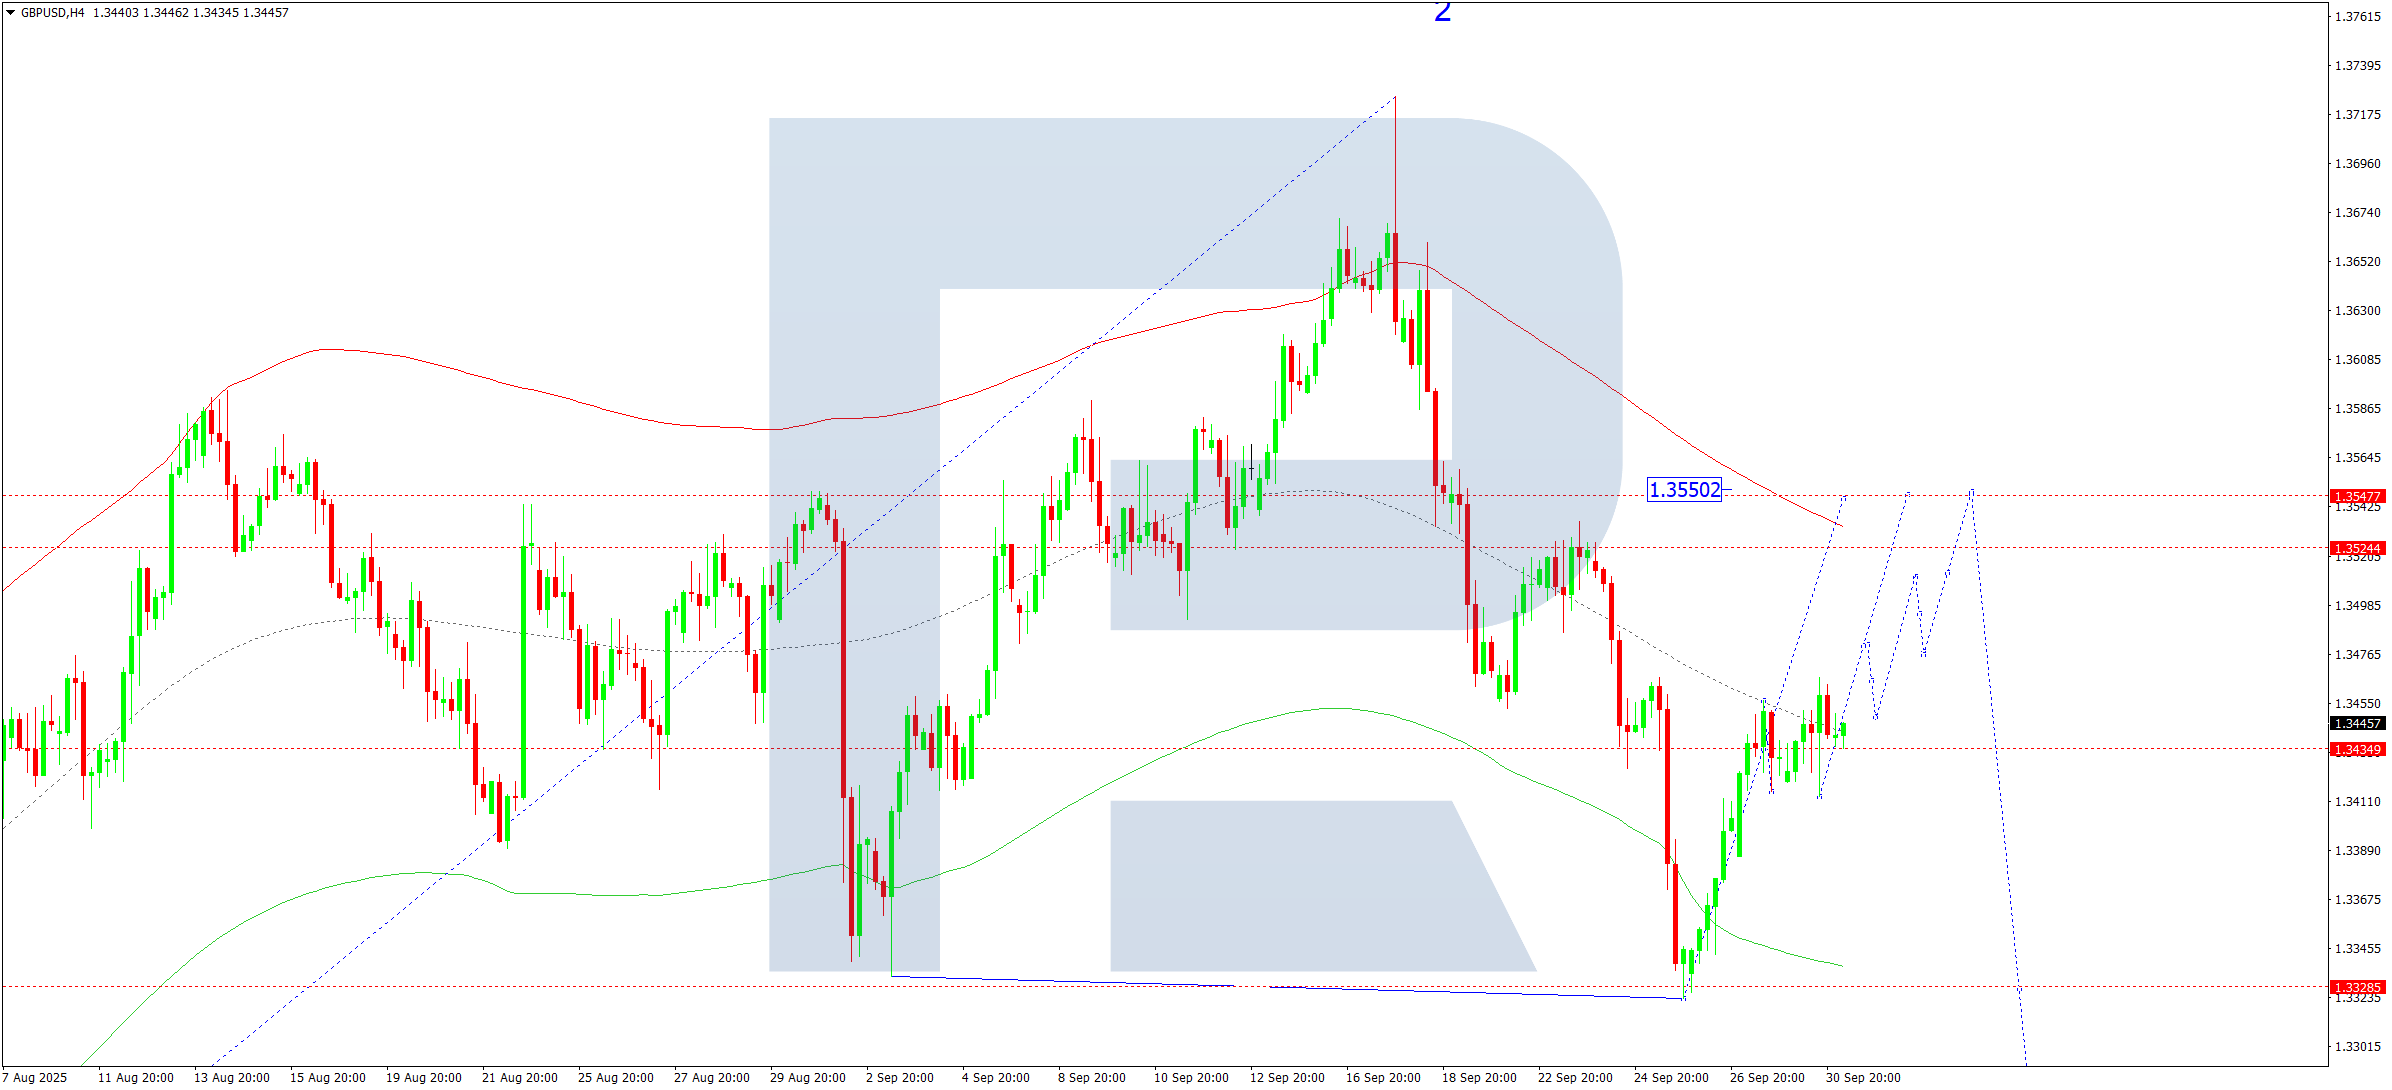
GBPUSD is currently forming a consolidation range around the 1.3434 level on the H4 chart. For 1 October 2025, a short-term rise to 1.3550 is expected. After this correction, a third wave of decline could develop, initially targeting 1.3328 and extending further down to 1.3100.
The Elliott Wave structure and the bearish wave matrix with a key pivot at 1.3550 support this scenario. The price has already tested the lower edge of the Price Envelope at 1.3323, with a corrective move towards the upper boundary at 1.3550 appearing likely.
Technical Insight: Watch for a corrective rise to 1.3550 before potential resumption of the downtrend.
AUDUSD Forecast
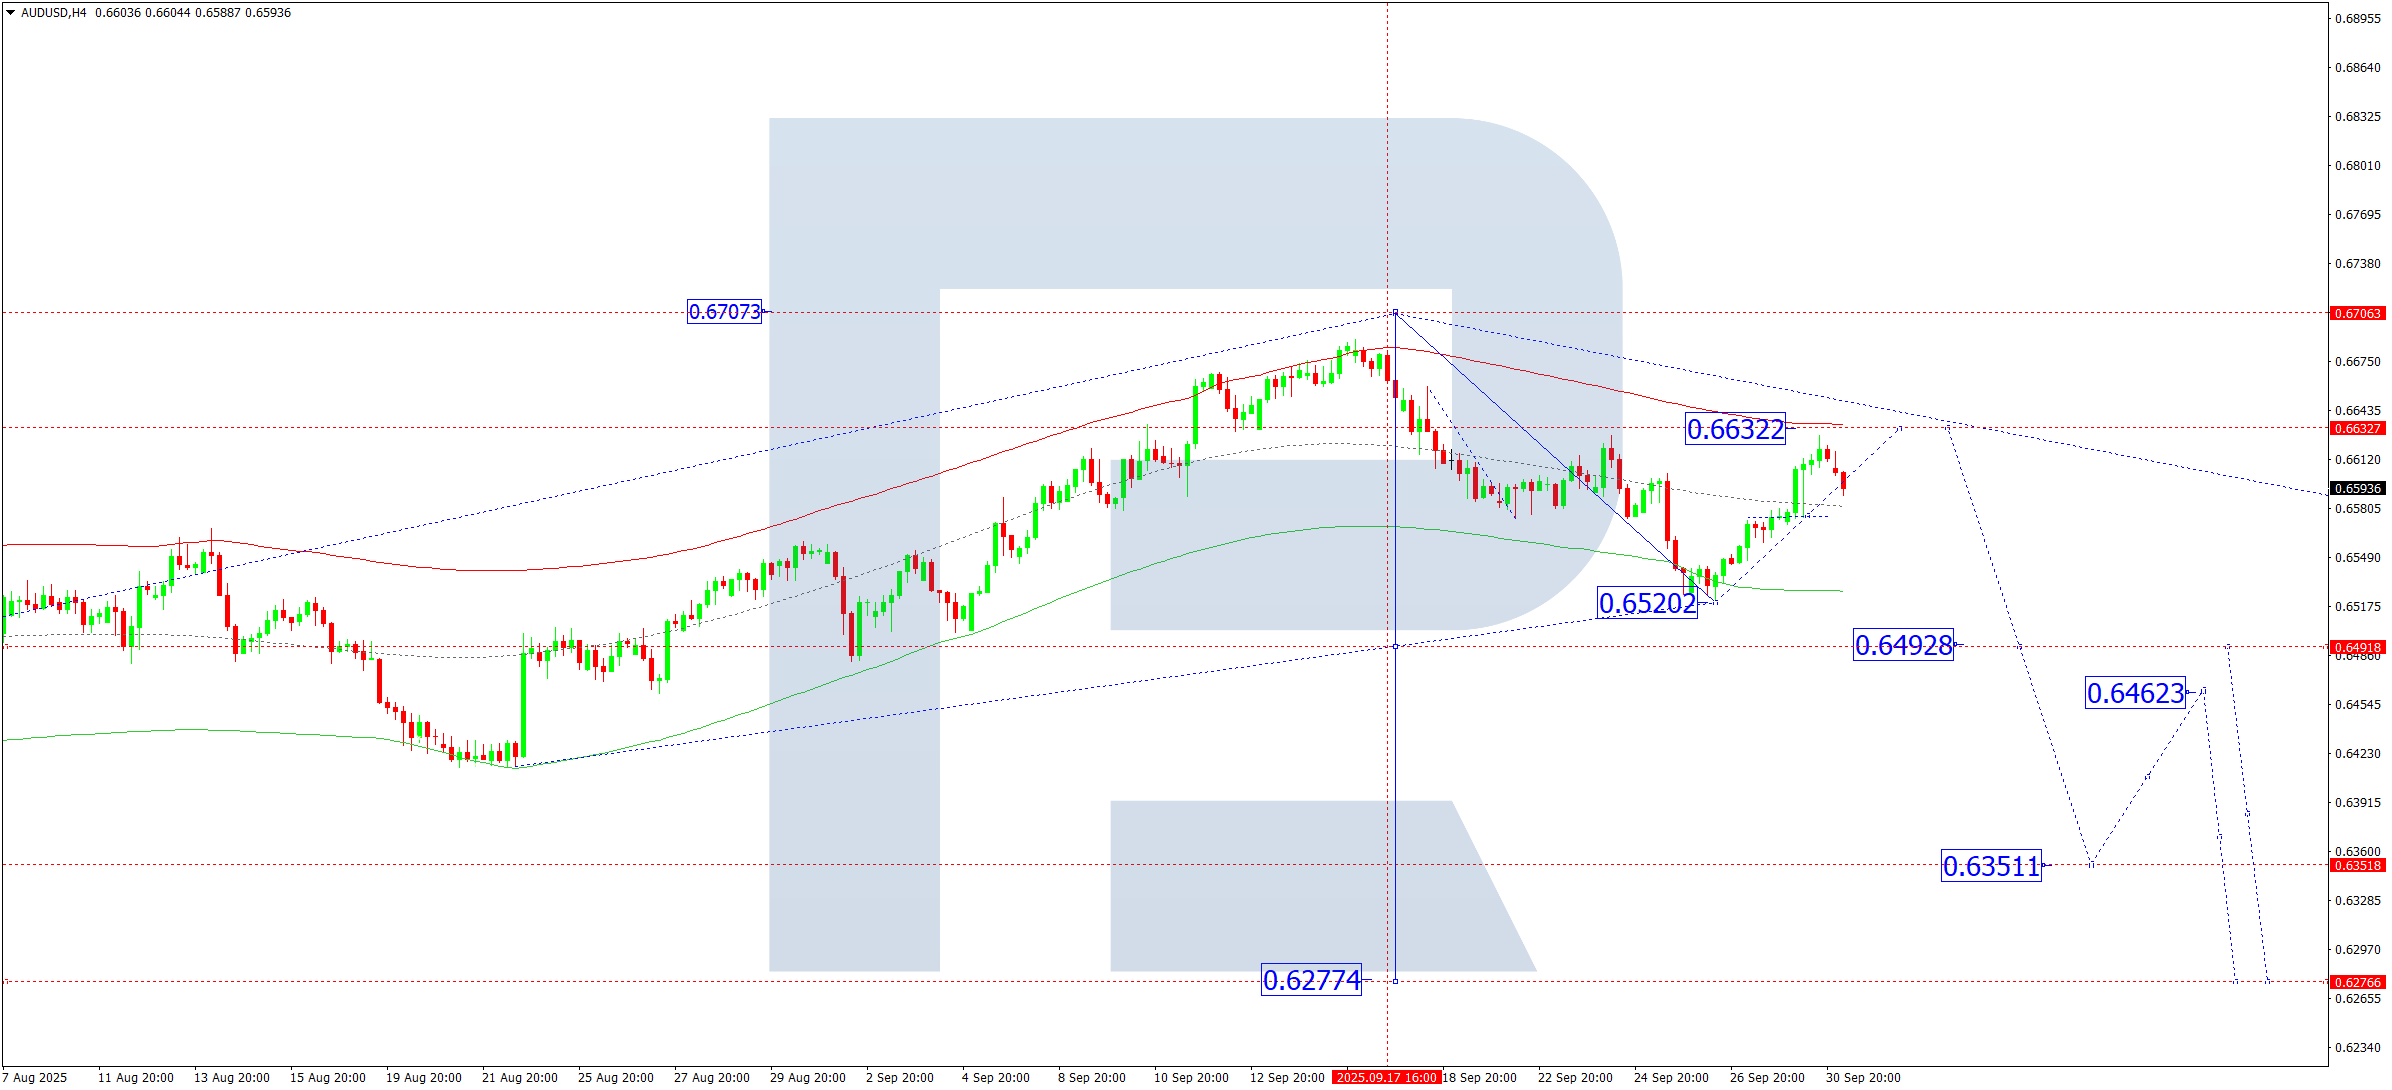
AUDUSD broke out of a consolidation around 0.6575 on the H4 timeframe, initiating a correction towards 0.6633. Today, 1 October 2025, after this correction concludes, a new bearish wave could begin, initially targeting 0.6493. A break below this level may drive the pair further down to 0.6350.
This outlook is supported by the Elliott Wave formation and bearish wave matrix with a pivot at 0.6633. The market has recently rebounded from the lower Price Envelope boundary at 0.6520, with the upper limit near 0.6633 now in focus.
Technical Insight: Completion of the corrective phase around 0.6633 may give way to renewed selling pressure targeting 0.6493 and lower.
USDCAD Forecast
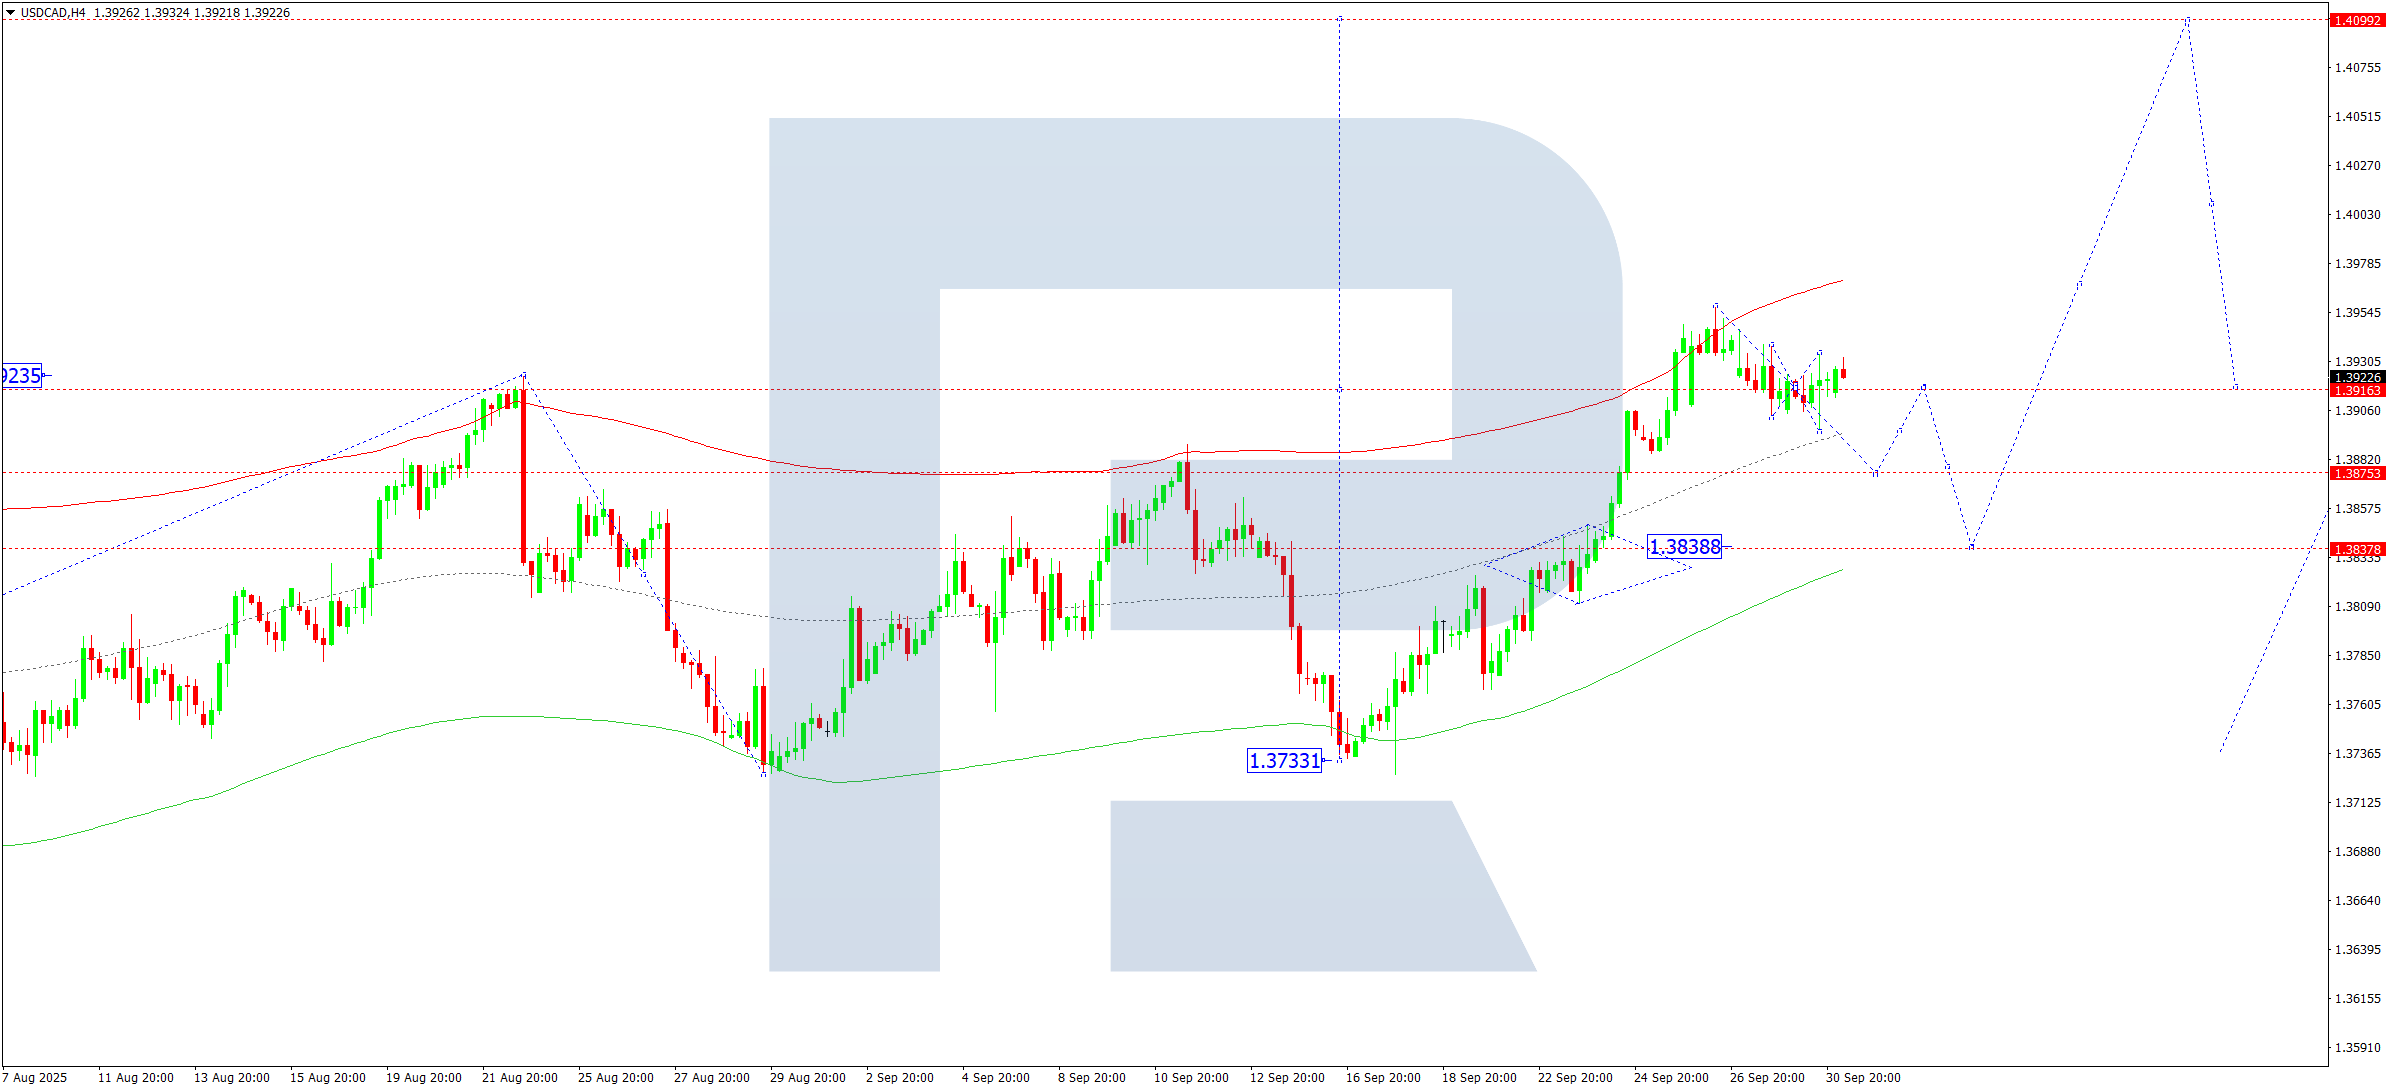
USDCAD remains in a consolidation phase around 1.3916 on the H4 chart. A downside breakout today, 1 October 2025, could extend the correction to 1.3875, and possibly to 1.3838. Following this move, the market may reverse upwards towards 1.3970, with further growth possible up to 1.4100.
The Elliott Wave structure and bullish matrix with a pivot at 1.3838 back this view. The market recently reached the upper Price Envelope boundary at 1.3957, and a pullback towards the lower edge at 1.3838 seems plausible.
Technical Insight: A short-term correction to 1.3838 is expected before potential resumption of the uptrend.
XAUUSD (Gold) Forecast
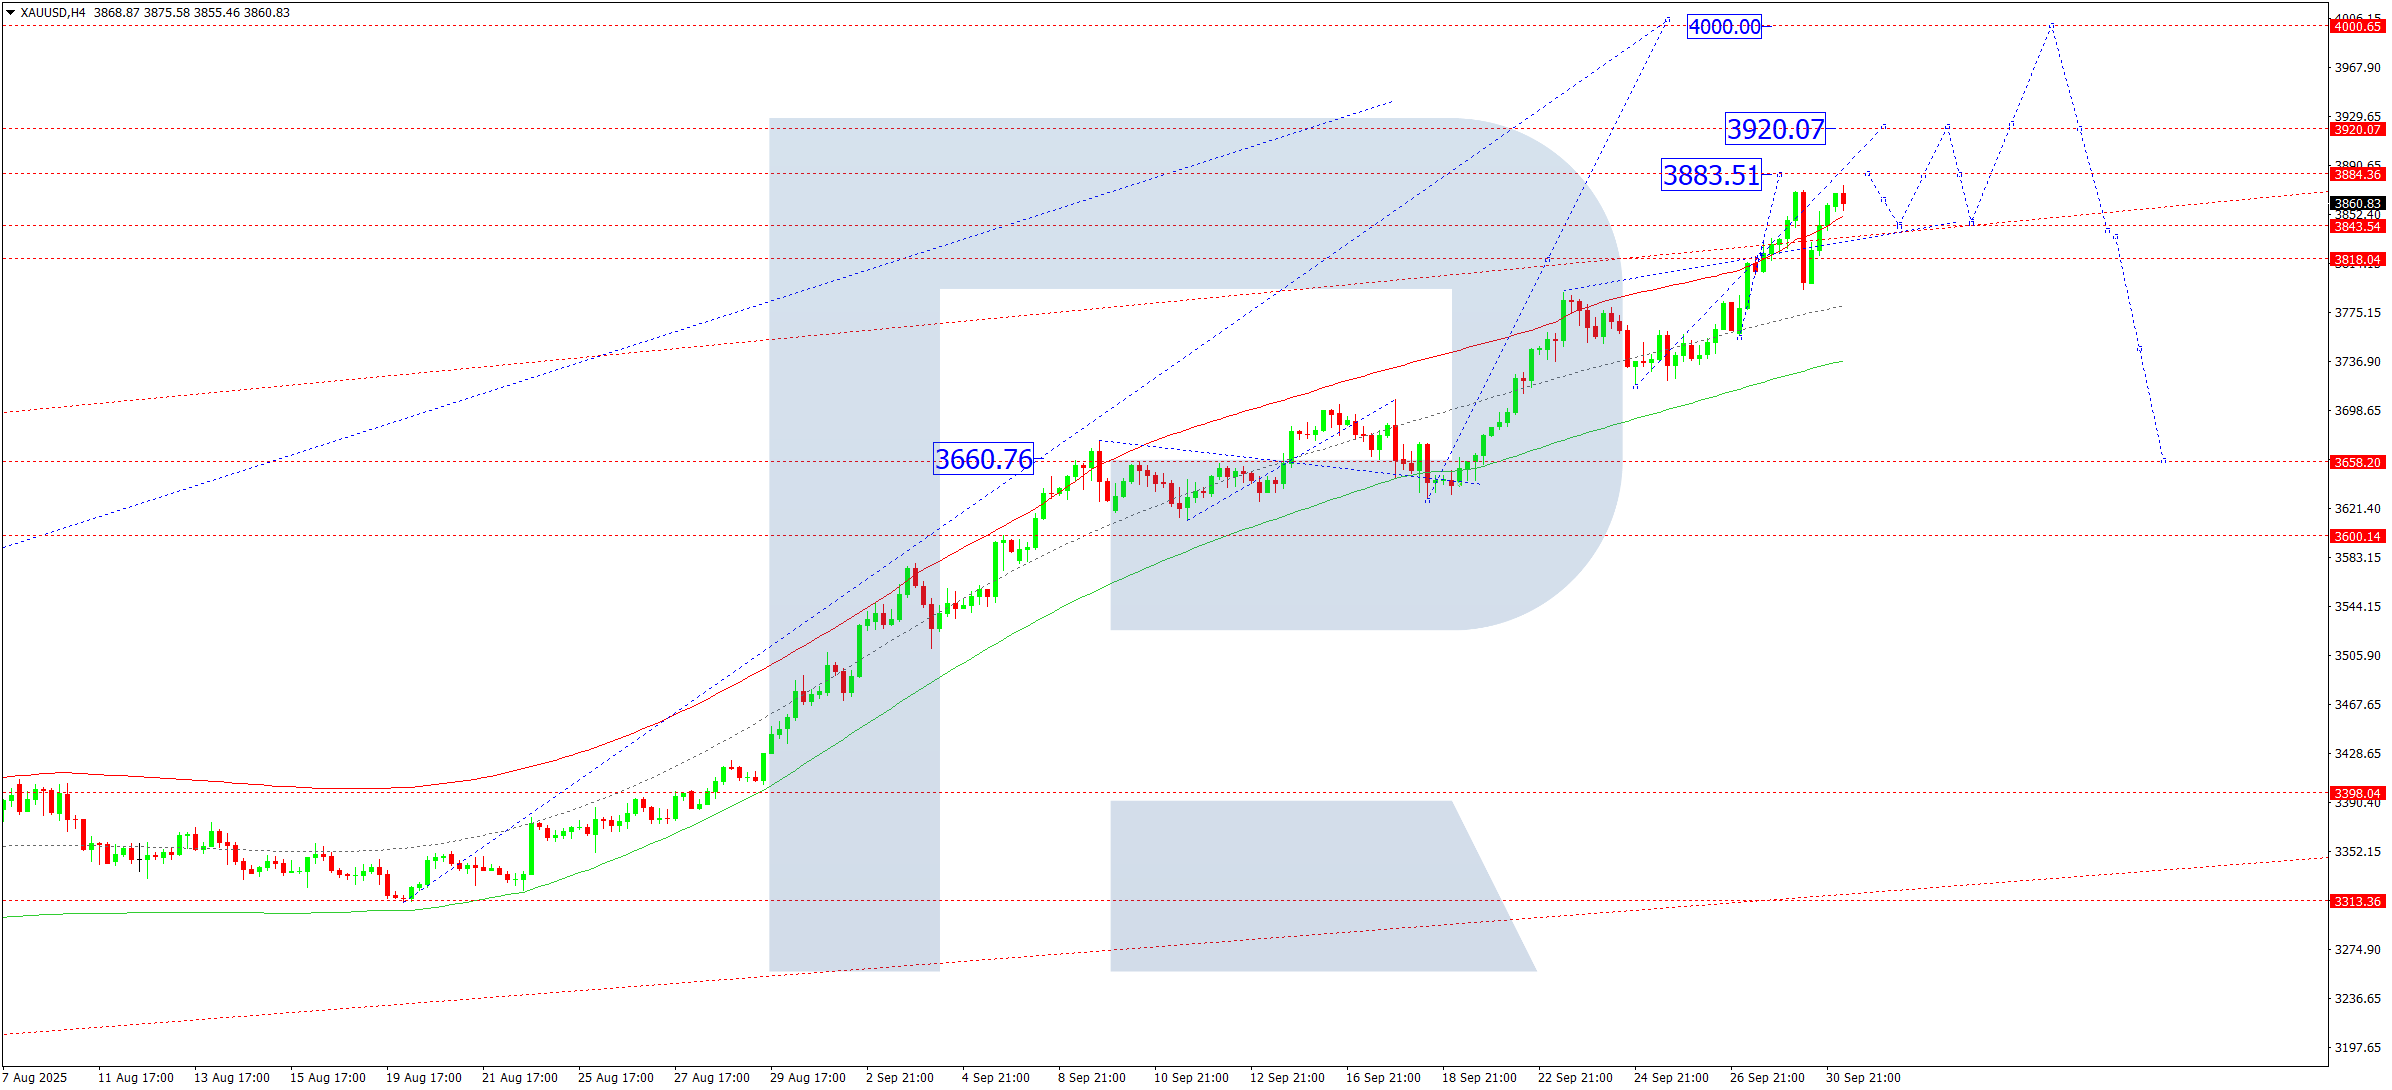
Gold (XAUUSD) completed an upward move to 3870 and corrected back to 3795. On 1 October 2025, a consolidation phase above 3795 is visible. A breakout above this range could extend gains to 3883 and further to 3920.
The bullish Elliott Wave structure and wave matrix centered at 3660 support this scenario. The market is now targeting the upper Price Envelope boundary at 3920, with a potential correction to the midline at 3820 expected afterward.
Technical Insight: Continued upward movement to 3883 and 3920 remains likely, with a potential pullback afterward.
Brent Crude Forecast
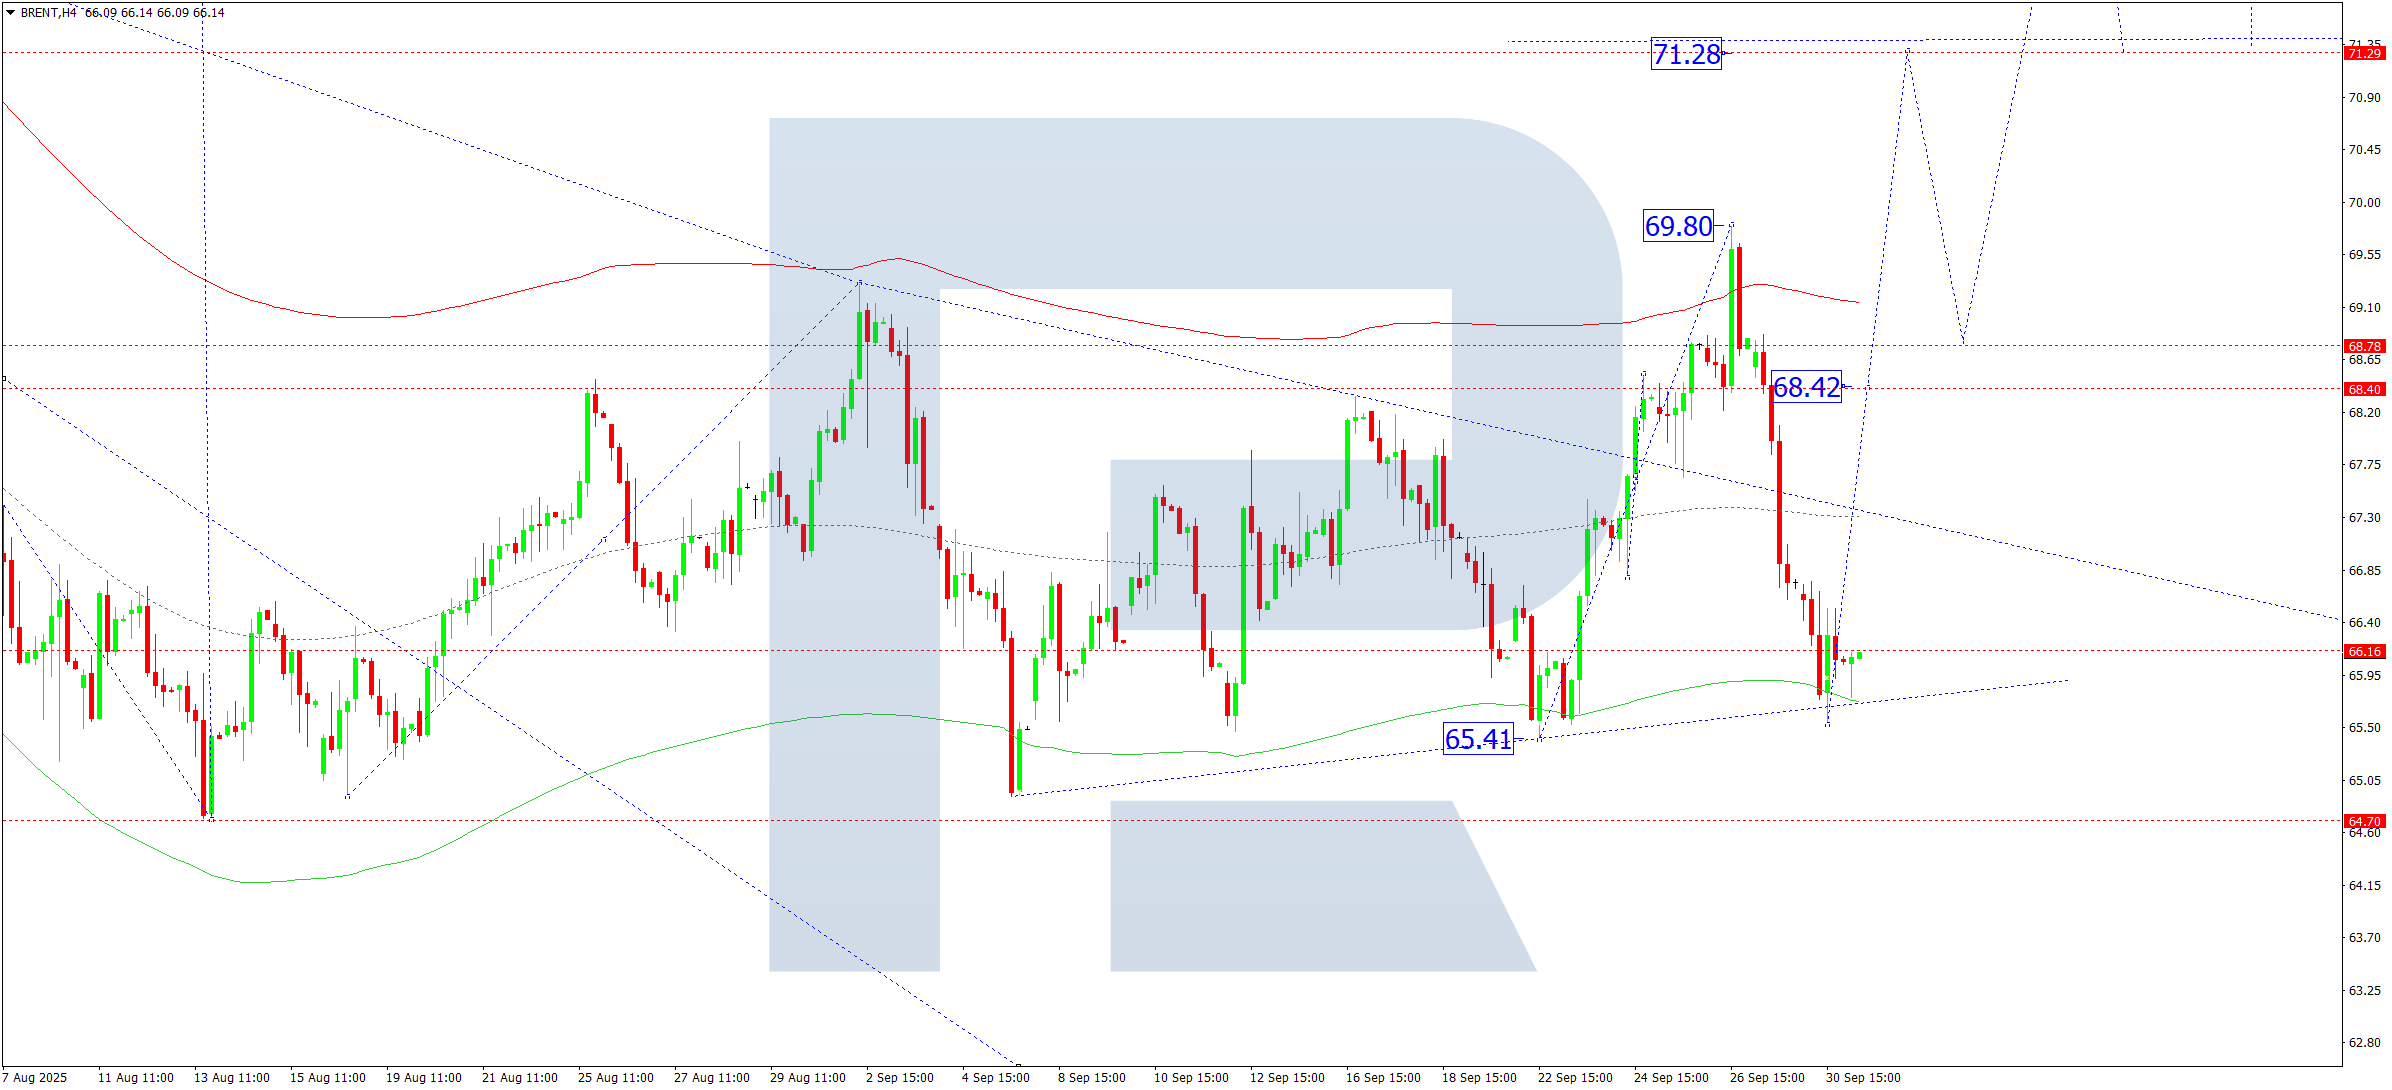
Brent Crude recently corrected to 65.55 and is currently consolidating above this level on the H4 chart. On 1 October 2025, a breakout to the upside could initiate a new bullish wave targeting 68.40, with potential extension to 71.30. Alternatively, a downside break may lead to a further decline towards 64.70.
The Elliott Wave structure and bullish wave matrix pivoting at 67.66 suggest the upward scenario as the primary outlook. The price has recently tested the lower Price Envelope boundary at 65.55, and a move towards the upper boundary at 68.40 appears likely.
Technical Insight: A bullish breakout from consolidation may lead to targets at 68.40 and 71.28, unless support at 65.55 fails.
Risk Disclaimer:
Past trading performance is not indicative of future results. All analysis presented is for informational purposes only and should not be construed as investment advice.
Leave a Reply