
Daily Technical Analysis and Forecast – 2 October 2025
EURUSD Forecast
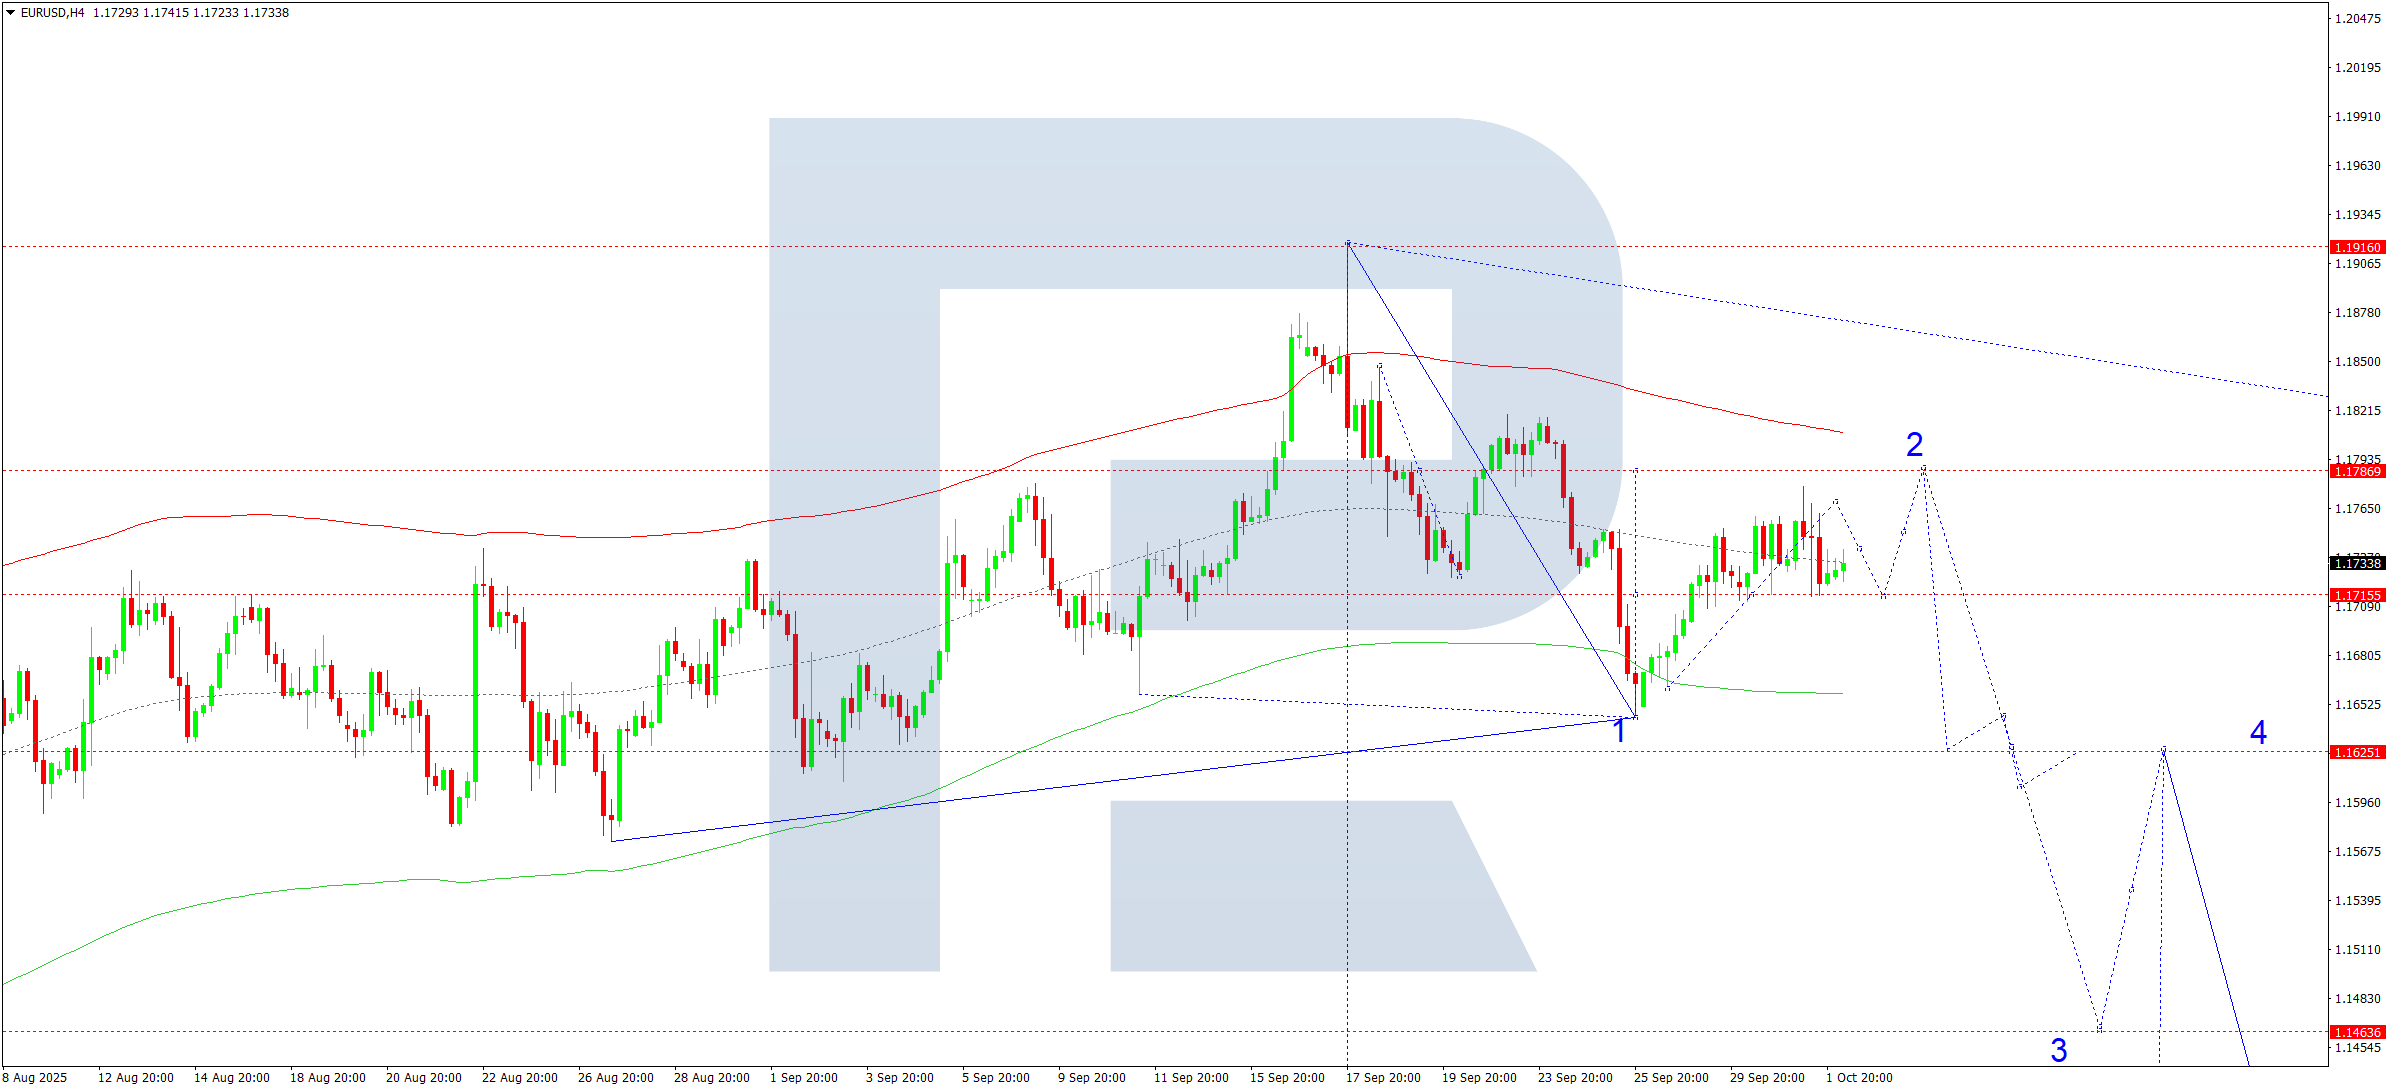
On the H4 chart, EURUSD is consolidating above 1.1715, with a temporary upward extension to 1.1778. For today, 2 October 2025, the pair is forming a downward move towards 1.1705, potentially followed by a corrective bounce to 1.1745. If this level breaks, further upside to 1.1786 is possible.
However, this entire upward move is interpreted as a correction within a broader bearish trend. Once the correction completes, a new downward wave towards 1.1625 may develop, with a possible continuation to 1.1464 as a medium-term target.
The Elliott Wave structure and the bearish Matrix (pivot at 1.1786) confirm this outlook. Currently, the price is near the lower boundary of the Price Envelope at 1.1645. For today, consolidation near the envelope’s midline at 1.1715 is likely, before potentially resuming the correction towards the upper edge at 1.1786.
Forecast Summary: A corrective move to 1.1786 is likely, followed by a decline to 1.1700.
USDJPY Forecast
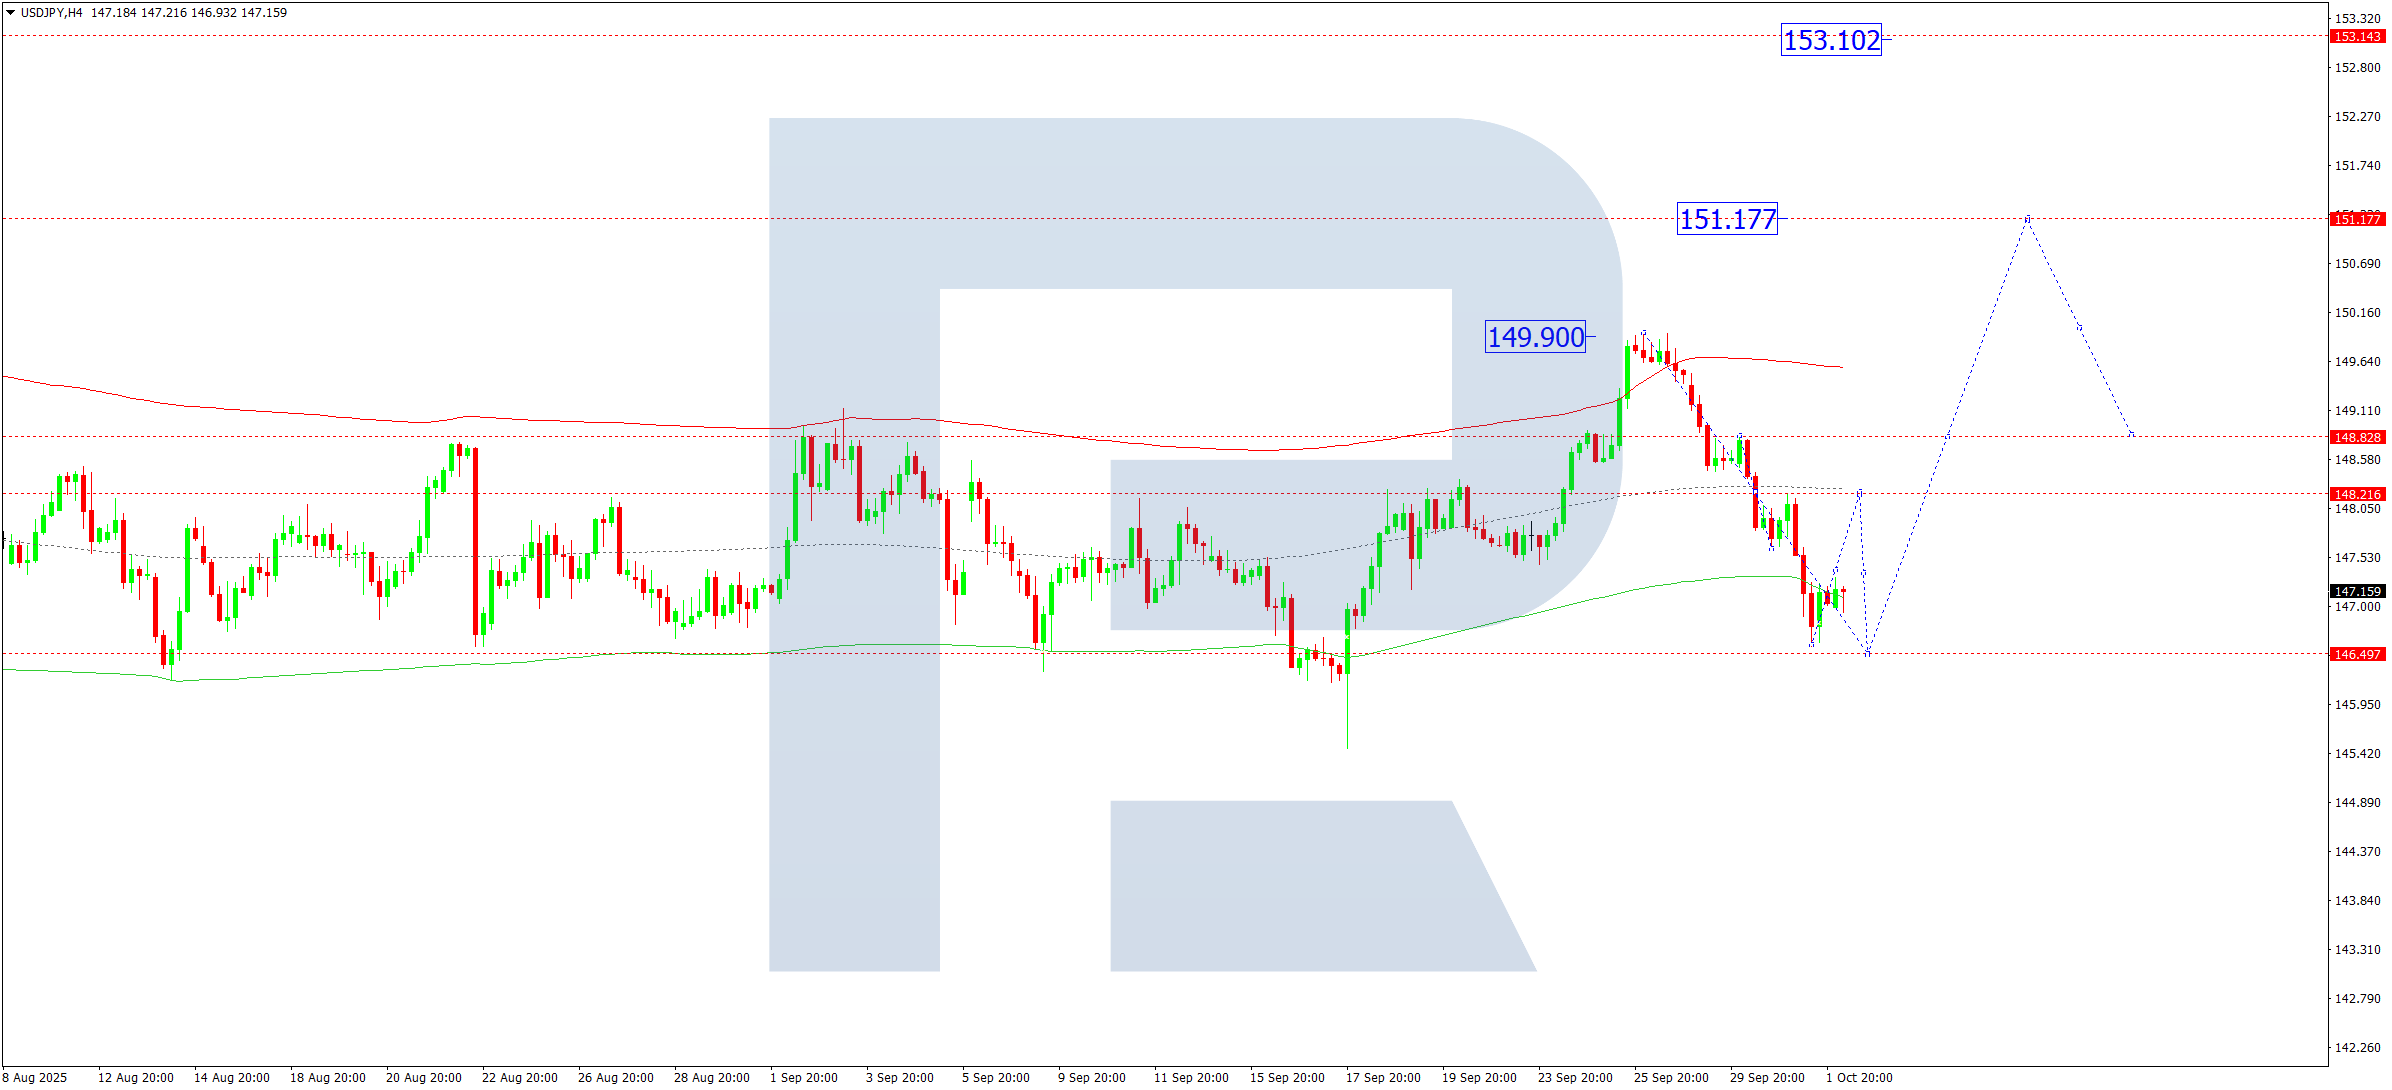
On the H4 timeframe, USDJPY has completed its correction to 146.60. Today, the pair is expected to initiate a new upward wave towards 148.22, with a possible pullback to 146.50 before continuing higher. If that correction holds, the next growth leg may target 148.88, with a broader uptrend aiming for 151.17. Later on, a retracement to 149.00 may occur, followed by another move higher towards 153.15.
This bullish scenario is supported by the Elliott Wave formation and an upward Matrix with a key pivot at 147.75. The price recently reached the upper boundary of the Price Envelope at 149.90, and today’s focus is on a potential correction towards the lower boundary at 146.50, followed by a continuation towards 151.15.
Forecast Summary: Expected rise towards 151.15 following a potential dip to 146.50.
GBPUSD Forecast
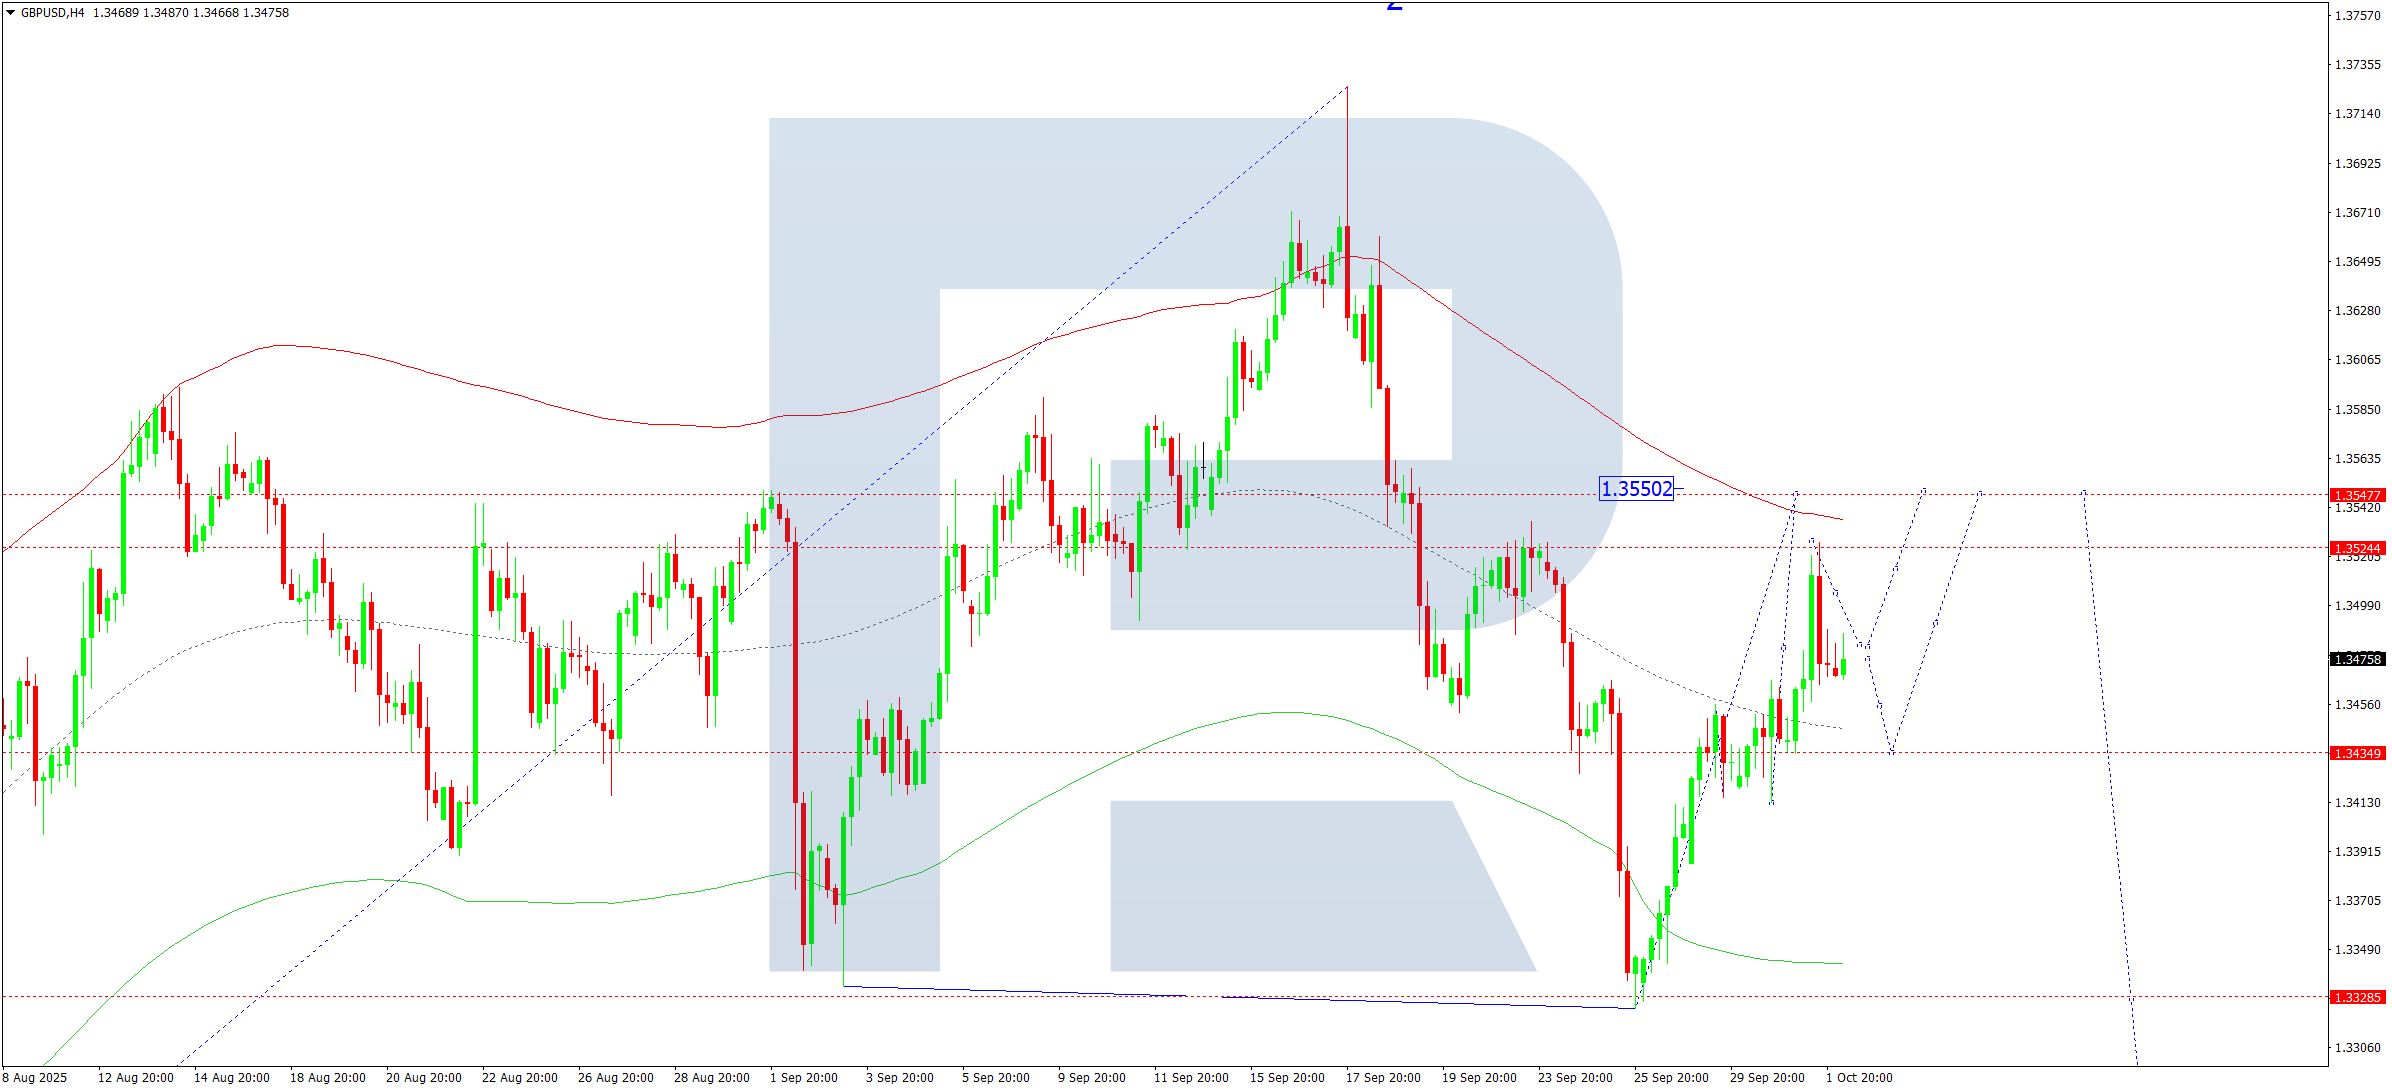
The GBPUSD has corrected to 1.3525 and then dropped to 1.3464 on the H4 chart. As of today, the market is consolidating above 1.3464. A downward breakout could trigger a move to 1.3422, and if this support fails, the downtrend may extend to 1.3322 or even 1.3100 in the medium term.
An upward breakout from the current consolidation might result in a brief rise to 1.3550, but this level is a key pivot. A subsequent reversal towards 1.3422 is then likely.
Technically, the Elliott wave structure and bearish Matrix with a pivot at 1.3550 support this view. The price recently reached the lower boundary of the Price Envelope at 1.3323. A short-term correction may carry the price to the upper boundary at 1.3550, followed by a resumption of the downward trend.
Forecast Summary: Possible correction to 1.3550, then decline to 1.3322.
AUDUSD Forecast
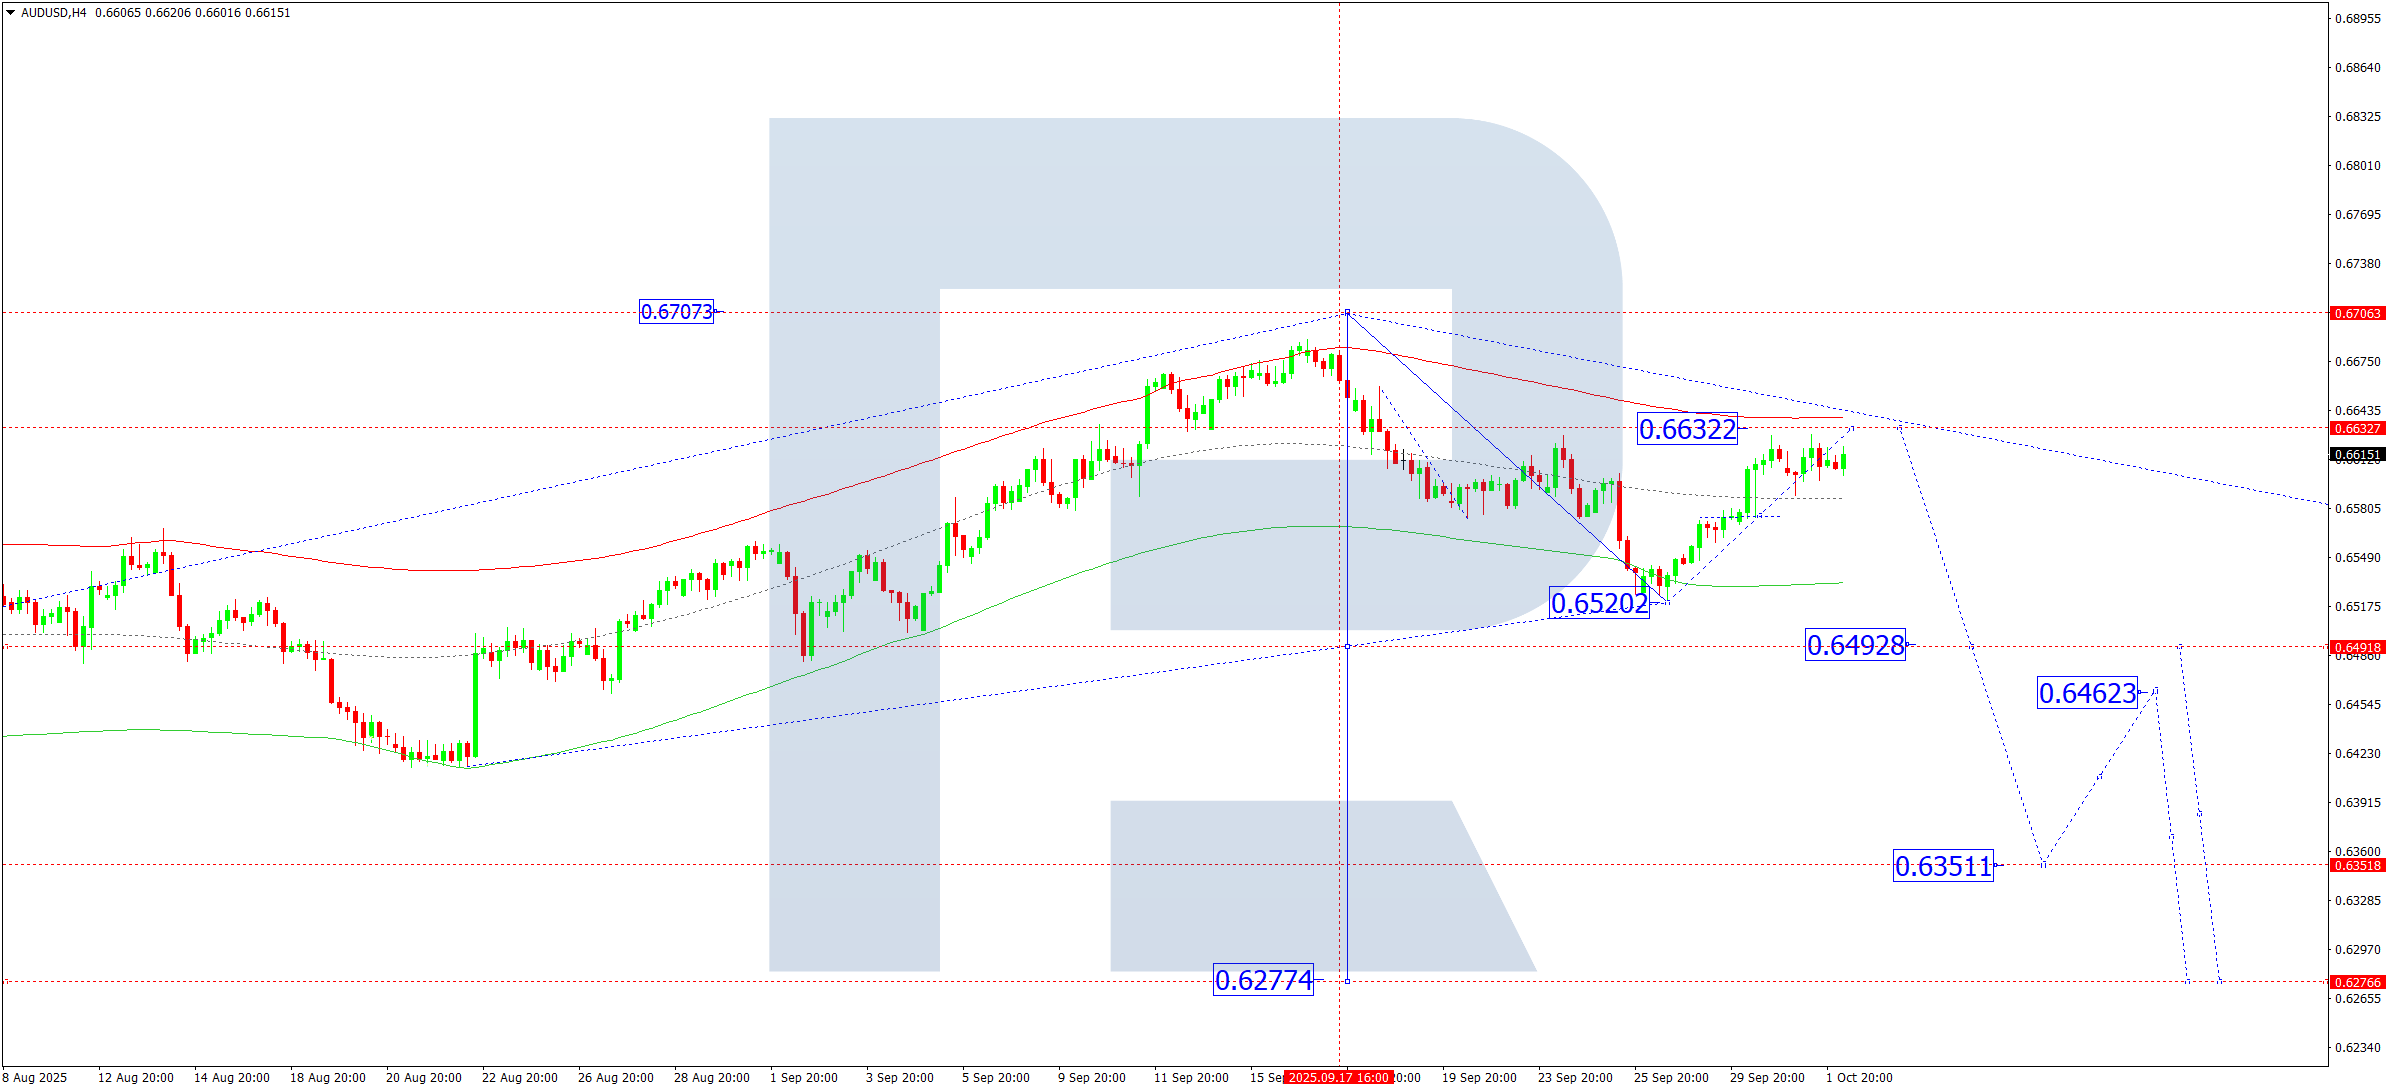
AUDUSD completed a correction towards 0.6627 on the H4 timeframe and is currently consolidating just below that level. A minor expansion to 0.6633 could occur, marking the end of the correction phase.
A fresh downward wave may then target 0.6565, followed by a drop to 0.6490 and potentially down to 0.6351.
This bearish outlook is reinforced by the Elliott Wave structure and a downward Matrix with a key pivot at 0.6633. Price recently reached the lower boundary of the Price Envelope at 0.6520, and a correction to the upper edge at 0.6633 could complete today before the next bearish wave begins.
Forecast Summary: Correction may complete at 0.6633, followed by a decline to 0.6493.
USDCAD Forecast
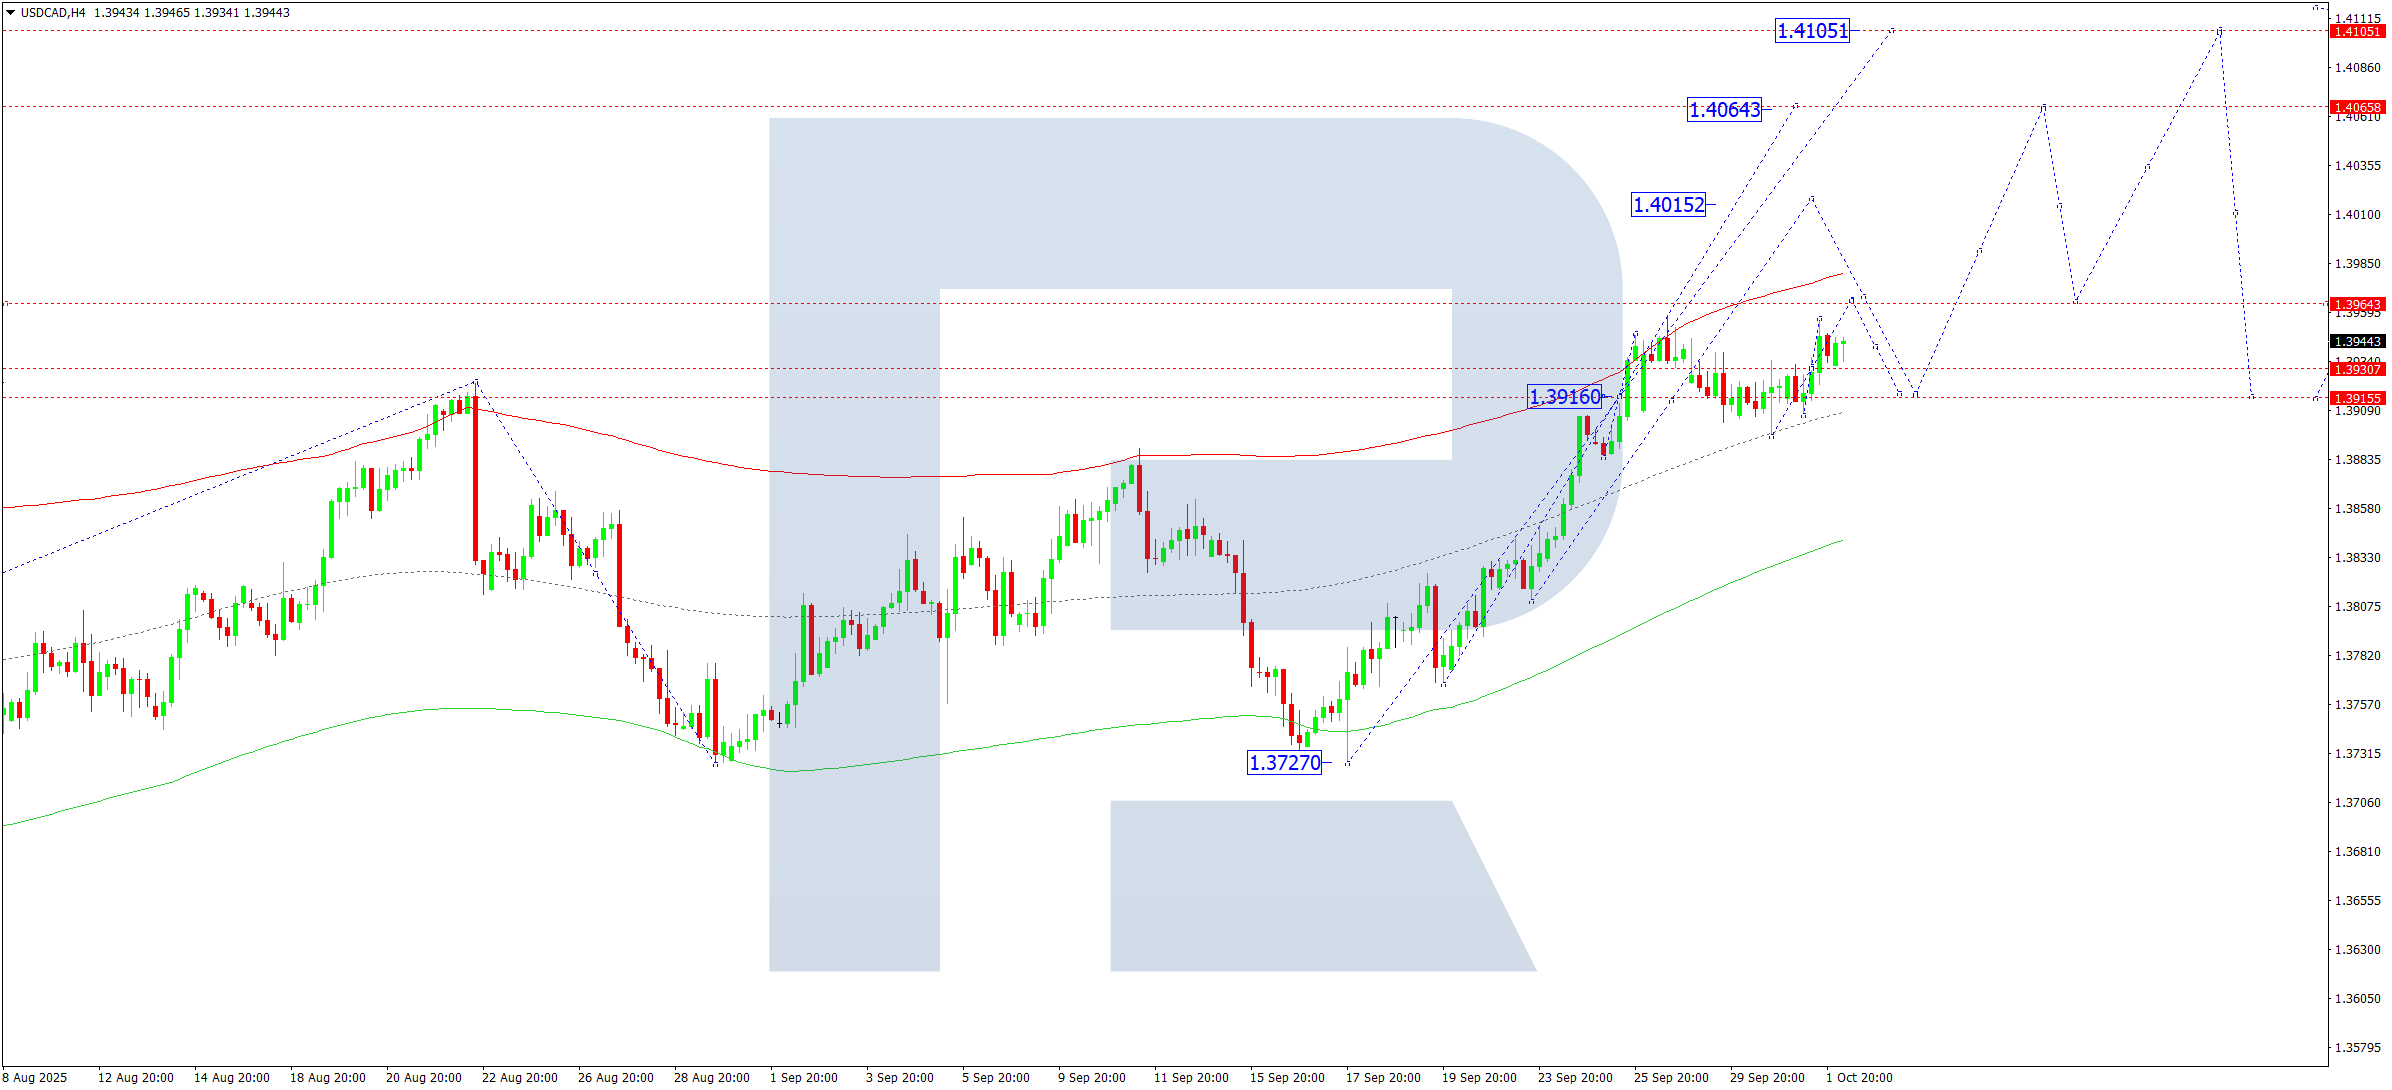
On the H4 chart, USDCAD continues to consolidate around 1.3930. Today, a potential expansion to 1.3964 is expected, followed by a correction to 1.3916. A break below 1.3916 could lead to a move down to 1.3850.
If the market breaks upwards, further growth to 1.4015, and then 1.4064–1.4100, is on the table.
The technical scenario is supported by the Elliott wave and a bullish Matrix with a pivot at 1.3838. The pair is currently approaching the upper boundary of the Price Envelope at 1.3964, and a pullback to its central line at 1.3916 is expected afterwards.
Forecast Summary: Continued rise to 1.3964, then potential drop to 1.3916.
XAUUSD (Gold) Forecast
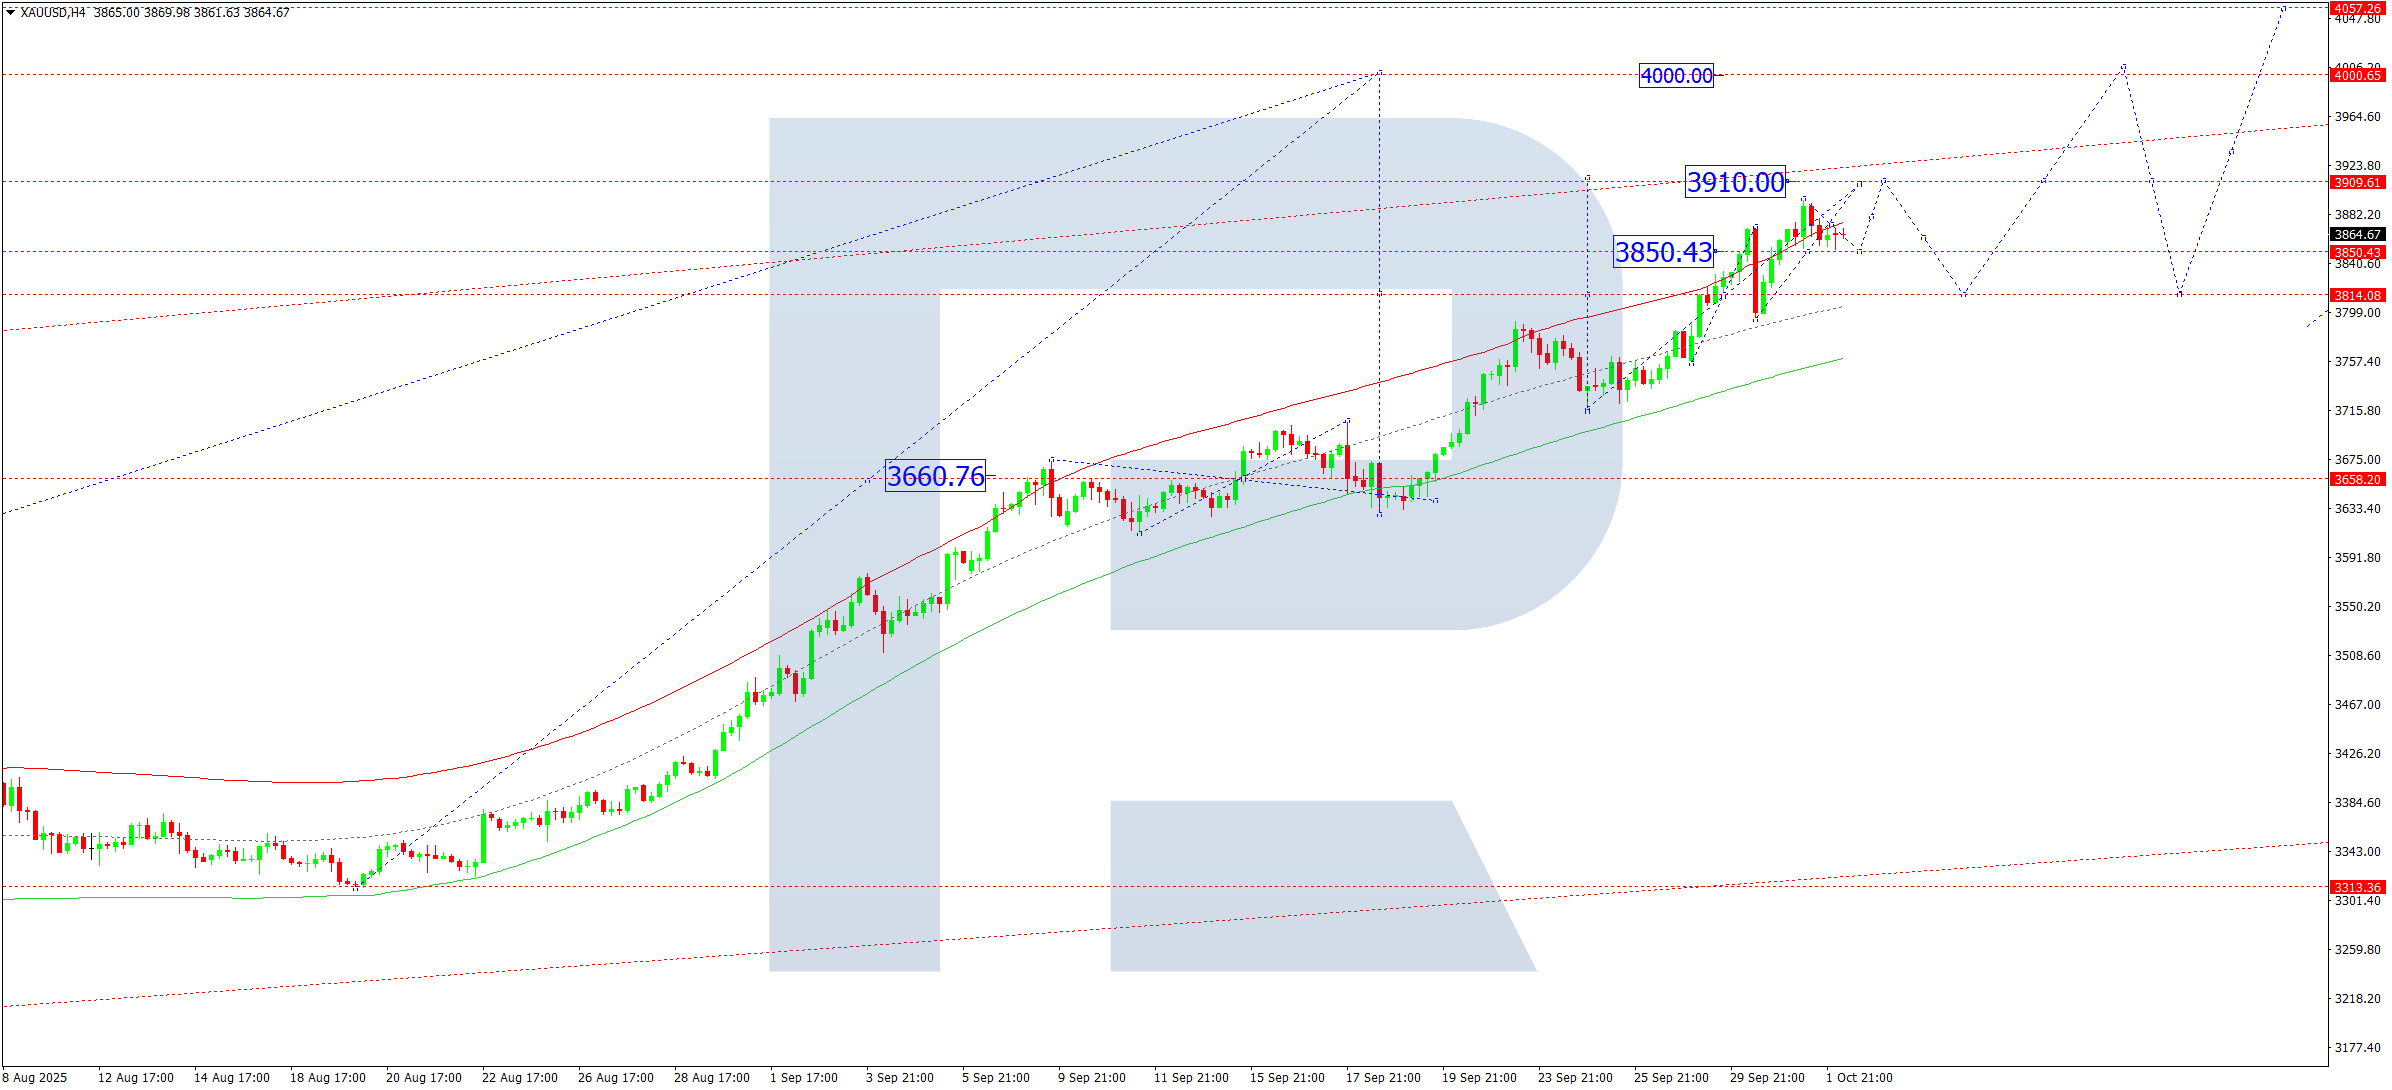
Gold (XAUUSD) completed a growth wave to 3,895, followed by a correction to 3,850. A consolidation range is forming above this level on the H4 chart.
If an upward breakout occurs today, the market could rise to 3,910, and a break above that level would open the way to the key resistance zone around 4,000.
This scenario aligns with the Elliott wave structure and an upward Matrix with a key pivot at 3,660. Currently, the price is advancing towards the upper boundary of the Price Envelope at 3,920, with a possible correction to the central line at 3,850 afterwards.
Forecast Summary: Likely rise to 3,910, with potential continuation to 4,000.
Brent Crude Oil Forecast
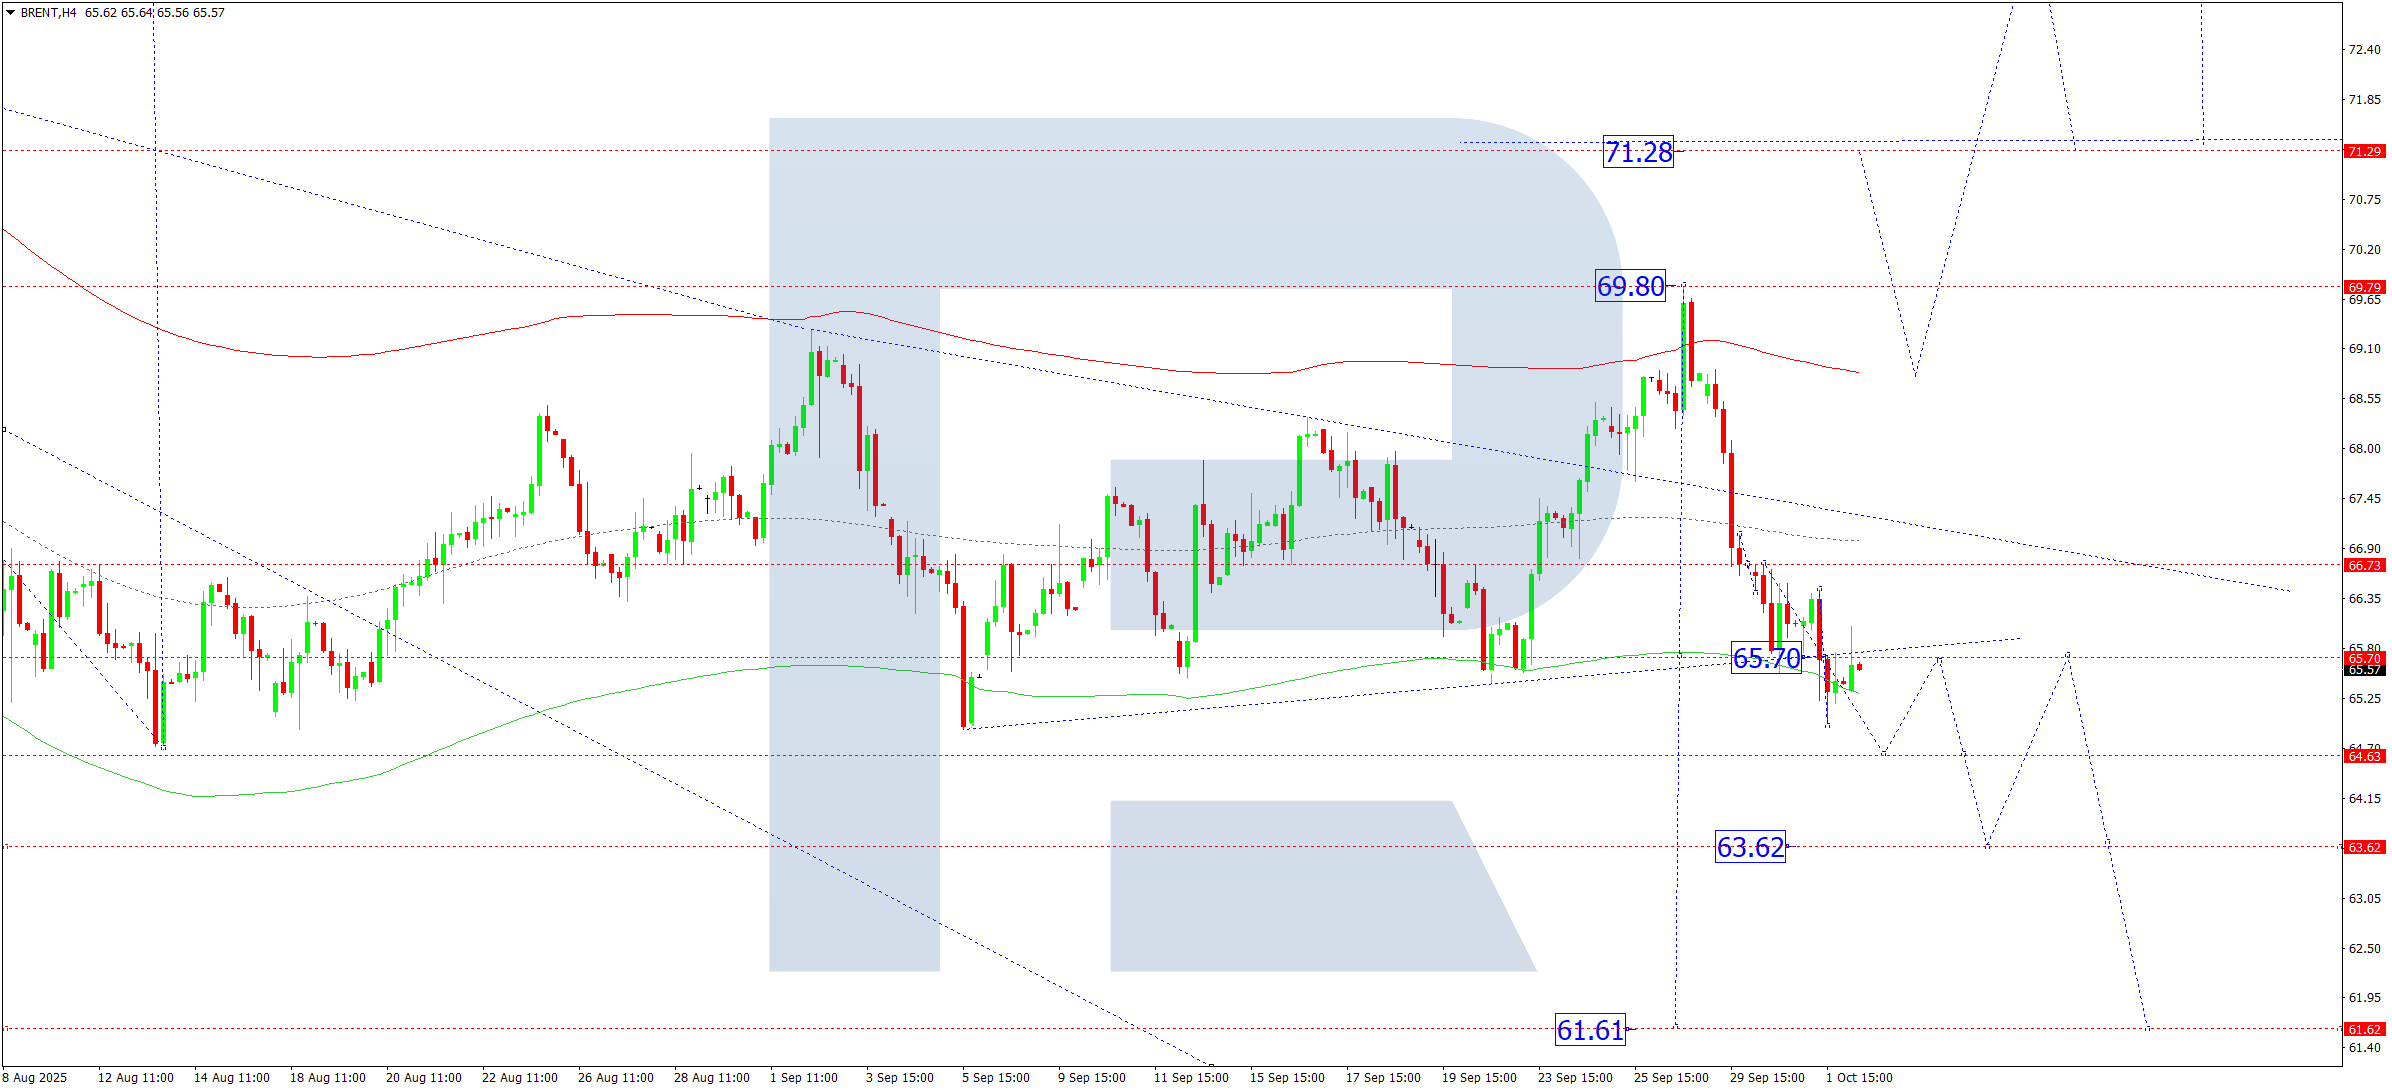
Brent crude is currently consolidating near 65.70 on the H4 chart. Today may see a dip to 64.64, followed by a return to 65.70. If an upward breakout occurs, a new bullish wave could target 68.40. Alternatively, a downward breakout would confirm a continuation of the bearish trend towards 63.63.
The Elliott wave structure and bearish Matrix with a pivot at 66.73 support this view. The market has already reached the lower boundary of the Price Envelope at 65.55, and further consolidation around 65.70 is expected. A breakout above this level would signal the beginning of a rally towards 68.40.
Forecast Summary: Short-term drop to 64.64, with possible reversal and breakout towards 68.40.
Risk Disclaimer
The performance of past trading strategies and outcomes does not guarantee similar results in the future. Always conduct your own research and manage risk appropriately.
Leave a Reply