
Daily Technical Analysis and Forecast – 10 October 2025
EURUSD Forecast
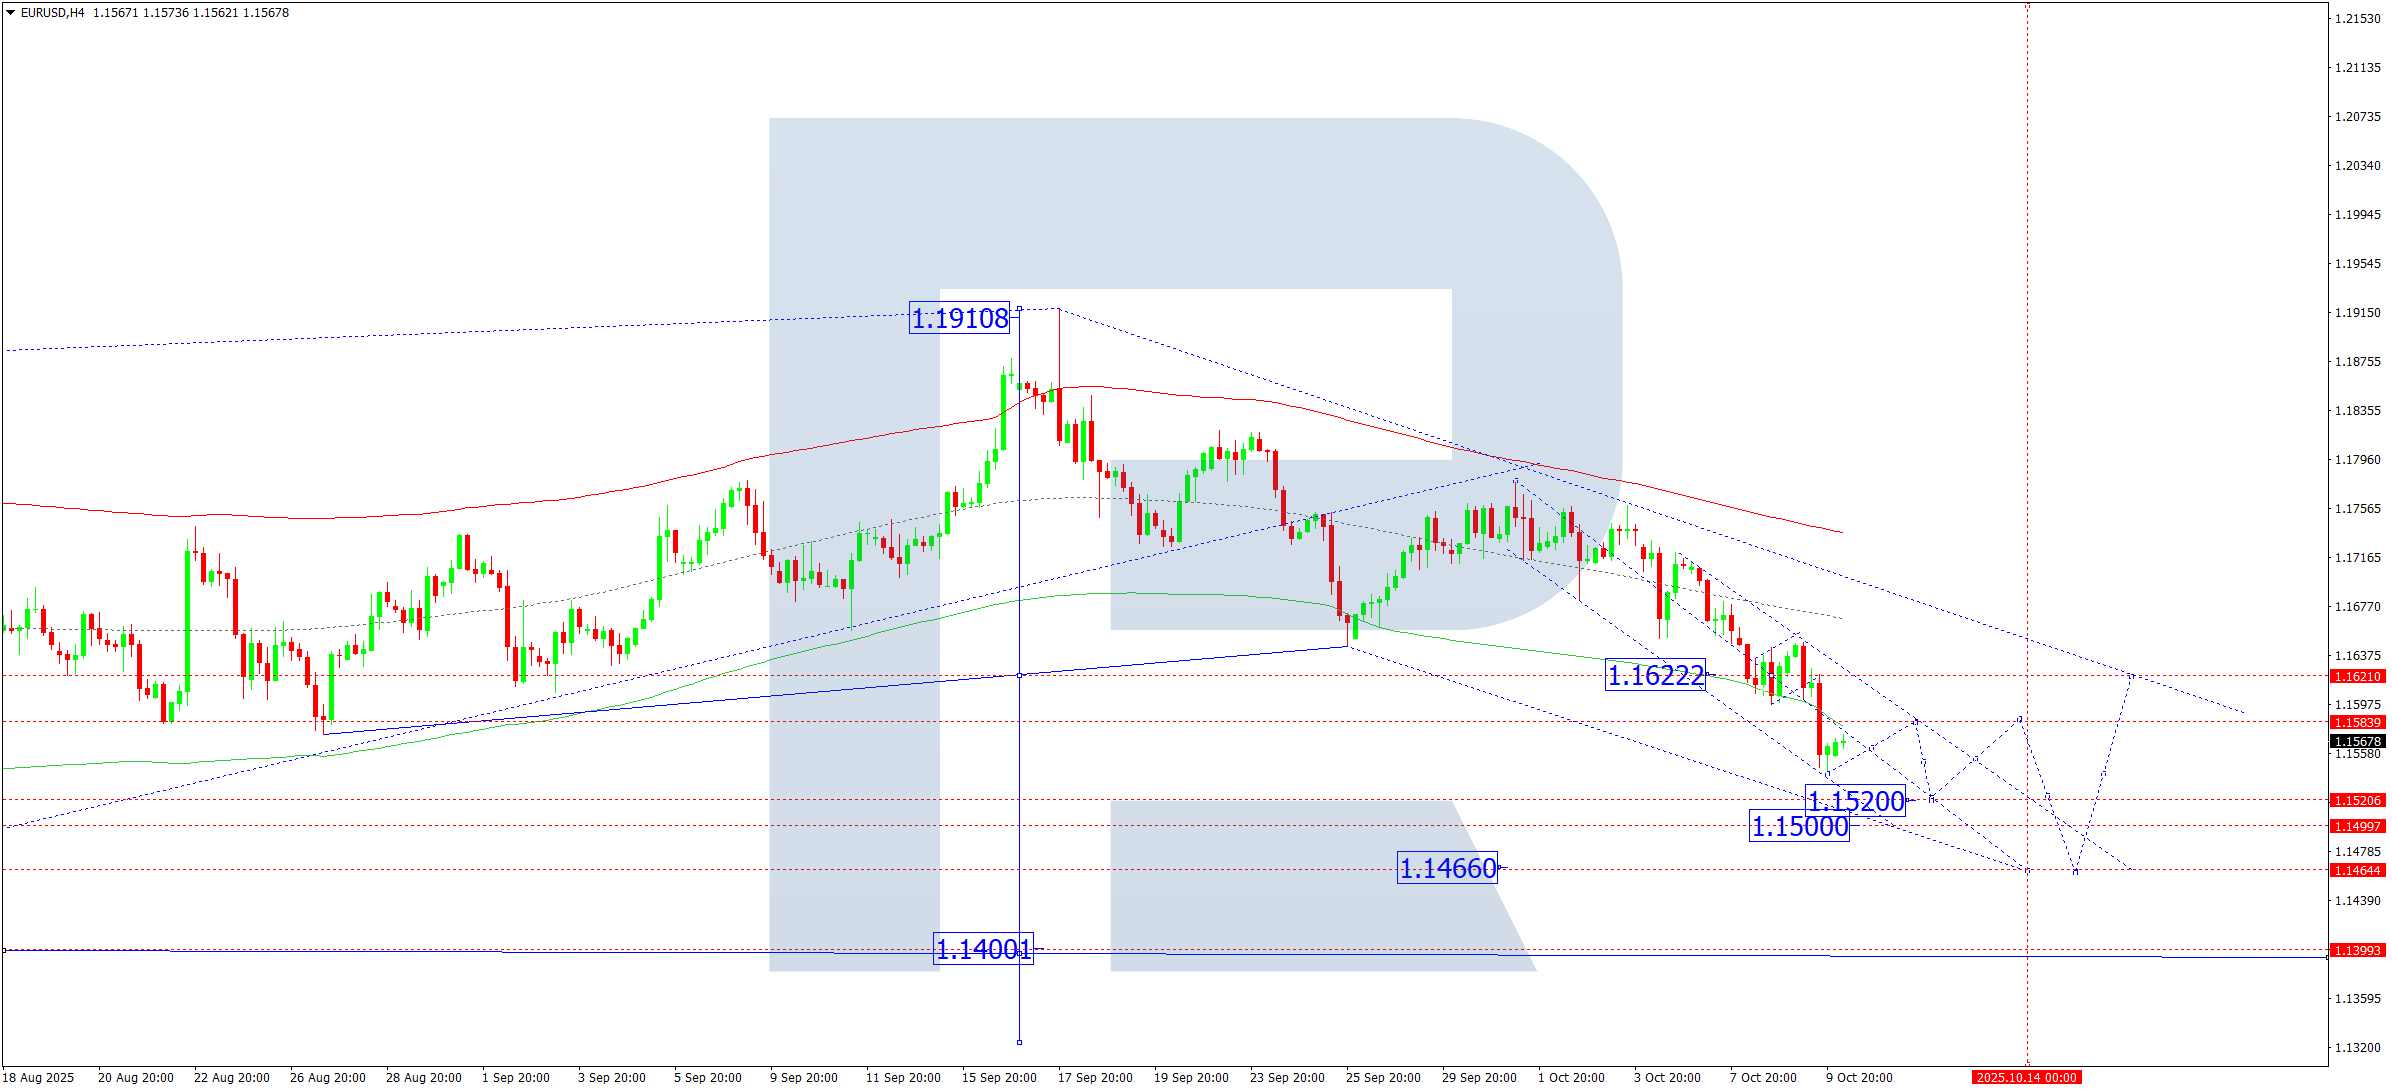
On the H4 chart, EURUSD has completed a downward wave to 1.1542. A corrective move toward 1.1580 is currently in progress. This correction is expected to conclude on 10 October 2025, potentially followed by a continued decline toward 1.1520, with extended targets at 1.1500 and 1.1466.
This bearish scenario is supported by the Elliott Wave structure and a prevailing downward wave matrix. The key pivot level remains at 1.1622. The price is anticipated to approach the lower boundary of the Price Envelope at 1.1520, with potential for further downside towards 1.1466.
Outlook: Technical indicators point to the development of a third downward wave, with a target near 1.1520.
USDJPY Forecast
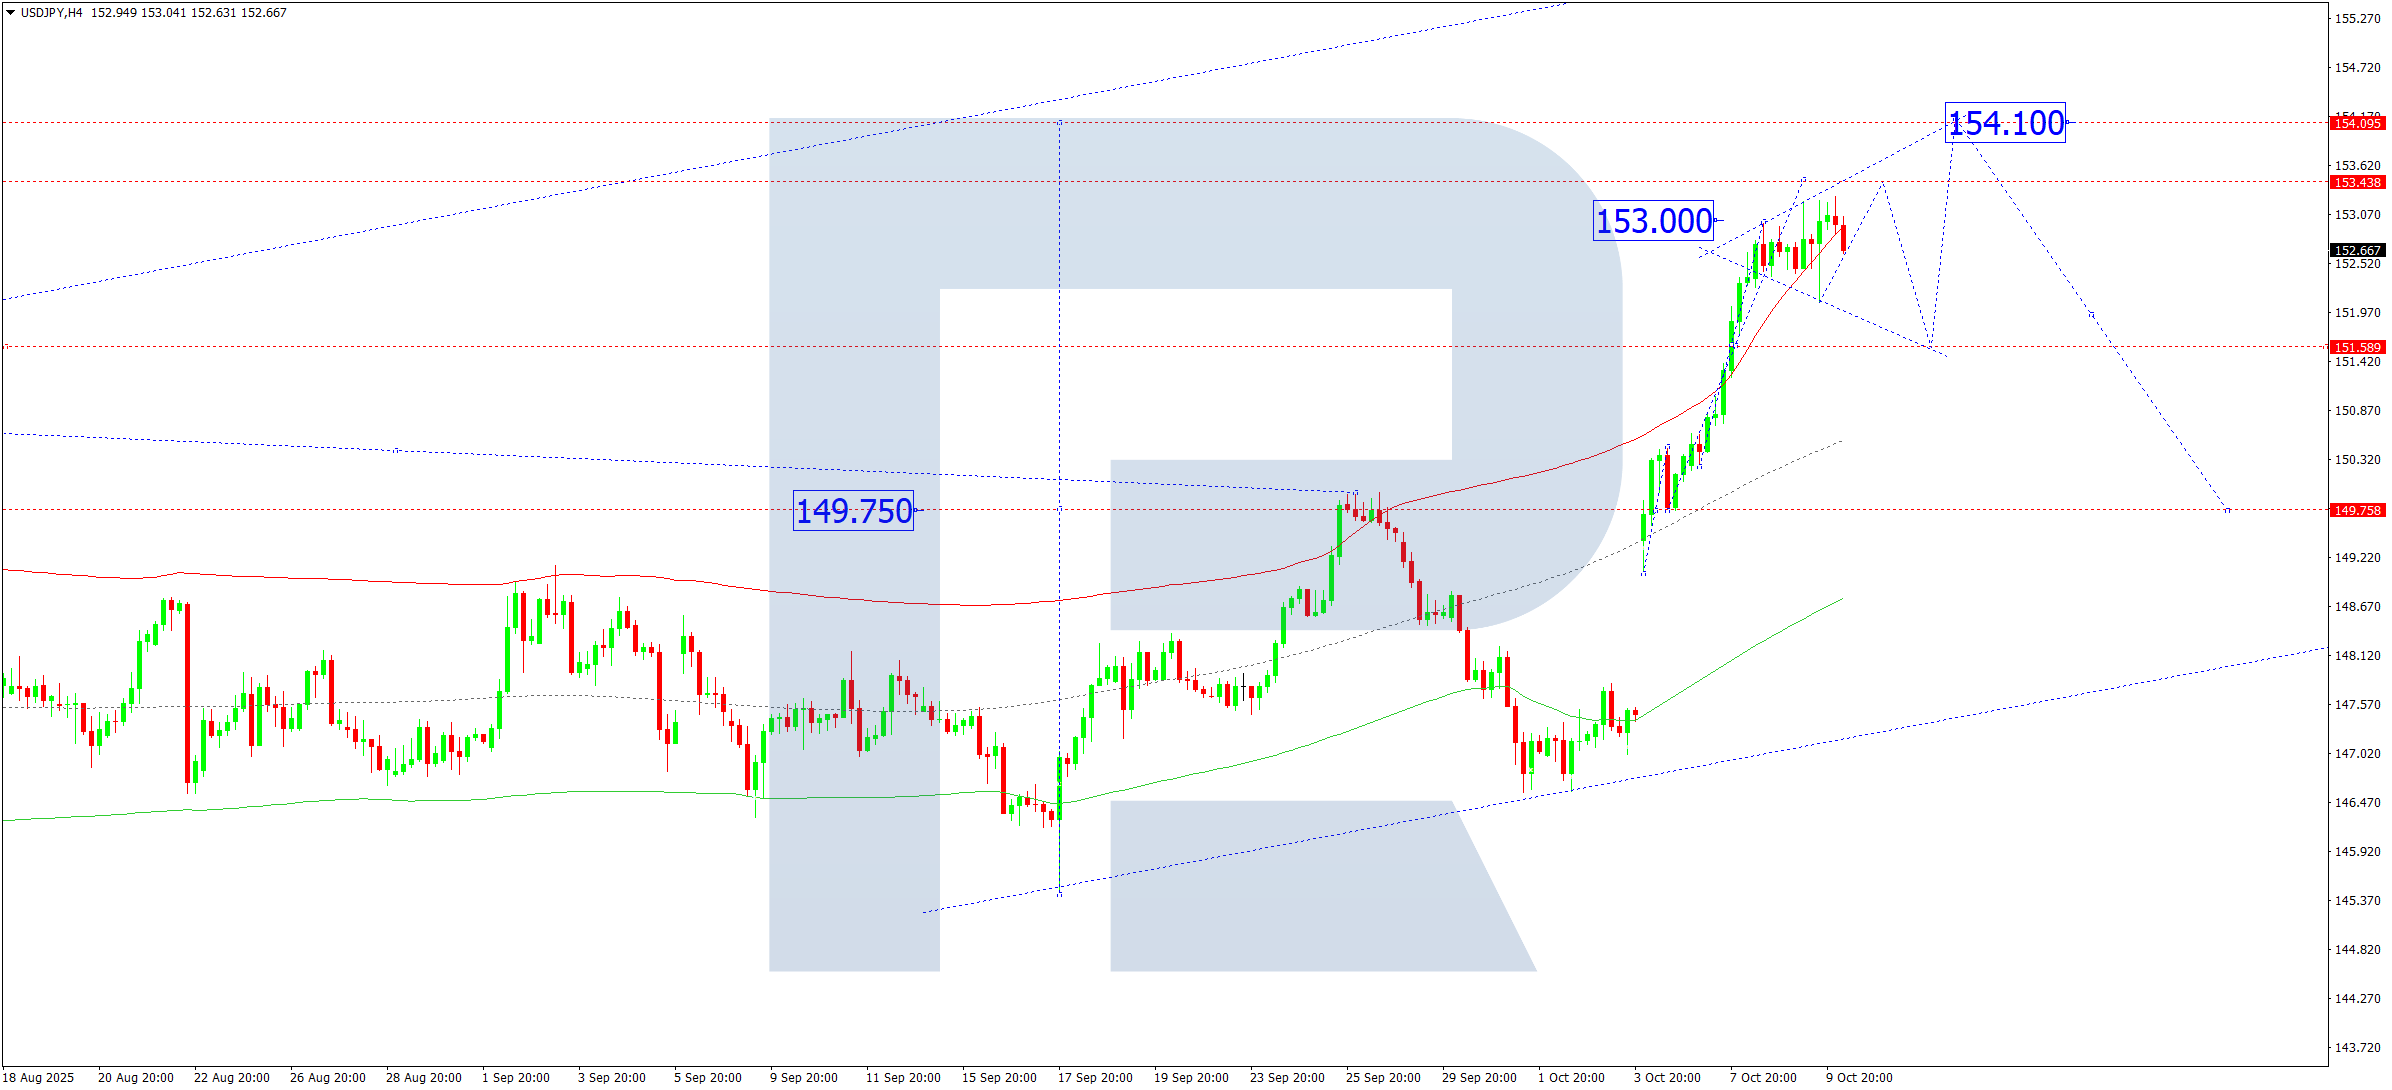
On the H4 timeframe, USDJPY has completed an upward movement to 153.25. A consolidation phase is expected below this level, possibly followed by a retracement toward 151.60. Subsequent growth toward 152.75 is anticipated. A breakout to the downside may trigger a correction to 149.76, while a breakout higher could extend gains toward 154.10.
Elliott Wave structure and the upward wave matrix support this bullish bias, with 149.76 acting as the key pivot level. The price is moving towards the upper Price Envelope boundary at 154.10, with prospects for an extended move to 156.90.
Outlook: Technical indicators suggest continued upside potential toward 154.10 and 156.90.
GBPUSD Forecast
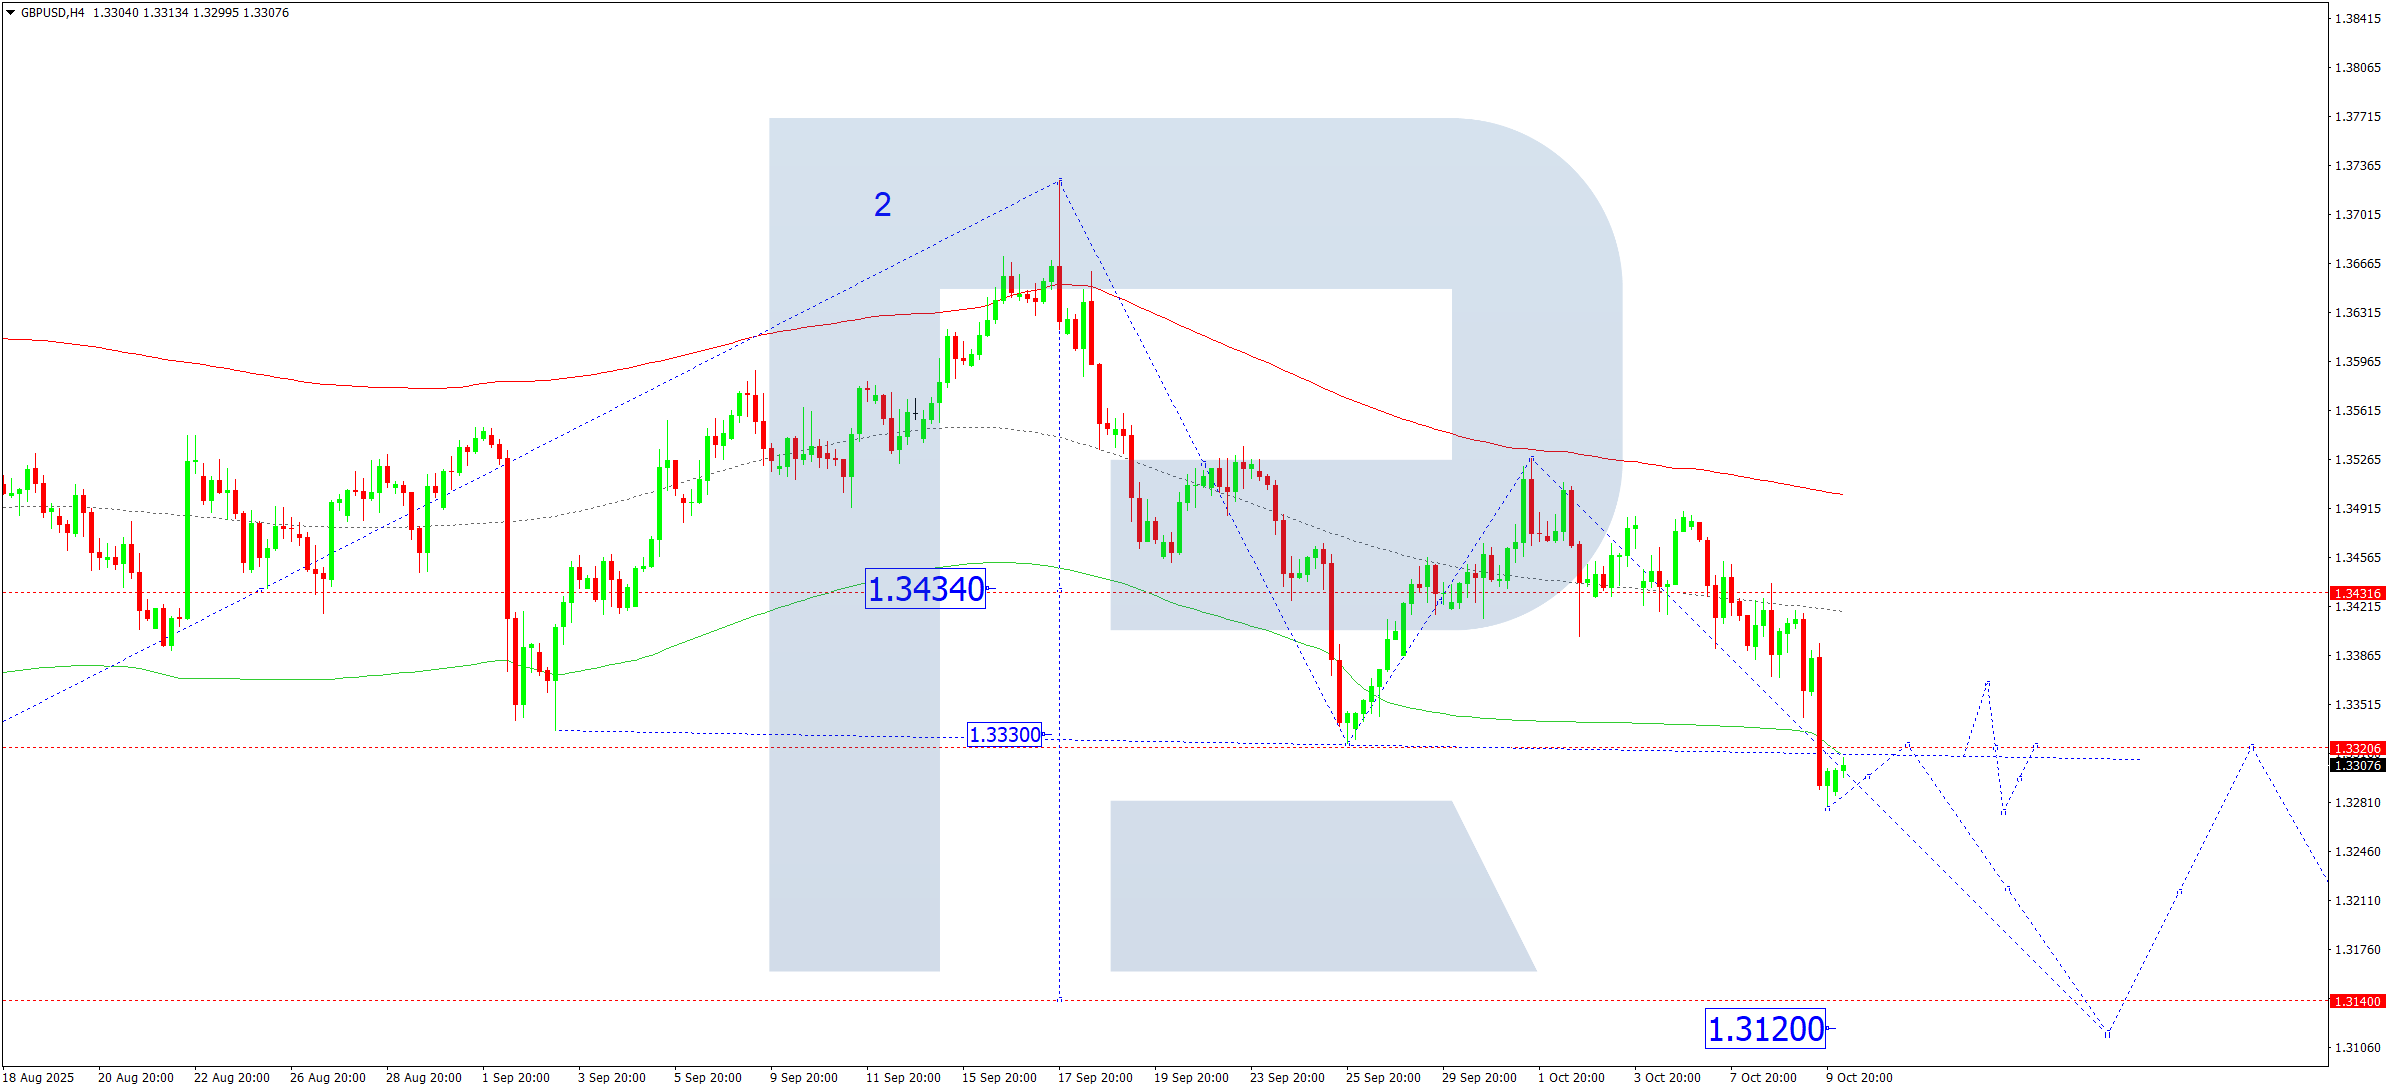
GBPUSD has established a consolidation zone near 1.3434 and recently broke lower, extending the decline to 1.3278. A pullback toward 1.3320 is anticipated on 10 October 2025, followed by a potential new bearish wave targeting 1.3140 and possibly extending to 1.3120.
This scenario aligns with the Elliott Wave pattern and a downward wave matrix. The pivot level is seen at 1.3330, marking the central line of the Price Envelope. A downward breakout would pave the way to 1.3140 and 1.3120.
Outlook: Indicators point to a continued bearish trend towards 1.3140 and 1.3120.
AUDUSD Forecast
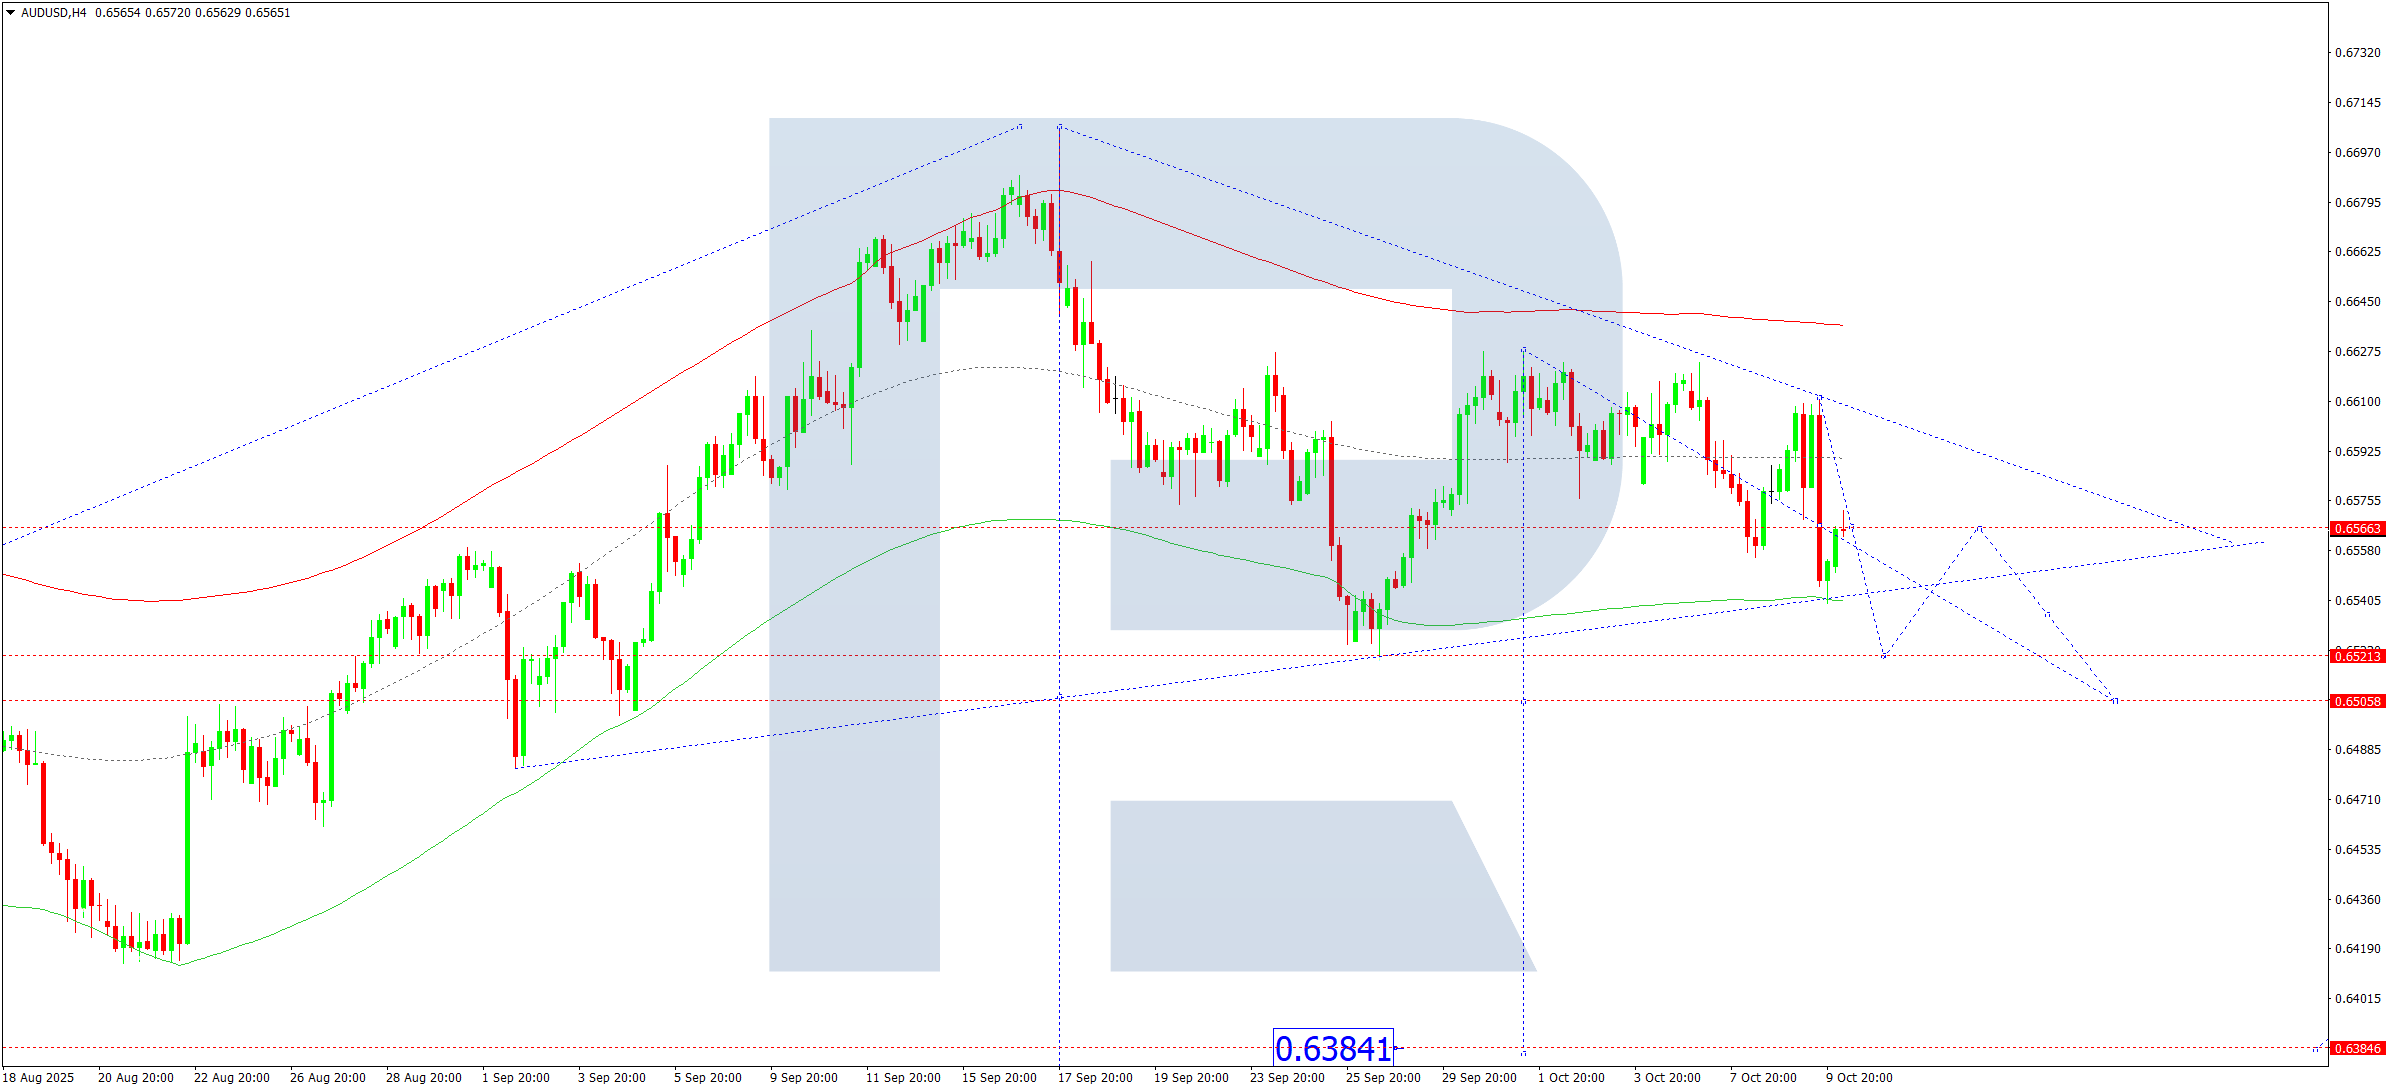
AUDUSD completed a downward wave to 0.6539 and corrected toward 0.6565. The price is expected to decline to 0.6521 on 10 October 2025, with potential to extend to 0.6505. A decisive break below could lead to further downside towards 0.6384.
This setup is validated by the Elliott Wave structure and a bearish wave matrix. The pivot level is defined at 0.6565. Price action is targeting the lower boundary of the Price Envelope at 0.6505.
Outlook: Technical indicators signal a likely continuation of the downward wave towards 0.6505 and beyond.
USDCAD Forecast
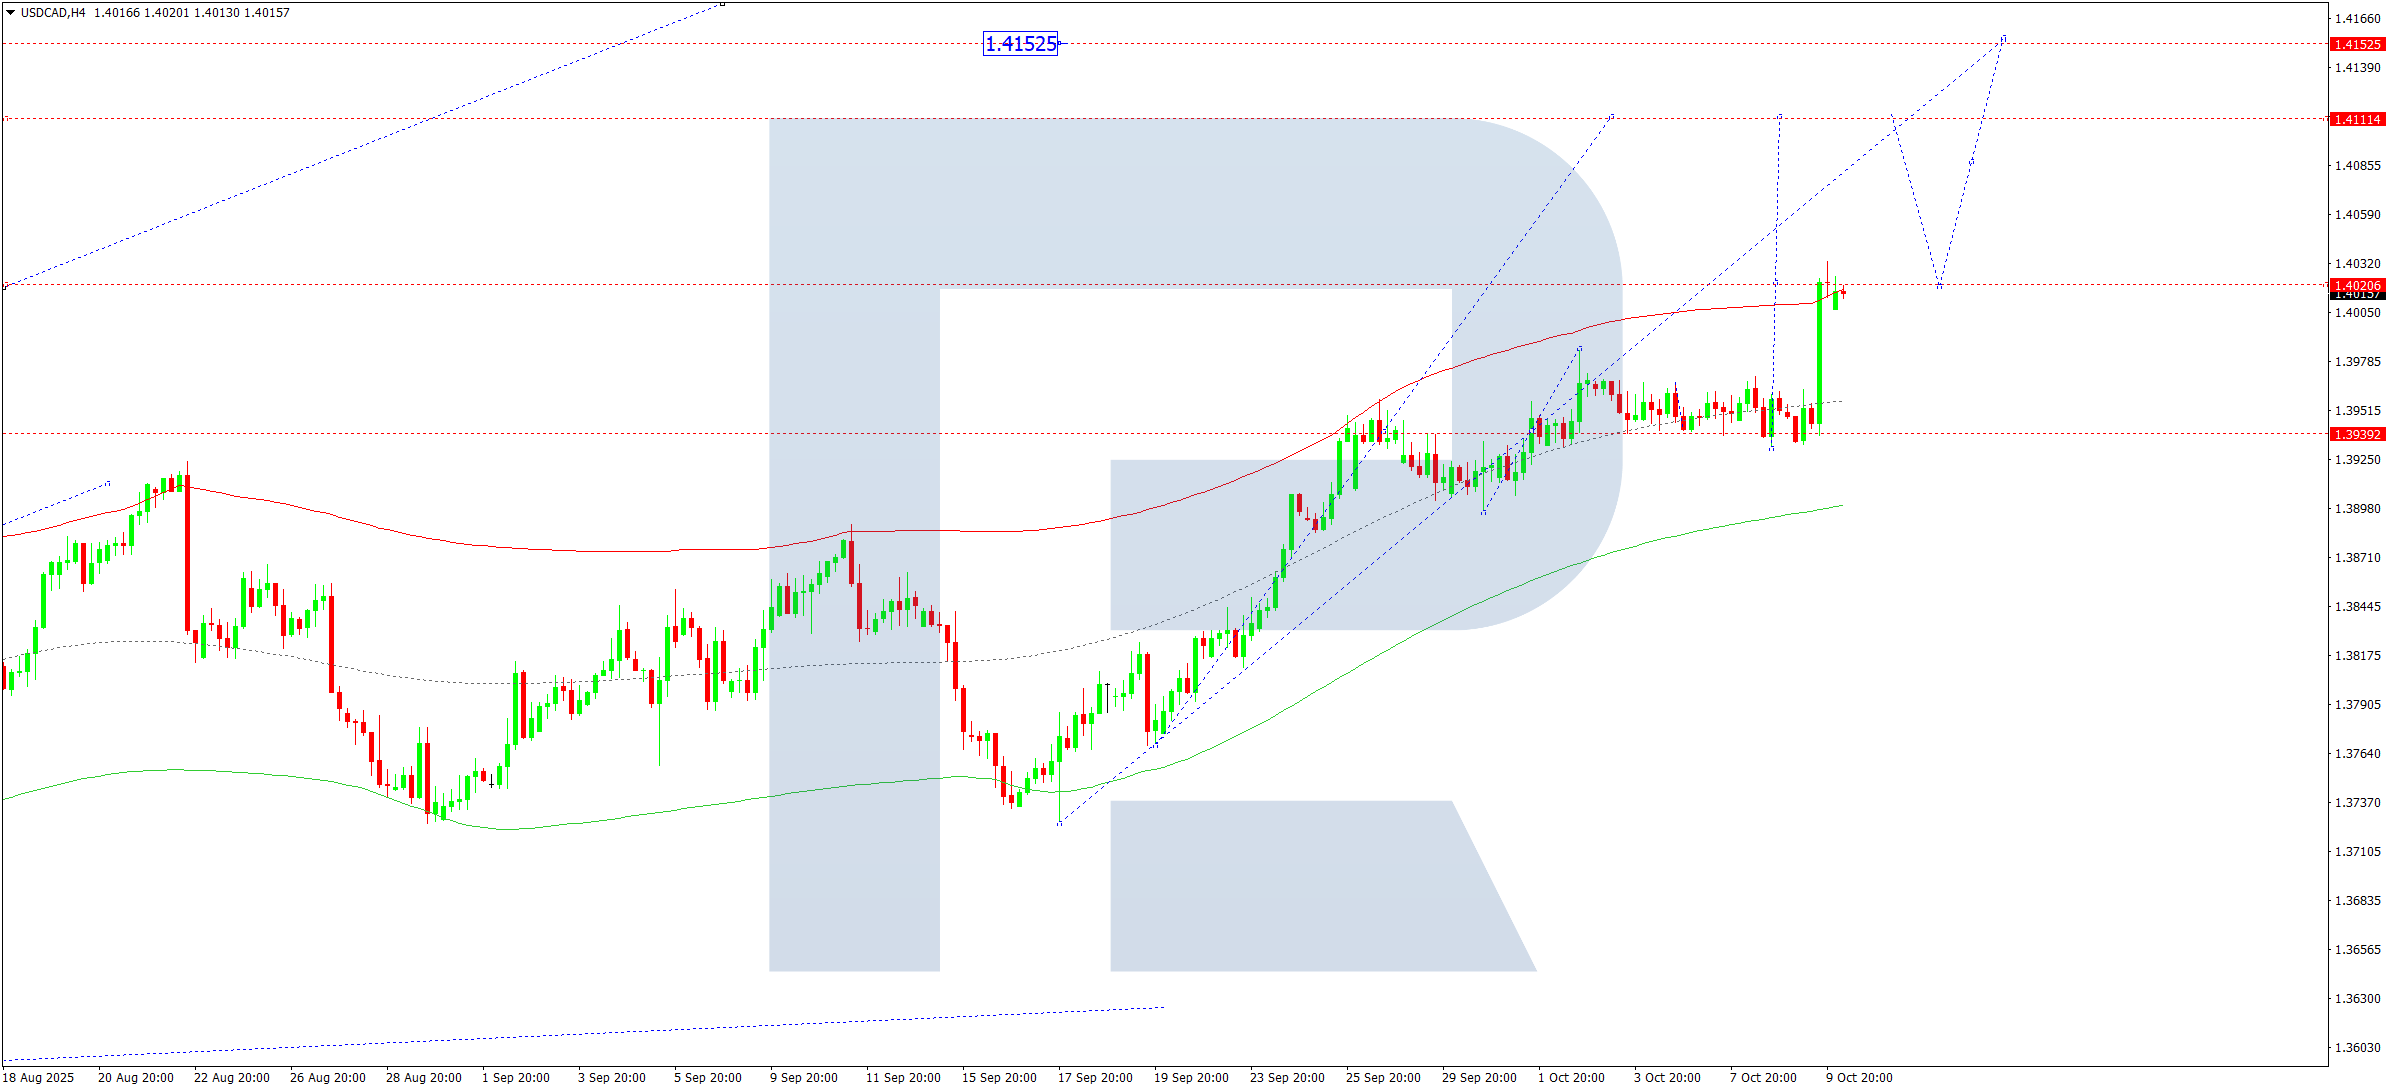
On the H4 chart, USDCAD has completed an upward move to 1.4033 and is now consolidating below this level. A pullback toward 1.3986 is expected, followed by a potential rally toward 1.4111. If this level is breached, the price could extend gains to 1.4152.
This forecast is consistent with the Elliott Wave structure and upward wave matrix. The pivot point is at 1.3939. Price is tracking toward the upper Price Envelope boundary at 1.4111, with a likely pullback to the median line at 1.4020 before resuming its ascent to 1.4152.
Outlook: Indicators suggest bullish continuation toward 1.4111 and 1.4152.
XAUUSD Forecast (Gold)
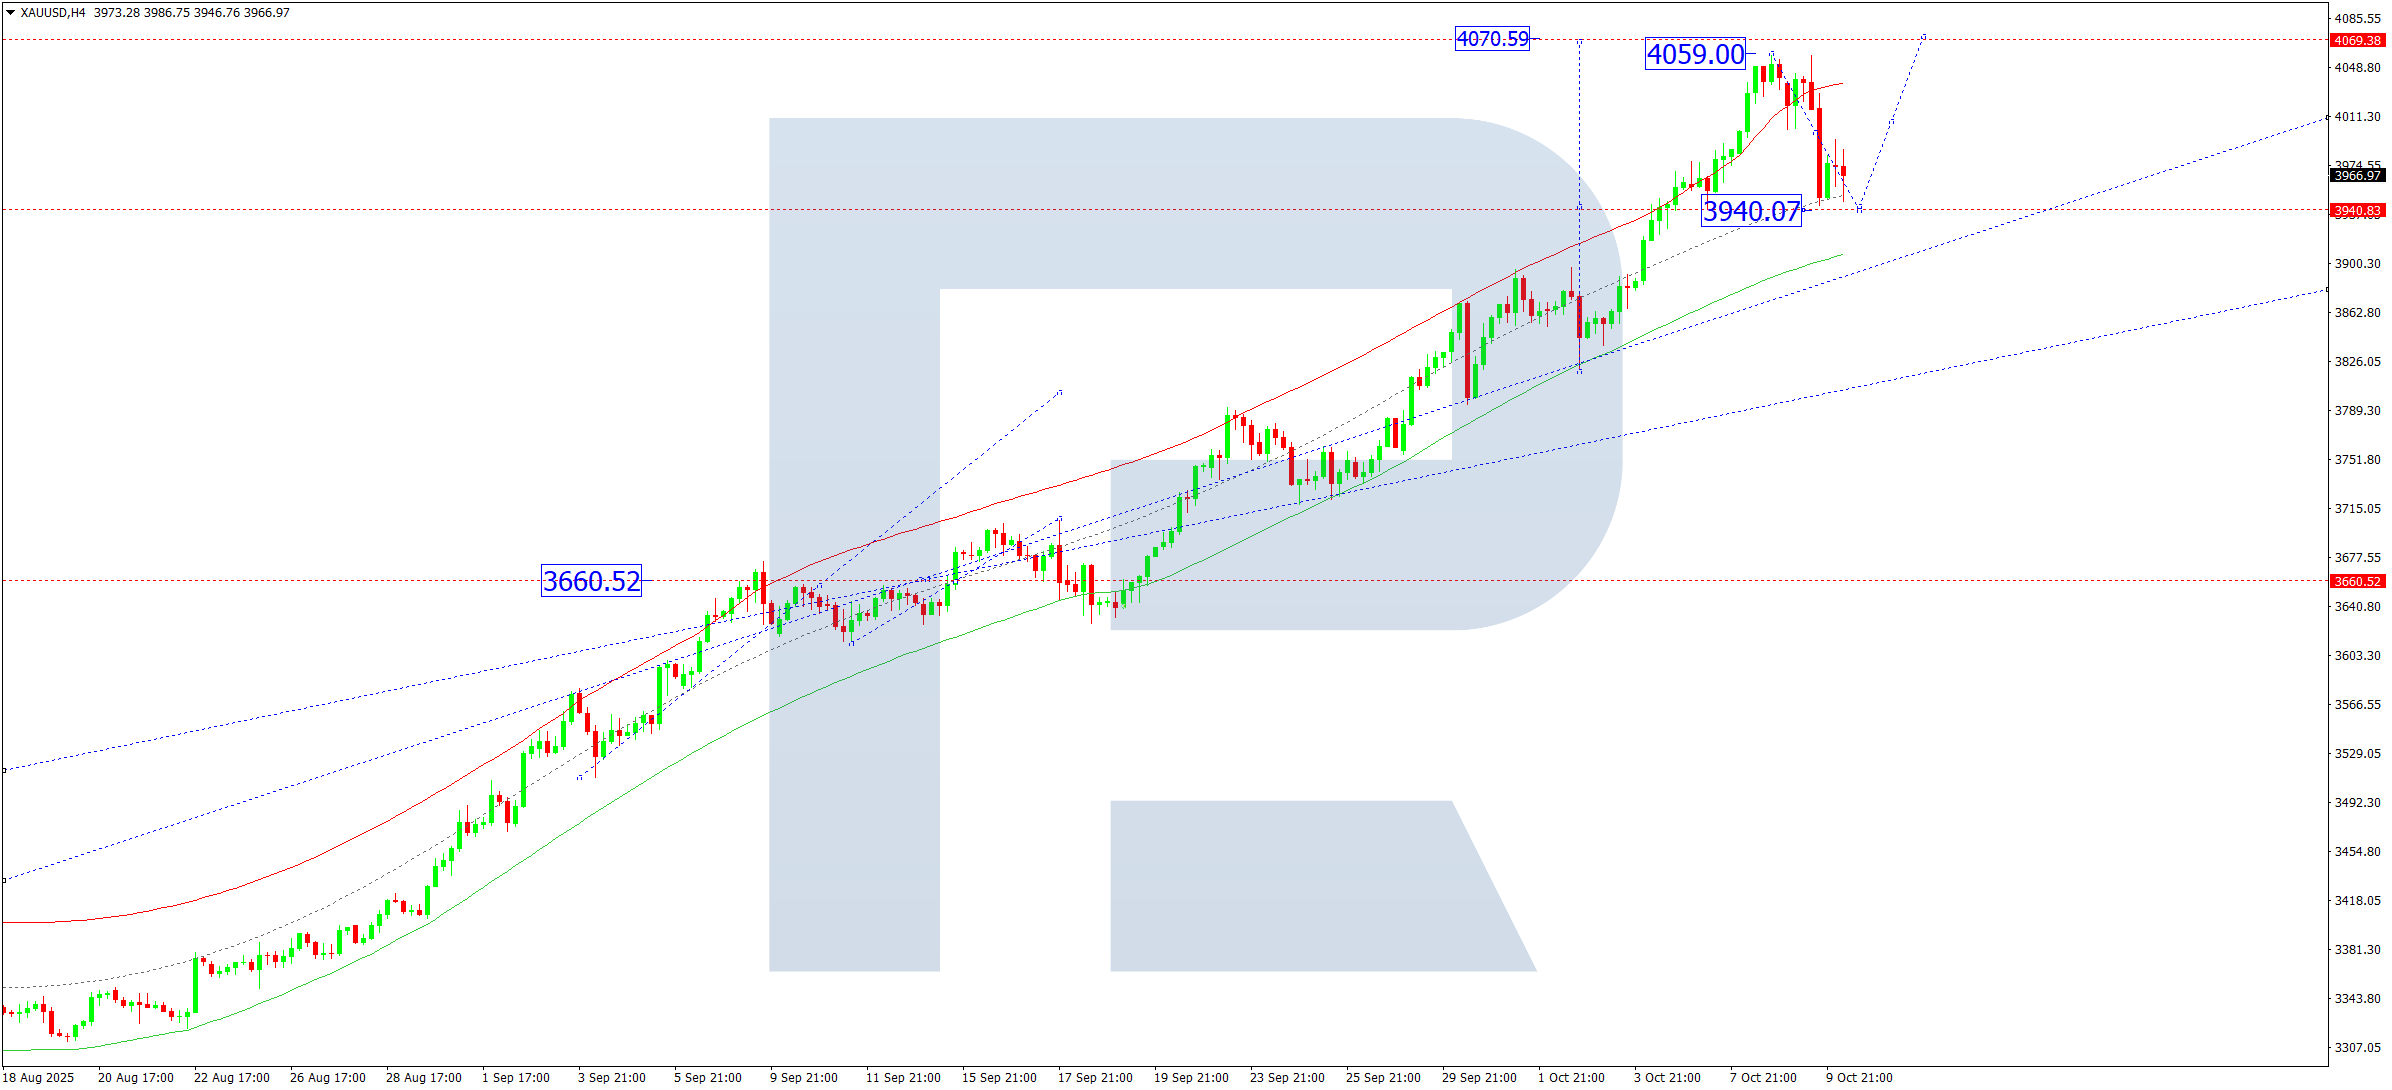
Gold has recently corrected to 3,945. On 10 October 2025, a rise to 4,000 is expected, followed by another pullback to 3,940. If this correction ends, a new upward leg may begin, targeting 4,000 again, with a potential breakout to 4,070. A downward breakout, however, could lead to a correction towards 3,890.
This scenario is supported by the Elliott Wave formation and a bullish wave matrix. The key pivot level is at 3,660. Gold is forming an upward move within the Price Envelope, aiming for the 4,070 region.
Outlook: Technical signals indicate upward momentum, with a primary target at 4,070.
Brent Crude Forecast
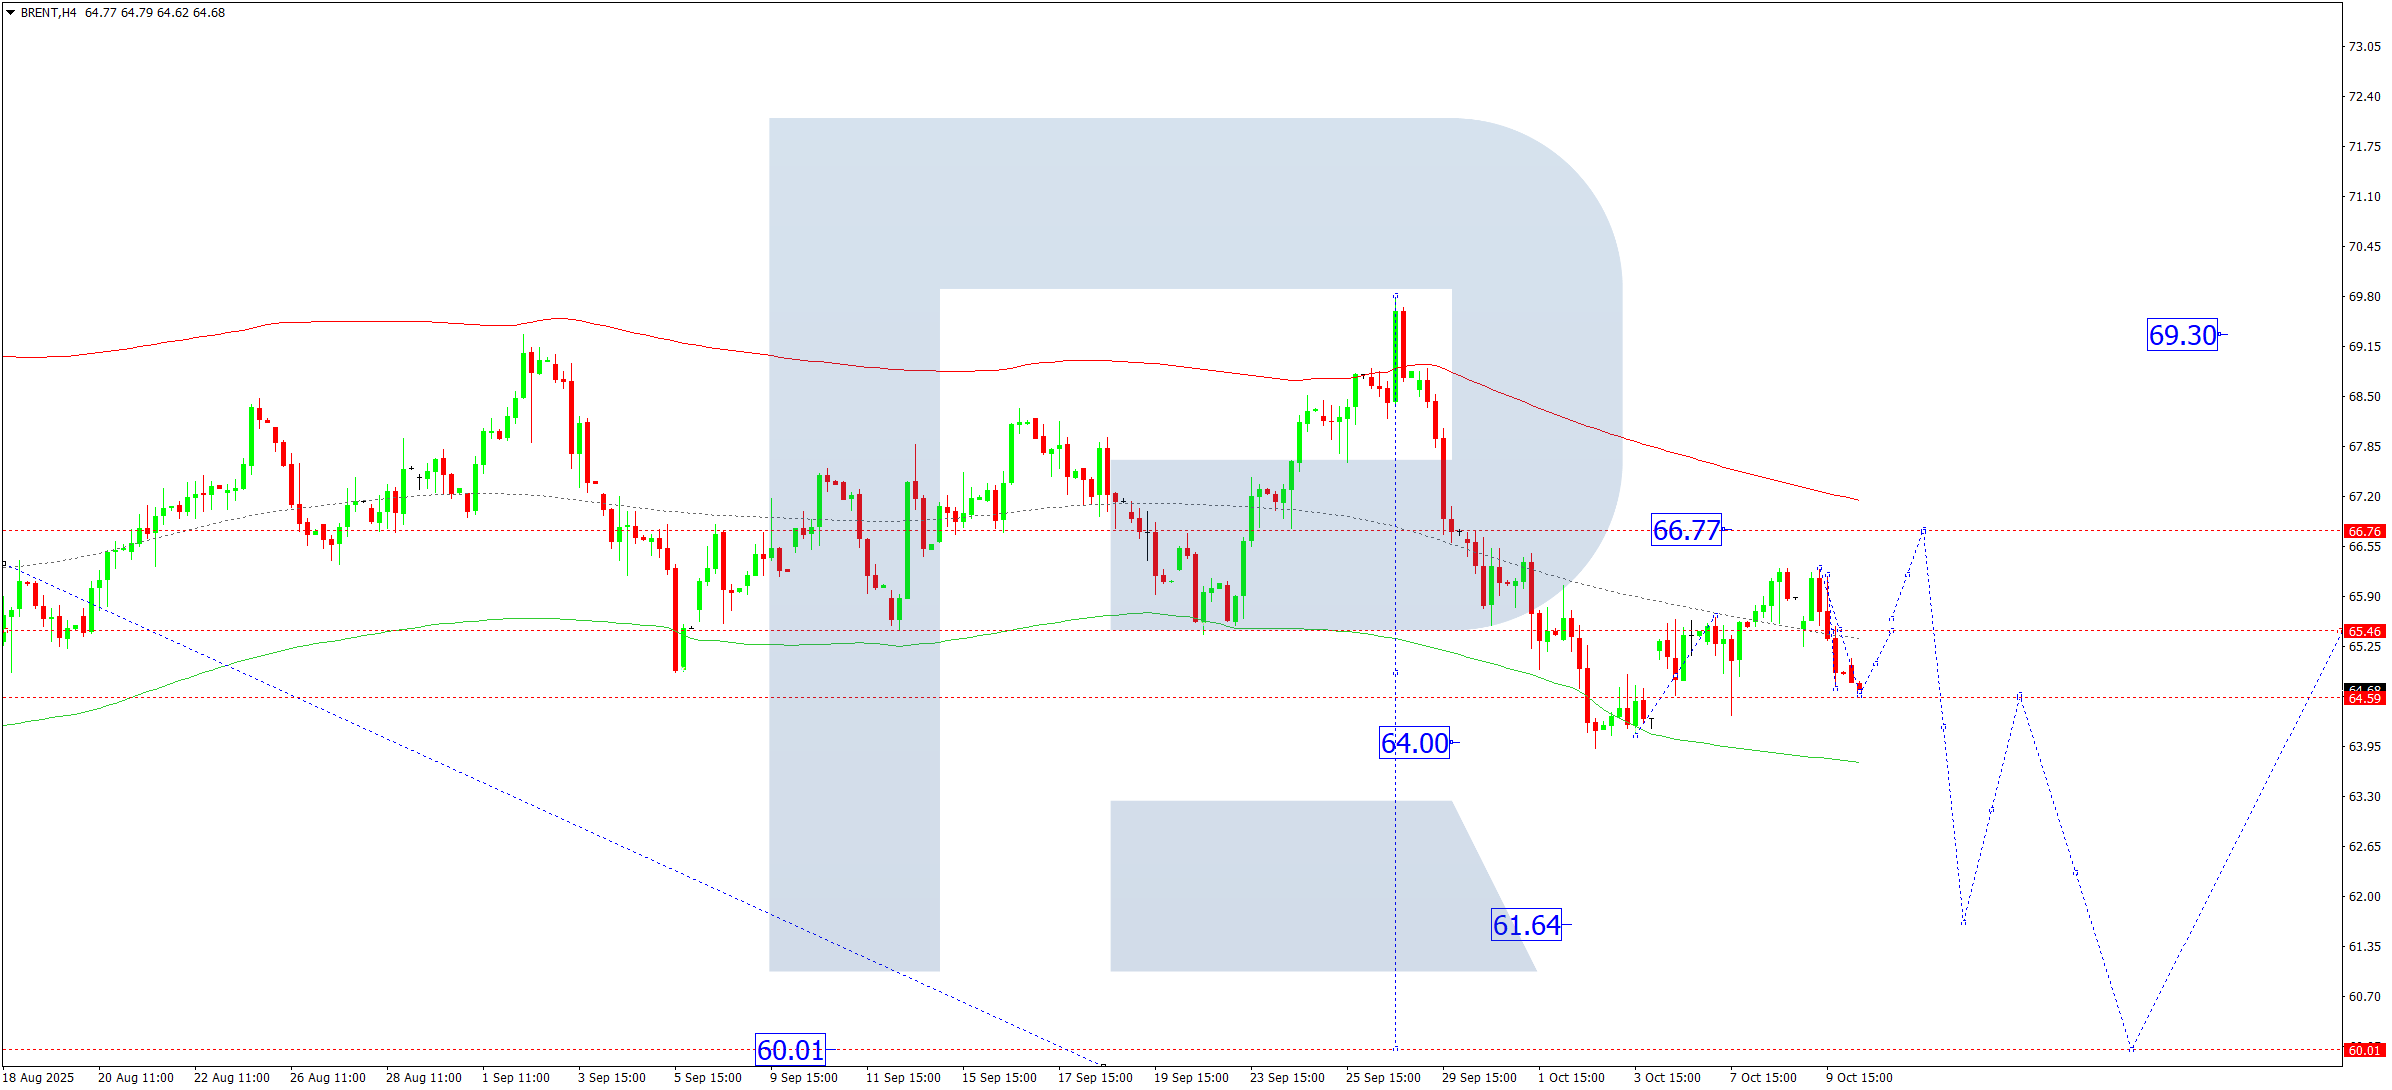
Brent crude has completed a downward wave to 64.64. A short-term correction toward 65.45 is expected. Price is currently consolidating around this level. A breakout to the upside could trigger a move to 66.77, while a breakdown would resume the bearish trend toward 61.64, with a possible extension to 60.00.
This setup is confirmed by the Elliott Wave structure and a bearish wave matrix. The pivot level is at 65.45, marking the central Price Envelope line. A rebound toward 66.77 is possible before resuming the decline.
Outlook: Technical indicators suggest a potential rebound toward 66.77 before further downside.
Disclaimer: Past performance is not indicative of future results. Trading involves risk and may not be suitable for all investors.
Leave a Reply