
Daily Technical Analysis and Forecast – 14 October 2025
EURUSD Forecast
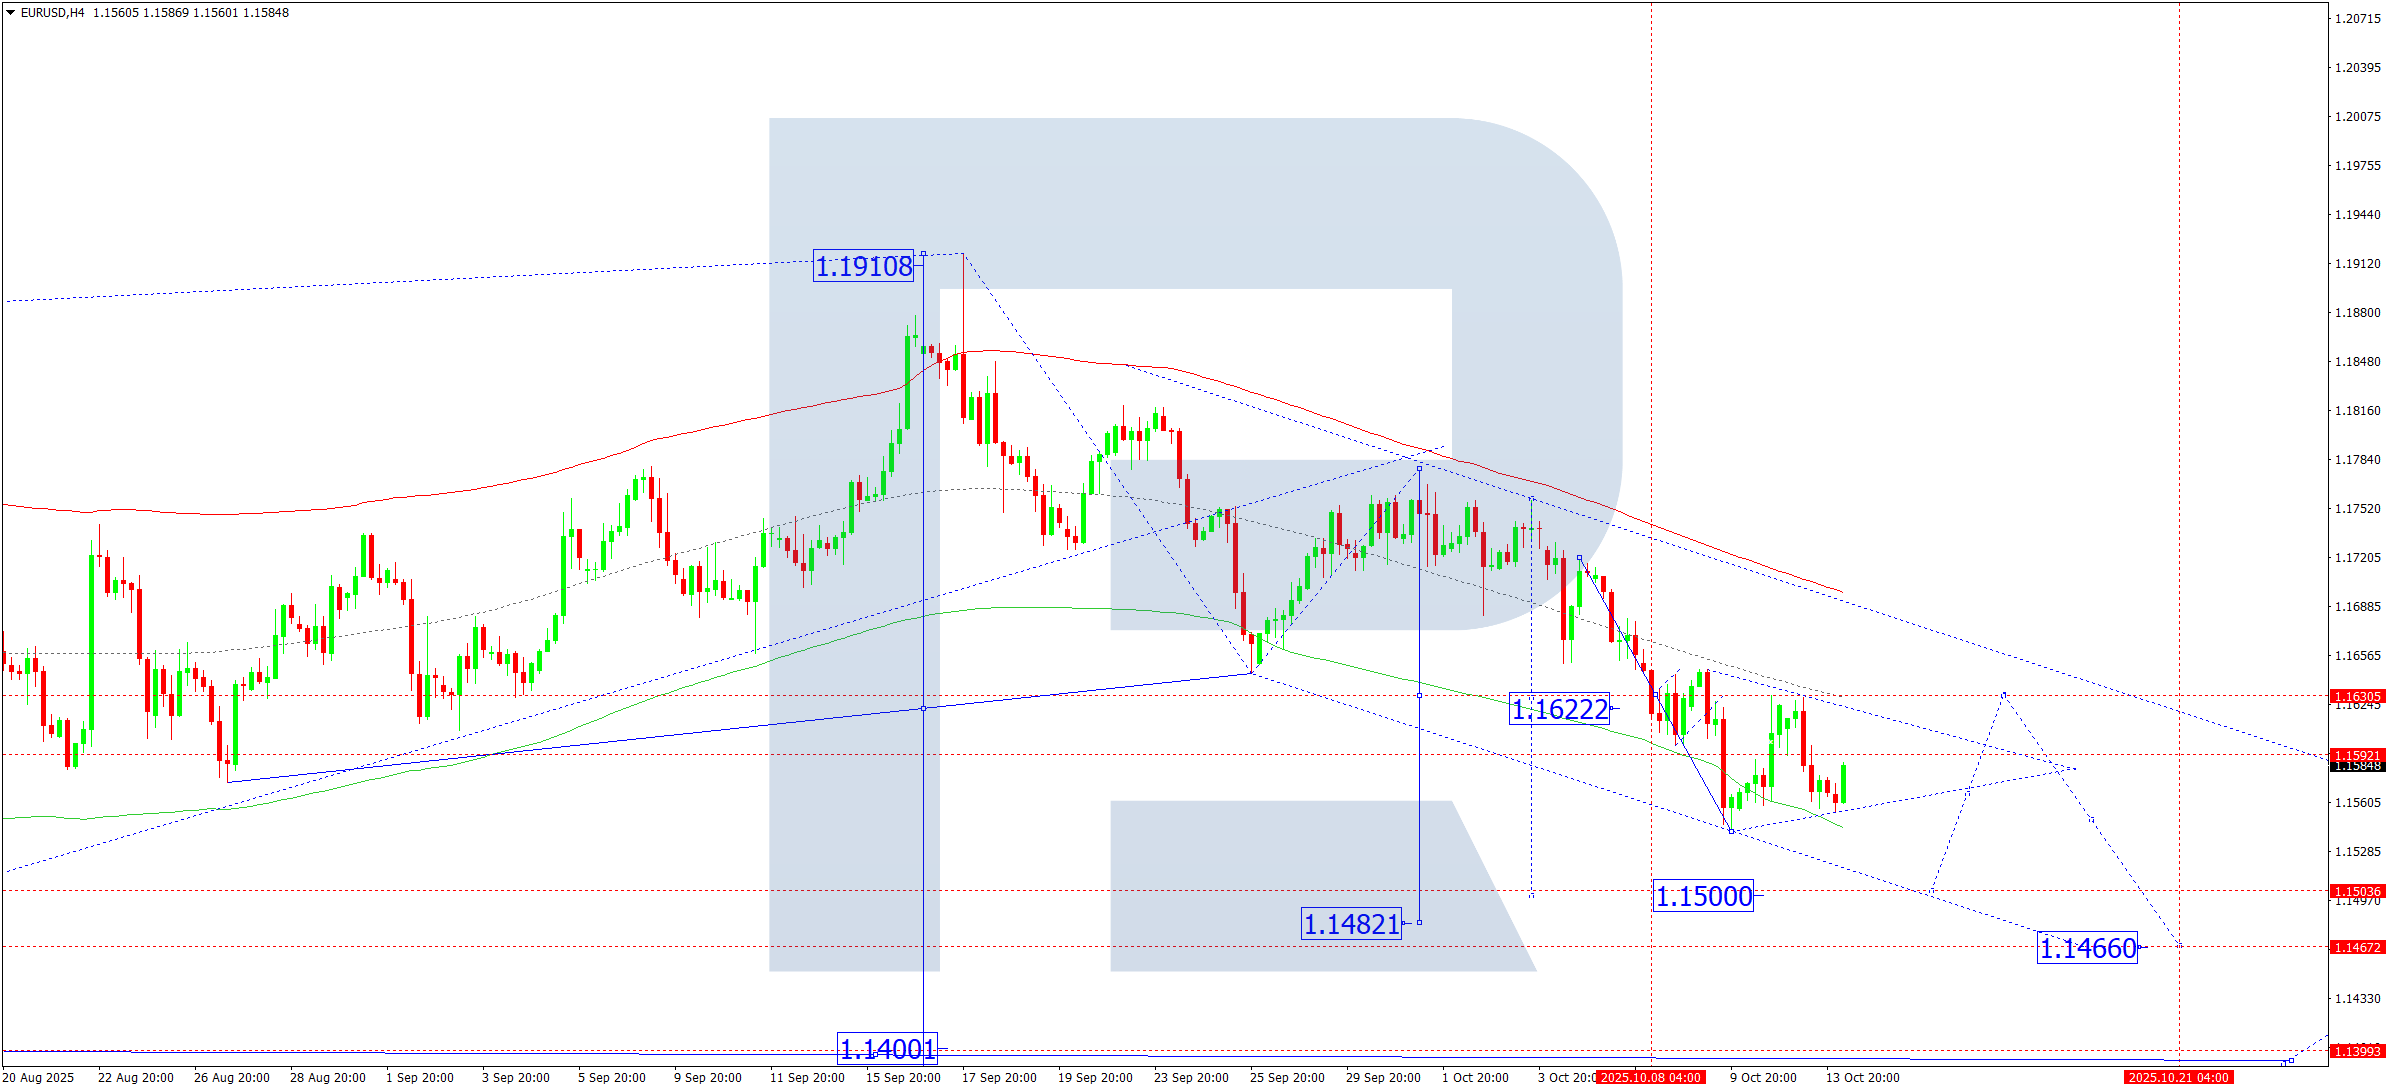
On the H4 chart, EURUSD has completed a decline to 1.1555, followed by a correction up to 1.1592, which is currently being tested from below. A consolidation range has formed around this level.
For 14 October 2025, a downside breakout is expected, continuing the bearish trend towards 1.1500, with potential extensions to 1.1480 and 1.1466.
Technically, this outlook is supported by the Elliott Wave structure and a bearish wave matrix, with a pivot level at 1.1622, marking the key resistance. The price is projected to approach the lower boundary of the Price Envelope near 1.1500, possibly extending to 1.1466.
Technical indicators support a bearish move targeting at least 1.1500.
USDJPY Forecast
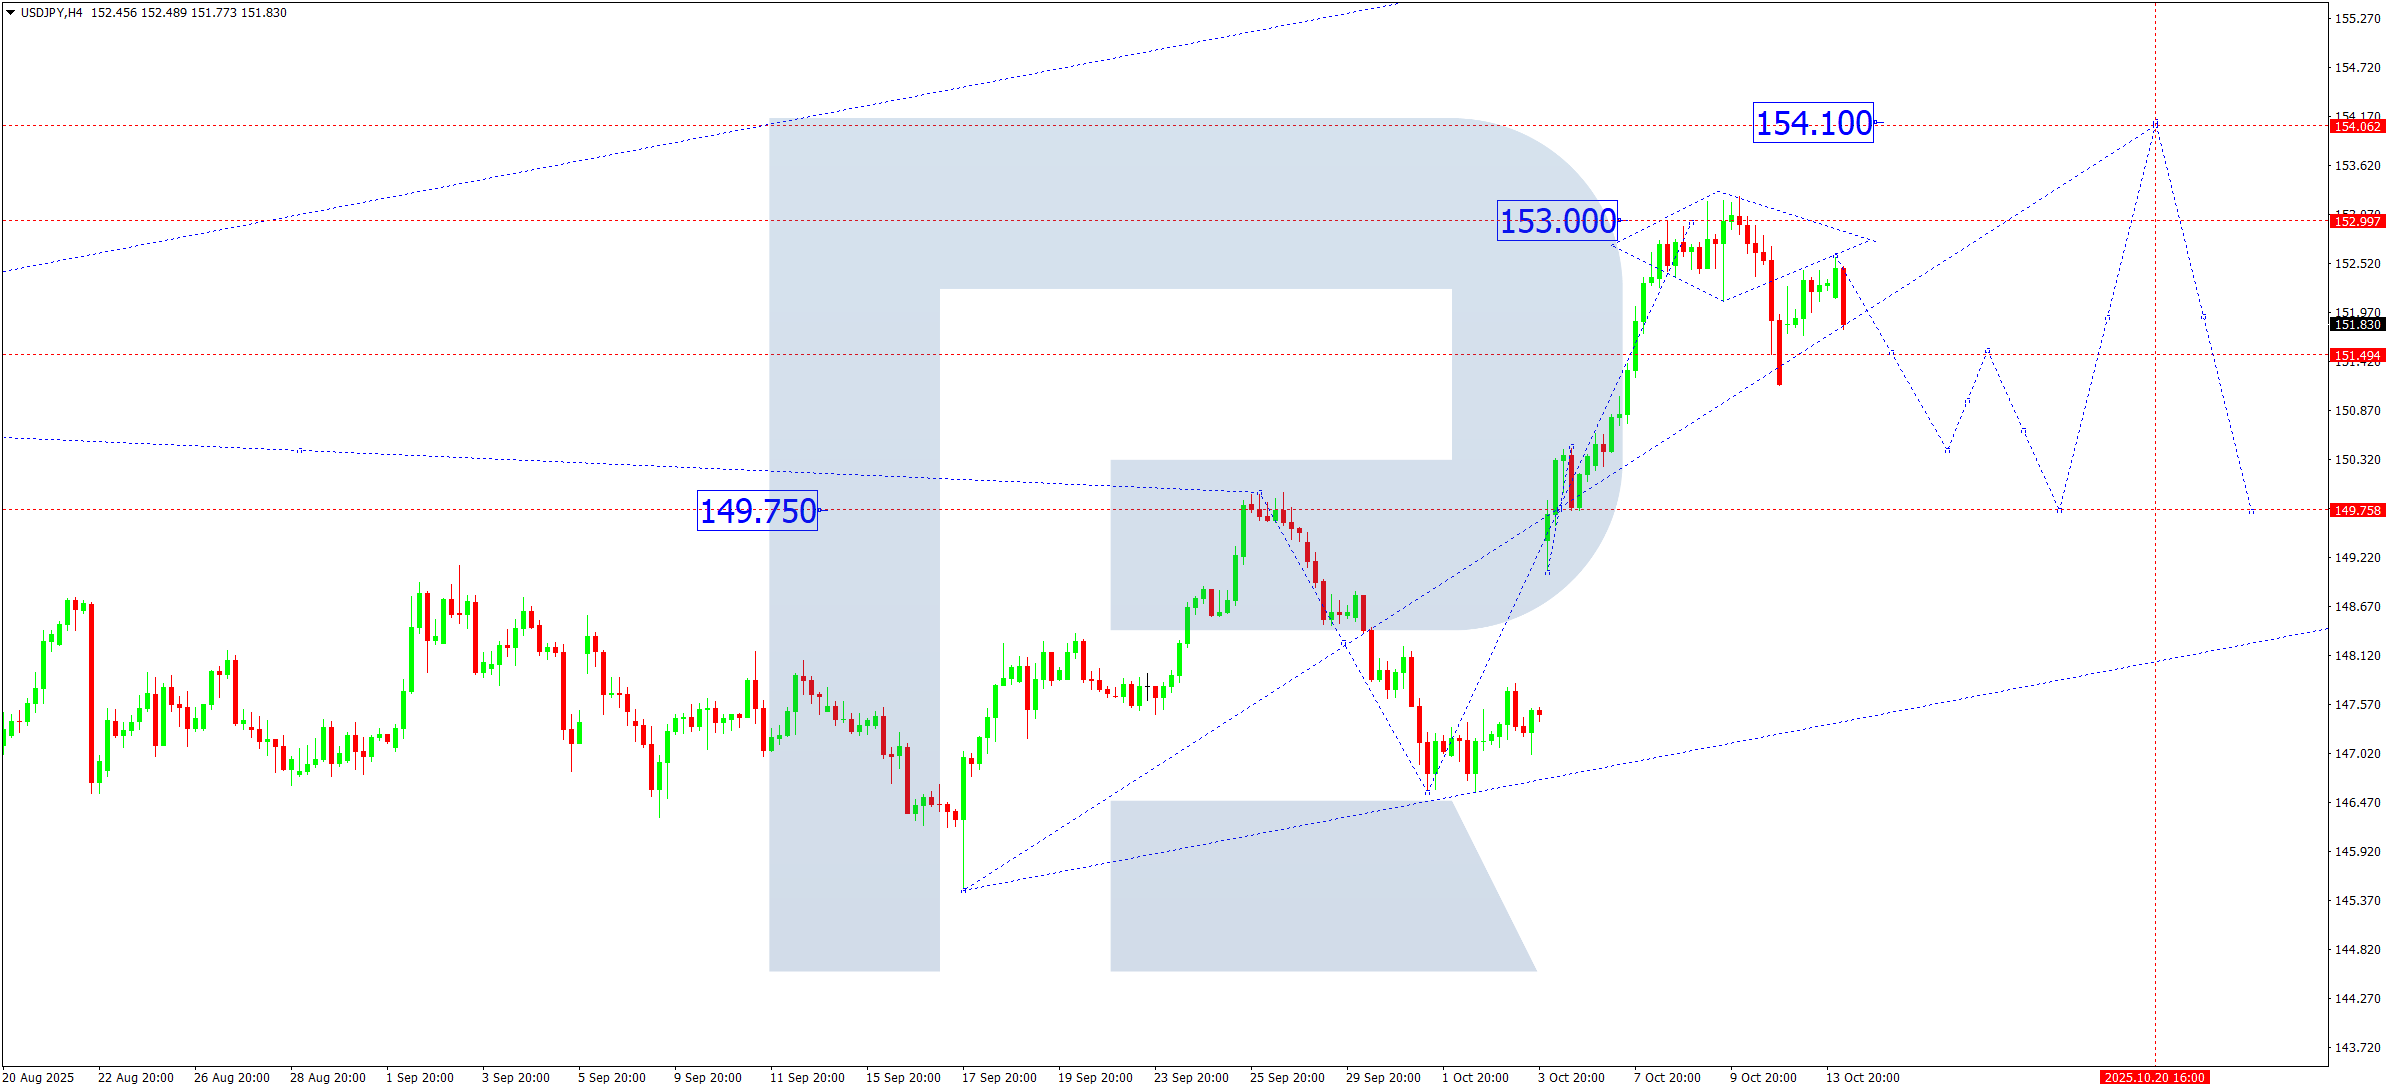
On the H4 timeframe, USDJPY has completed an upward swing to 152.60. A retracement is expected today, targeting 150.45, possibly extending to 149.76—a key support area and a previous resistance now being tested.
This retracement is viewed as part of a corrective move following the recent rise from 153.27. Once completed, a new bullish wave towards 154.10 is likely.
The Elliott Wave structure and a bullish wave matrix support this scenario, with 149.76 acting as the pivotal level. A correction towards the midline of the Price Envelope at 151.50, and possibly to the lower edge at 150.45, is expected.
Technical indicators point to further correction towards 151.40 and 150.45 before a potential upward continuation.
GBPUSD Forecast
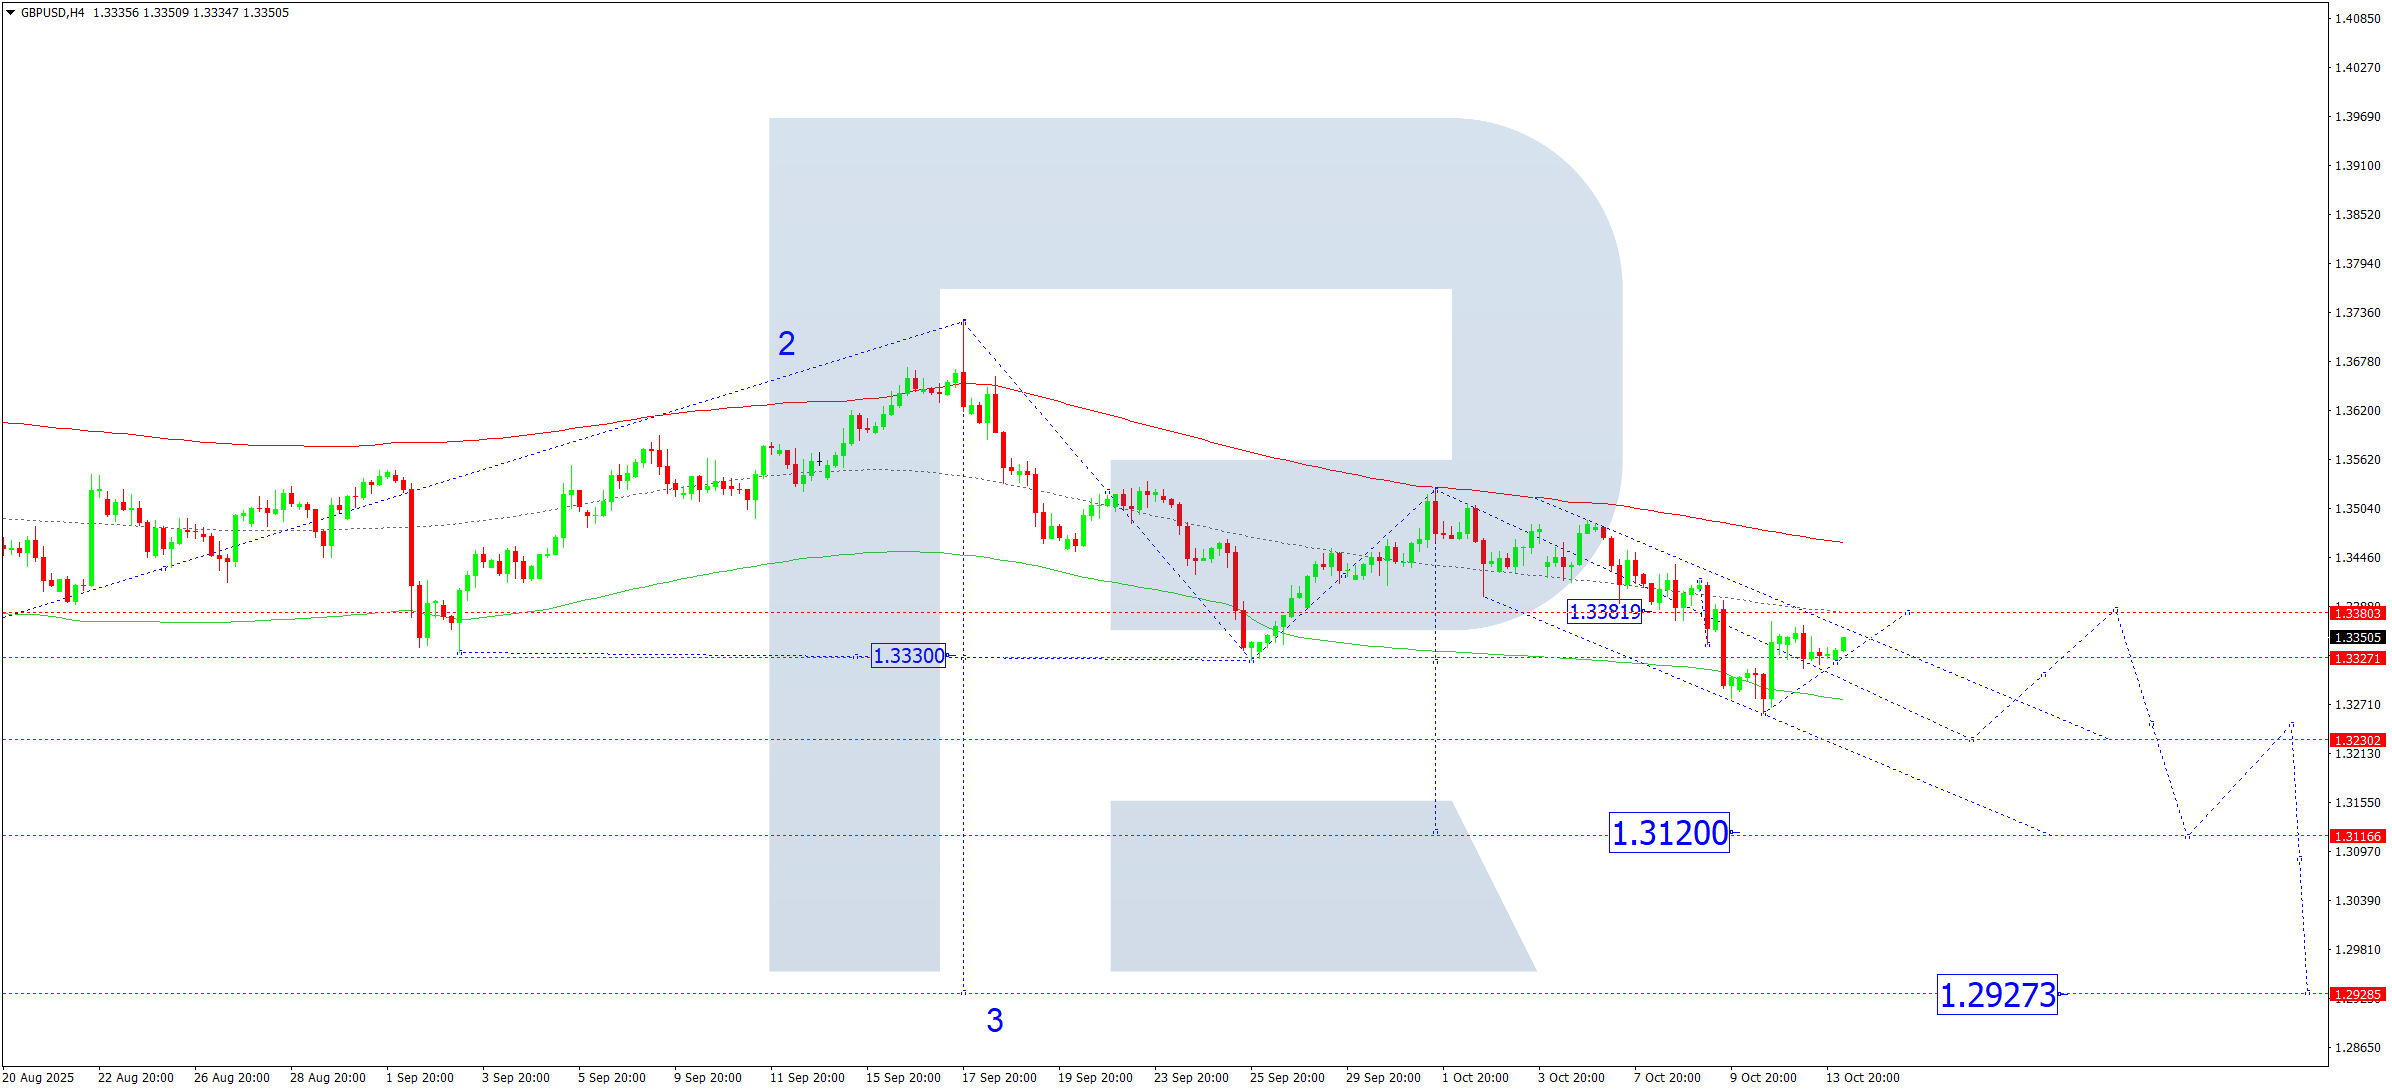
GBPUSD has formed a consolidation zone around 1.3330 on the H4 chart. A minor upward expansion to 1.3318 may occur today, followed by a decline targeting 1.3230, with the potential to extend further to 1.3120.
The bearish wave matrix and Elliott Wave pattern confirm this outlook, with 1.3380 acting as a critical resistance level. The pair is holding just above the Price Envelope’s lower edge at 1.3260.
A brief recovery to the midline at 1.3380 is possible, but the broader trend favors a move down to 1.3230 and possibly 1.3120.
Technical indicators suggest a short-term correction followed by renewed bearish momentum.
AUDUSD Forecast
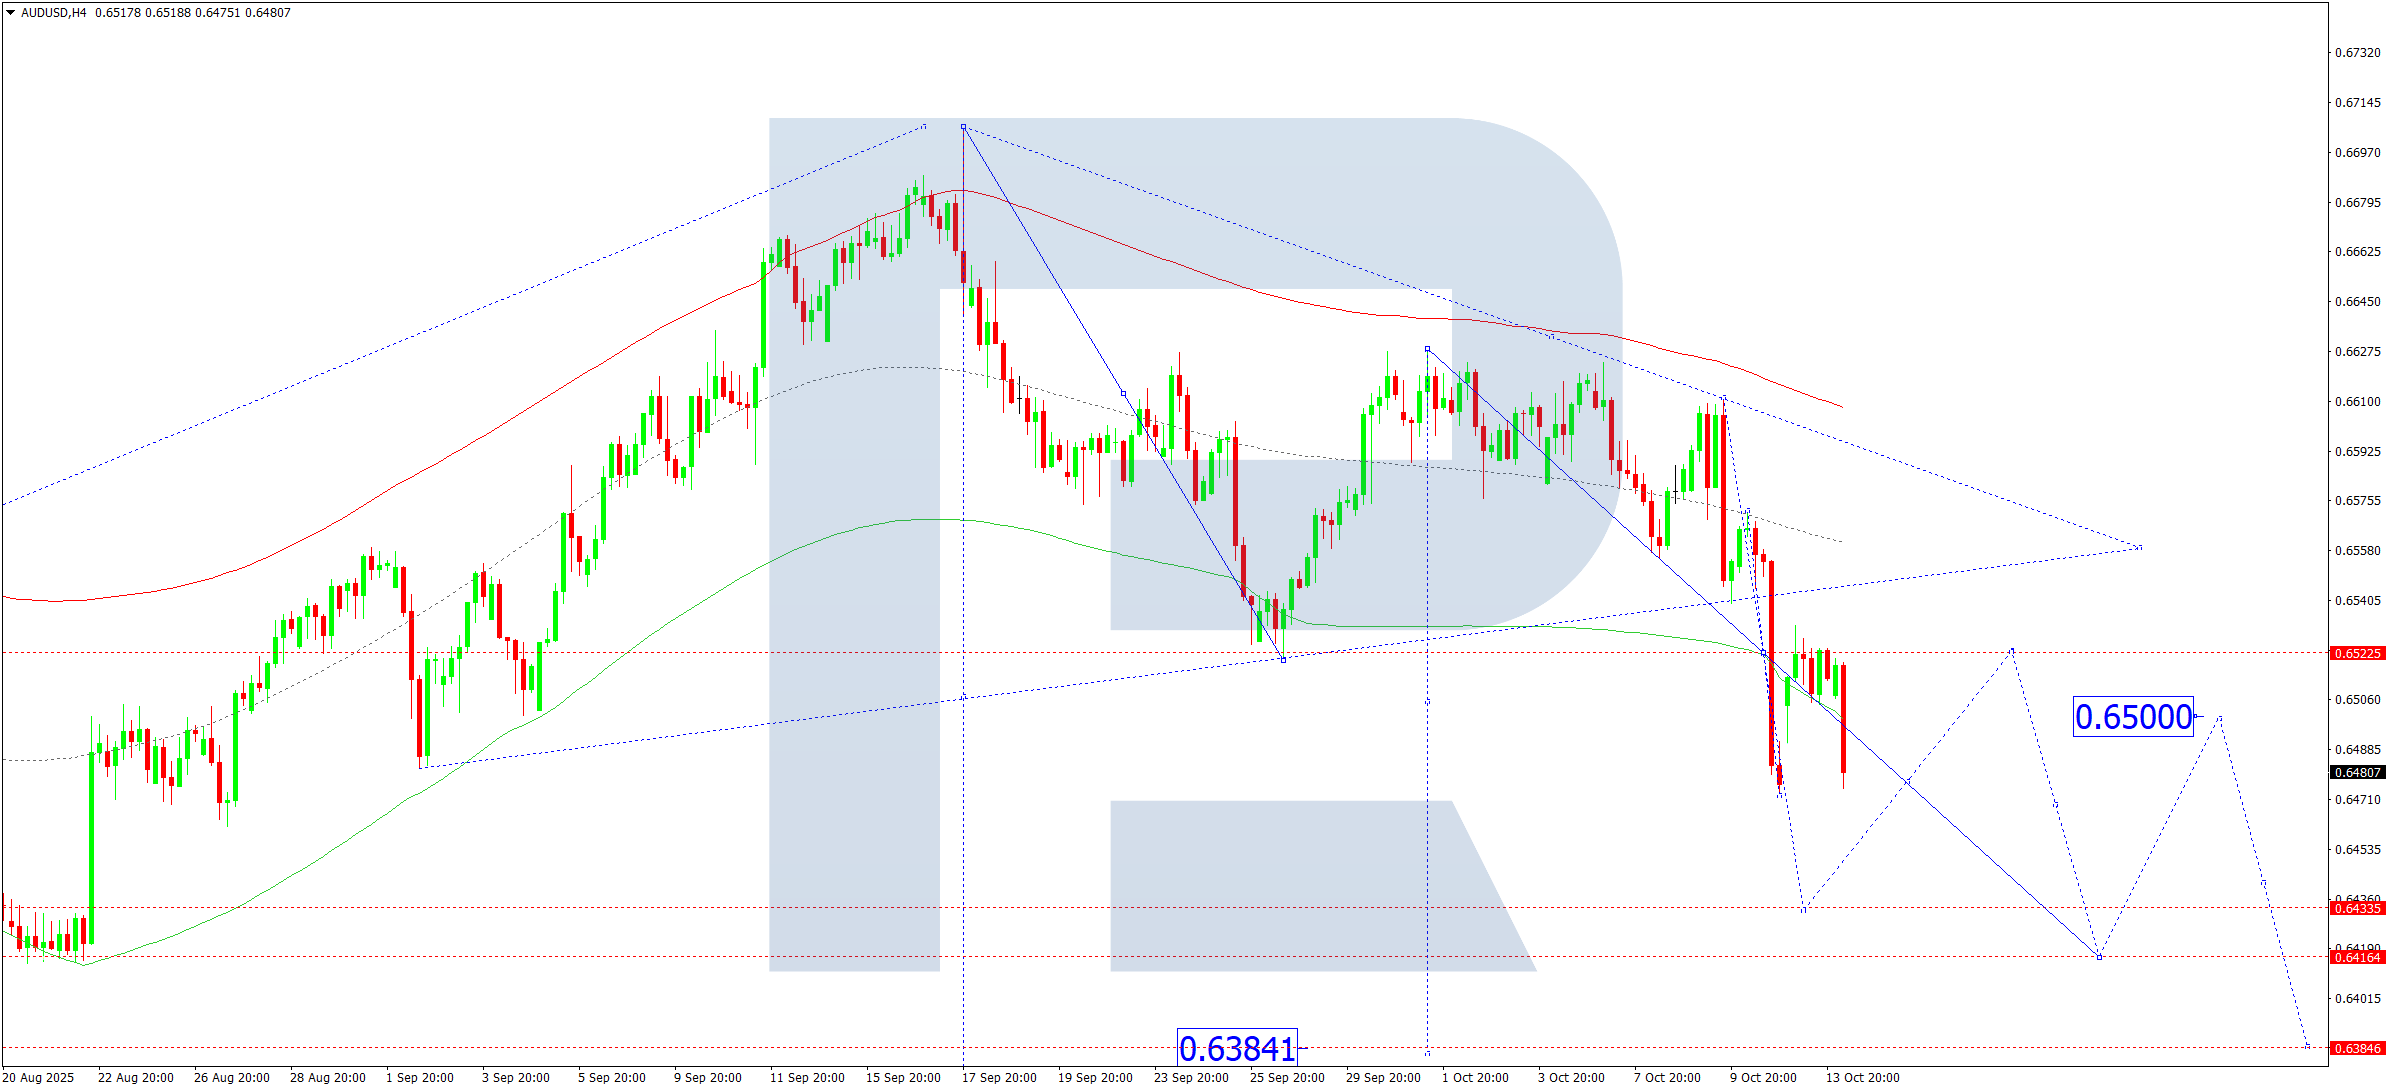
AUDUSD continues its downward trajectory, approaching 0.6433 on the H4 chart. Today, this level is likely to be reached before a minor correction to 0.6500. Afterward, the downtrend is expected to resume towards 0.6416, which is a near-term support level.
This scenario is supported by a bearish Elliott Wave pattern and wave matrix, with the pivot at 0.6525. A breakdown below 0.6416 could open the door to a deeper move down towards 0.6384.
Technical indicators support continued bearish pressure, with the next target around 0.6416.
USDCAD Forecast
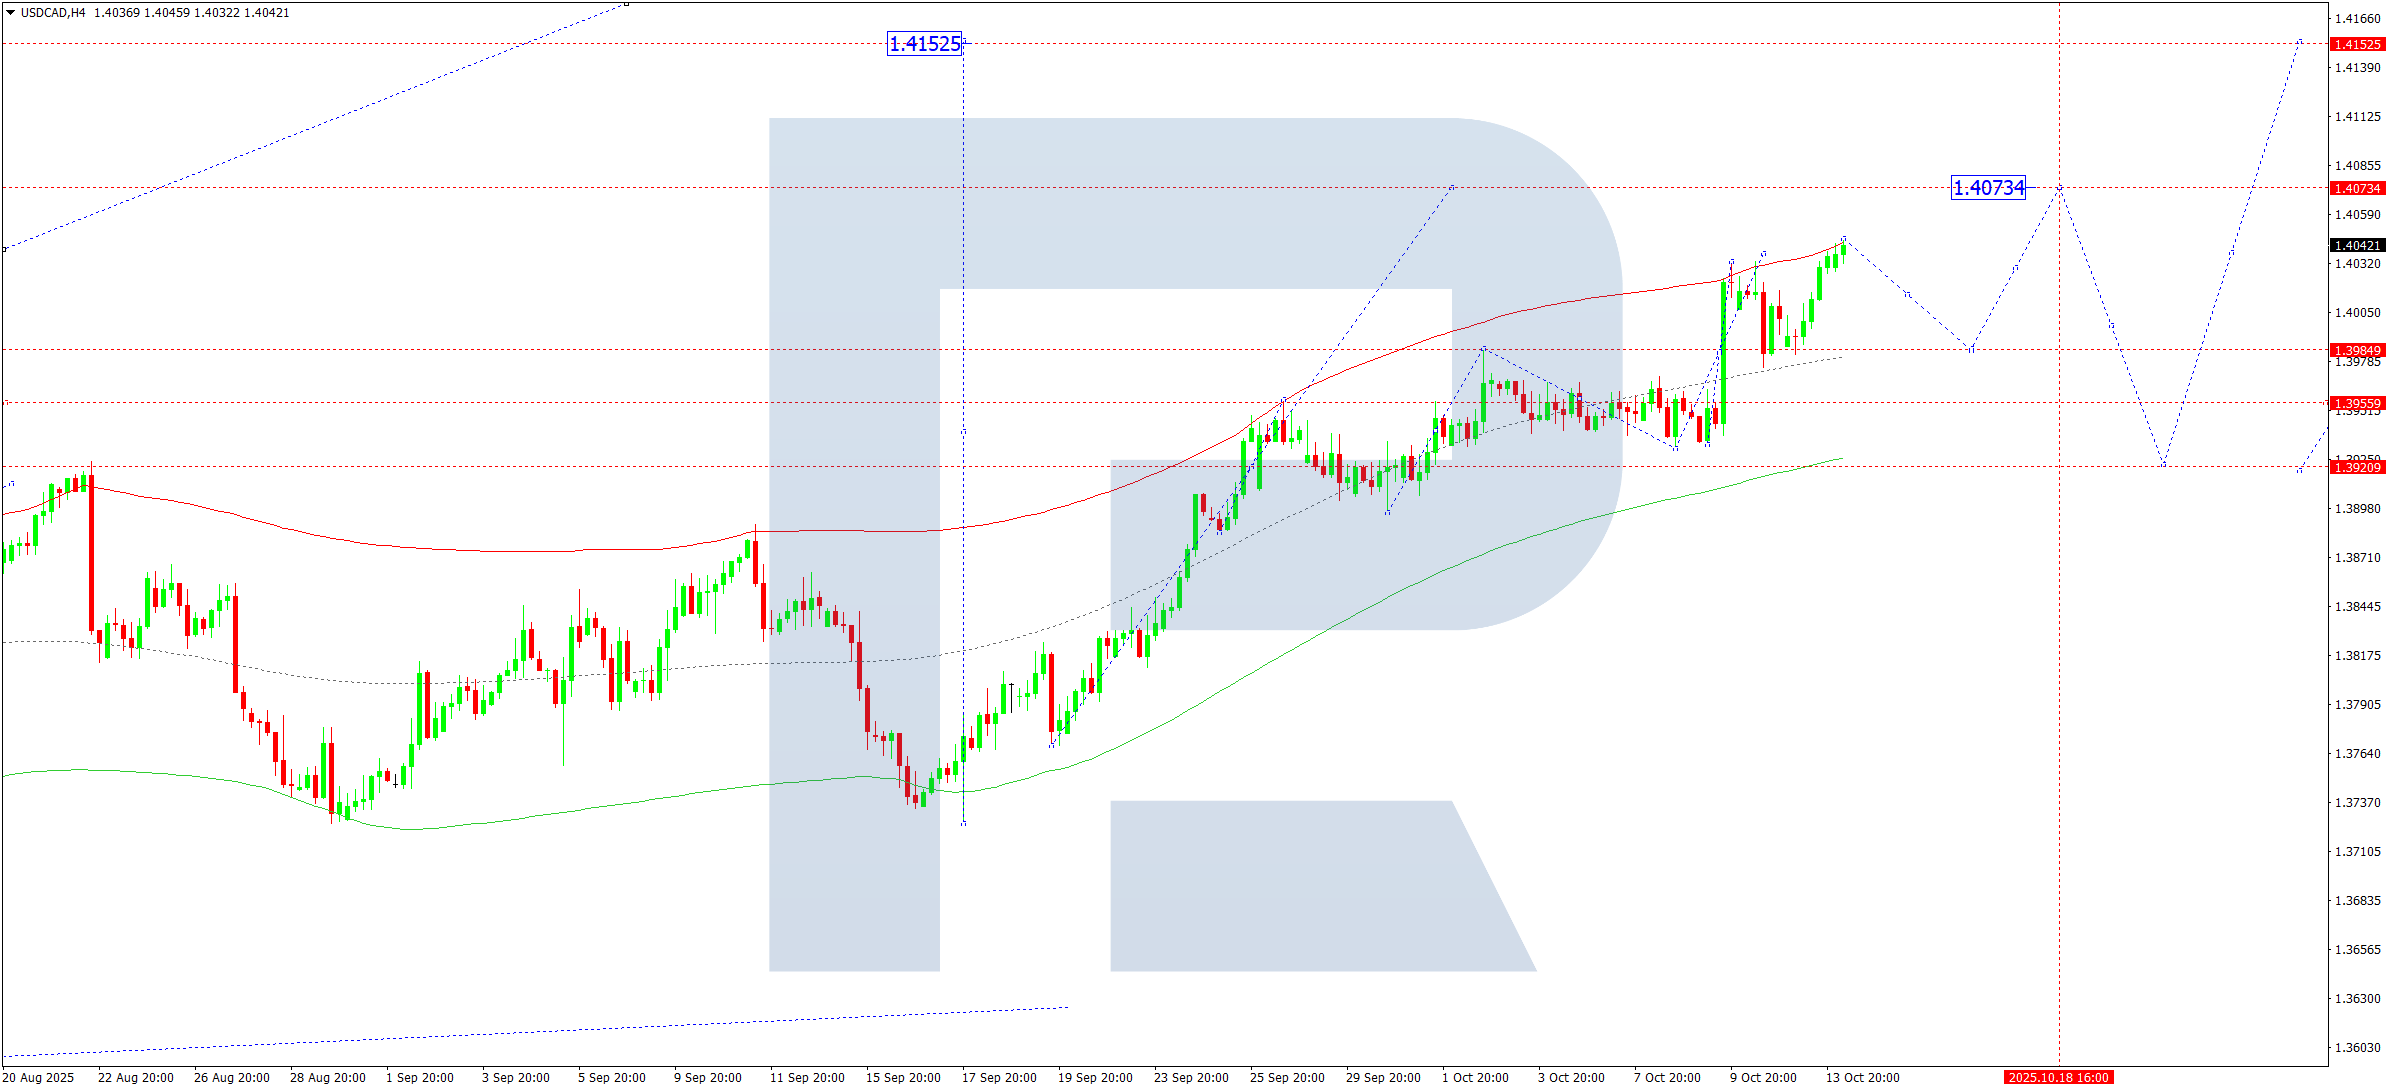
USDCAD found support at 1.3985, completing a bullish leg up to 1.4045. A pullback to 1.3985 is expected today before the pair resumes its upward movement towards 1.4073, with further potential to reach 1.4152.
The bullish wave structure is supported by the Elliott Wave matrix, with 1.3920 as the key pivot level. The pair is heading towards the upper band of the Price Envelope at 1.4073. After a short correction, a continuation to 1.4152 is probable.
Technical indicators favor continued upward momentum towards 1.4073 and 1.4152.
XAUUSD (Gold) Forecast
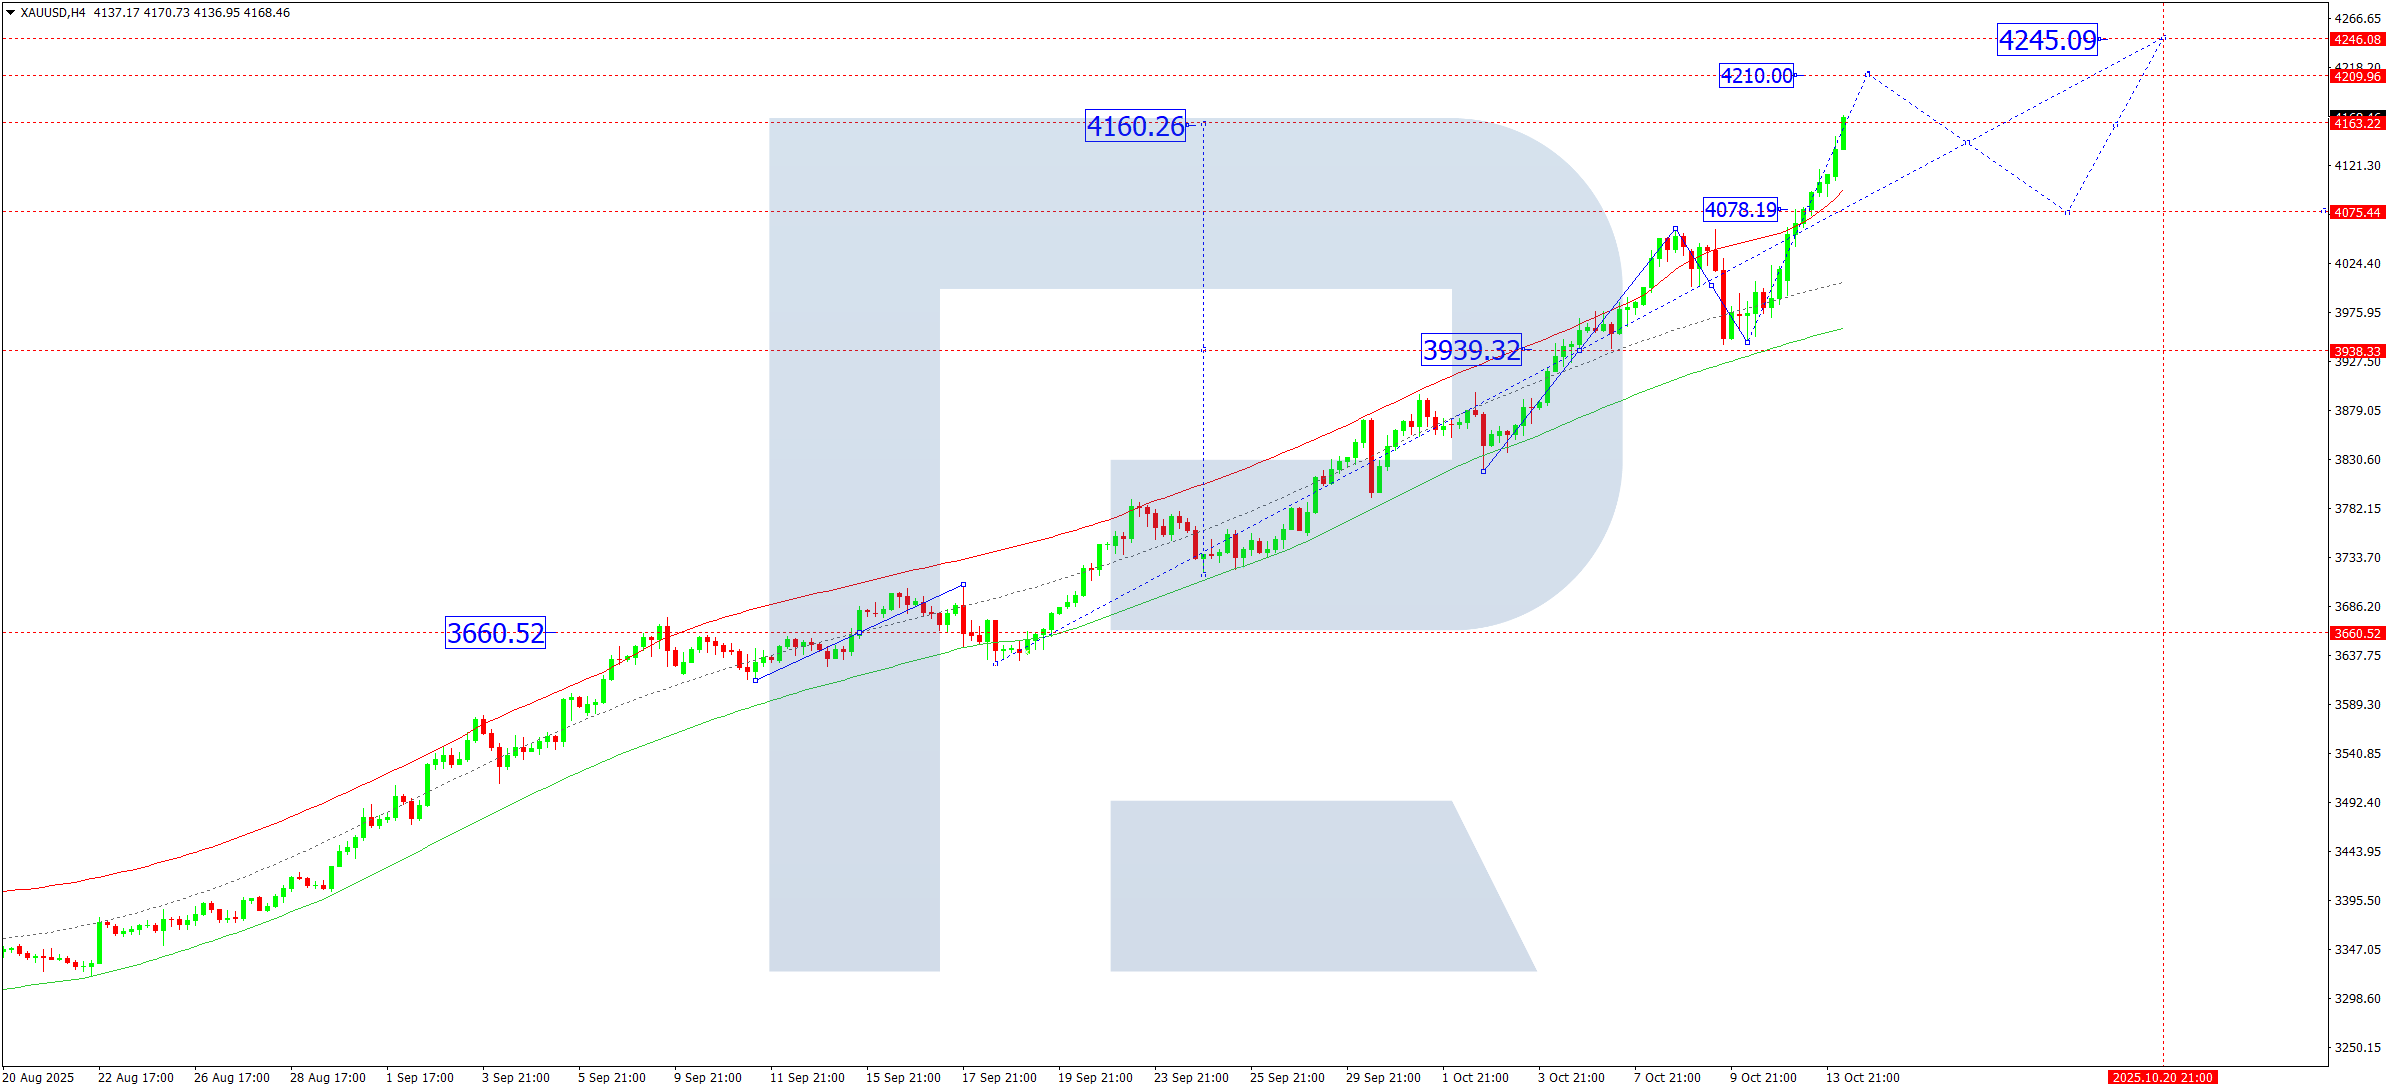
XAUUSD has completed an upward swing to 4,179. A correction to 4,080 is possible today, followed by a new upward leg towards 4,210.
A consolidation zone may form near 4,080. If the price breaks upward, the rally may continue towards 4,245. However, a downside breakout could deepen the correction to 3,939.
The Elliott Wave structure and bullish wave matrix support this view, with 3,660 identified as the key pivot level. The price is moving towards the upper boundary of the Price Envelope at 4,245, but short-term pullbacks remain likely.
Technical indicators suggest a potential rise to 4,210, followed by a corrective move towards 4,080.
Brent Crude Oil Forecast
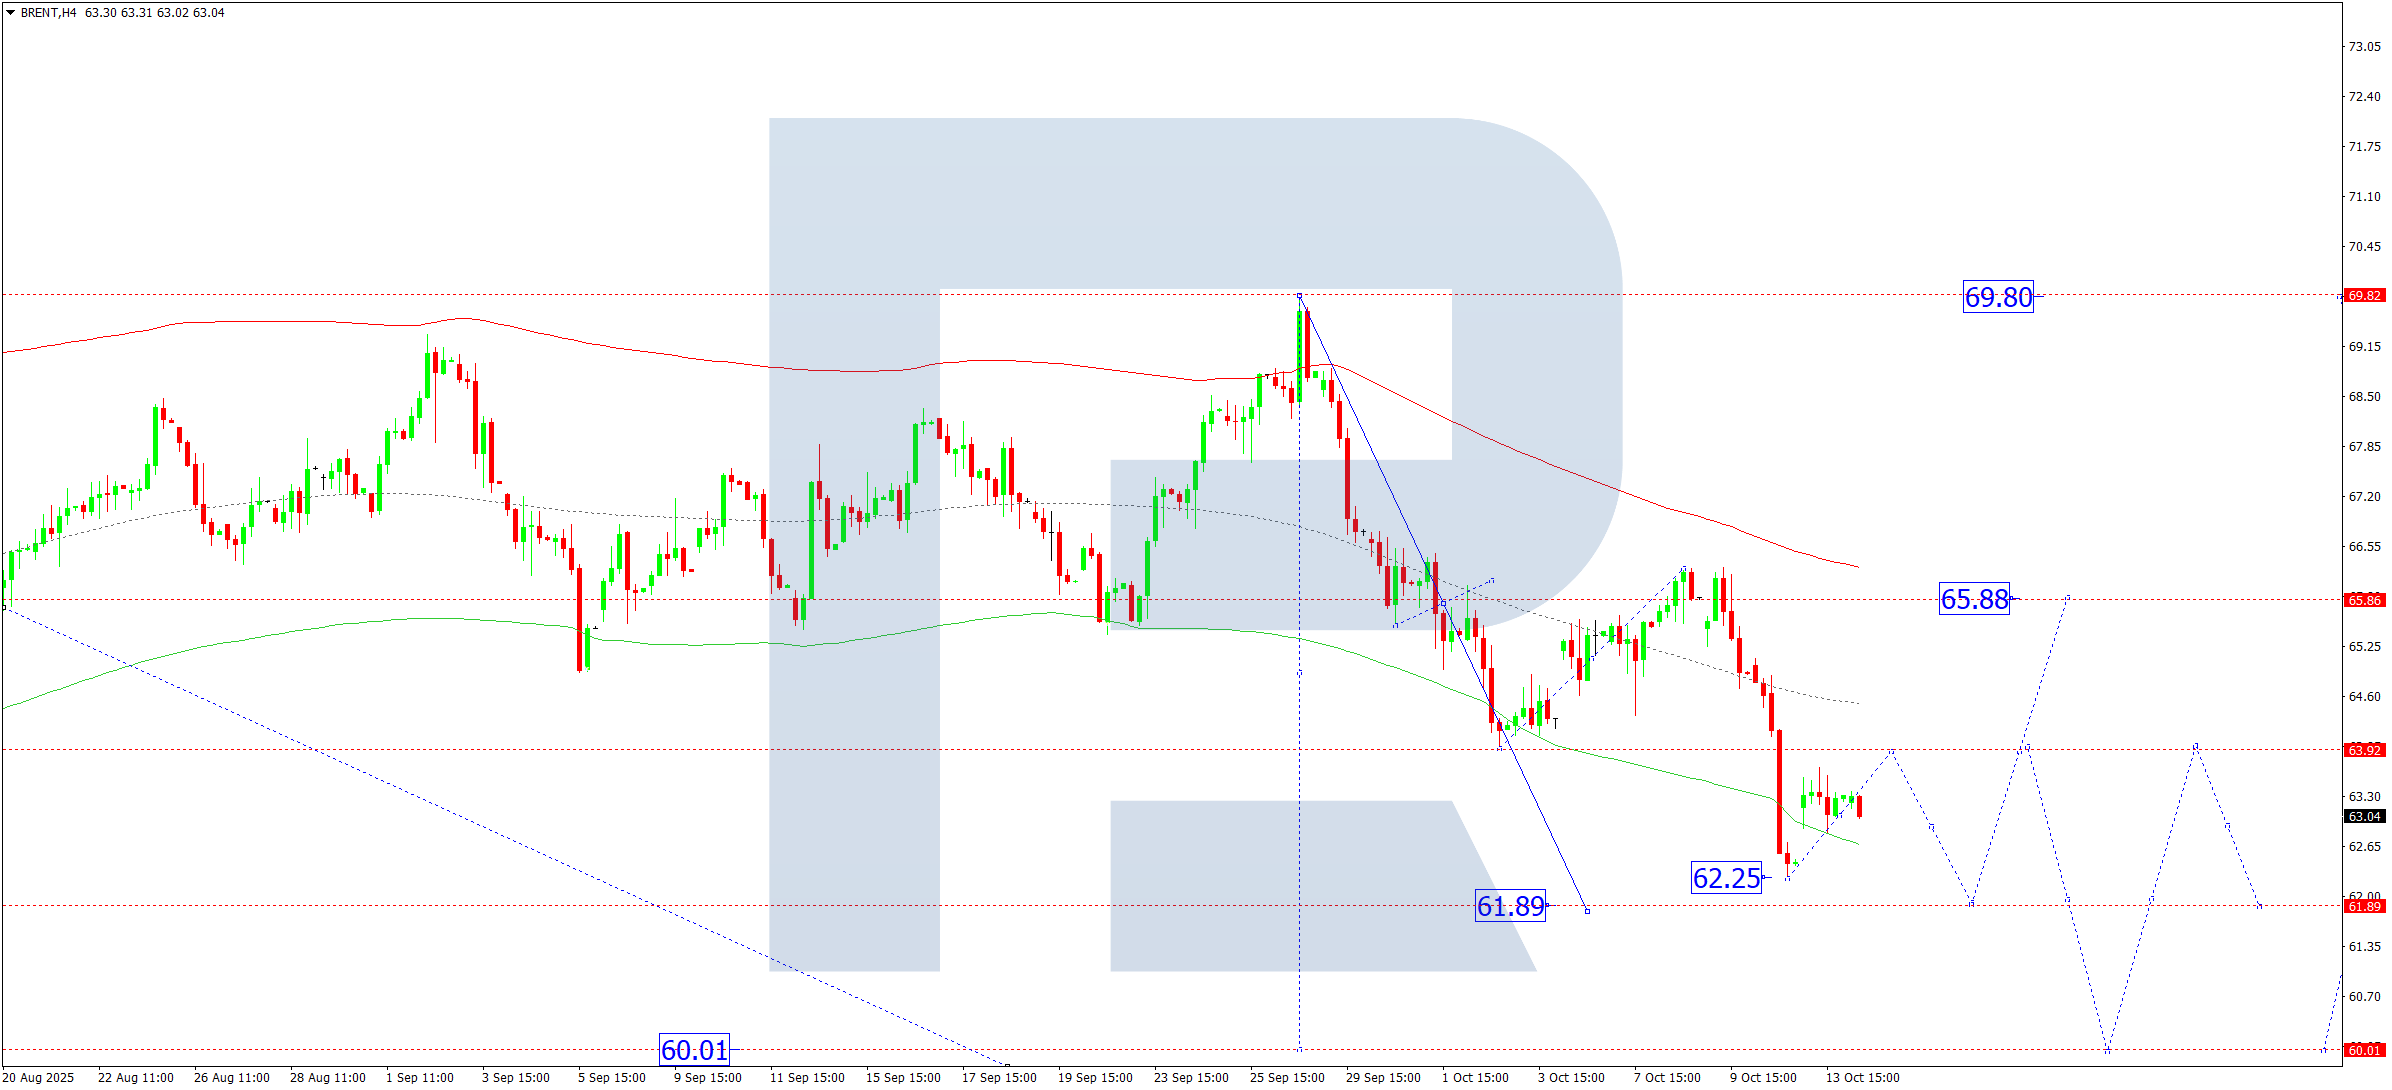
On the H4 chart, Brent is consolidating above 62.25. A short-term rise towards 63.90 (testing previous support from below) may occur today.
A broader consolidation range is developing around 65.88, the pivot level in Brent’s wave structure. A breakout above this could lead to a rally towards 69.80. On the downside, a break below 62.25 could see the trend extend to 61.61, with 60.00 as a deeper target.
The Elliott Wave structure and bearish wave matrix point to 65.88 as the critical resistance. While a corrective move higher is possible, the dominant trend remains bearish.
Technical indicators indicate a possible correction to 63.90, followed by a renewed decline towards 61.61.
Disclaimer:
The above analysis is based on technical patterns, wave structures, and historical price action. Past performance is not indicative of future results. Please use risk management and consult with a financial advisor before trading.
Leave a Reply