
Daily technical analysis and forecast for 17 October 2025
EURUSD Forecast
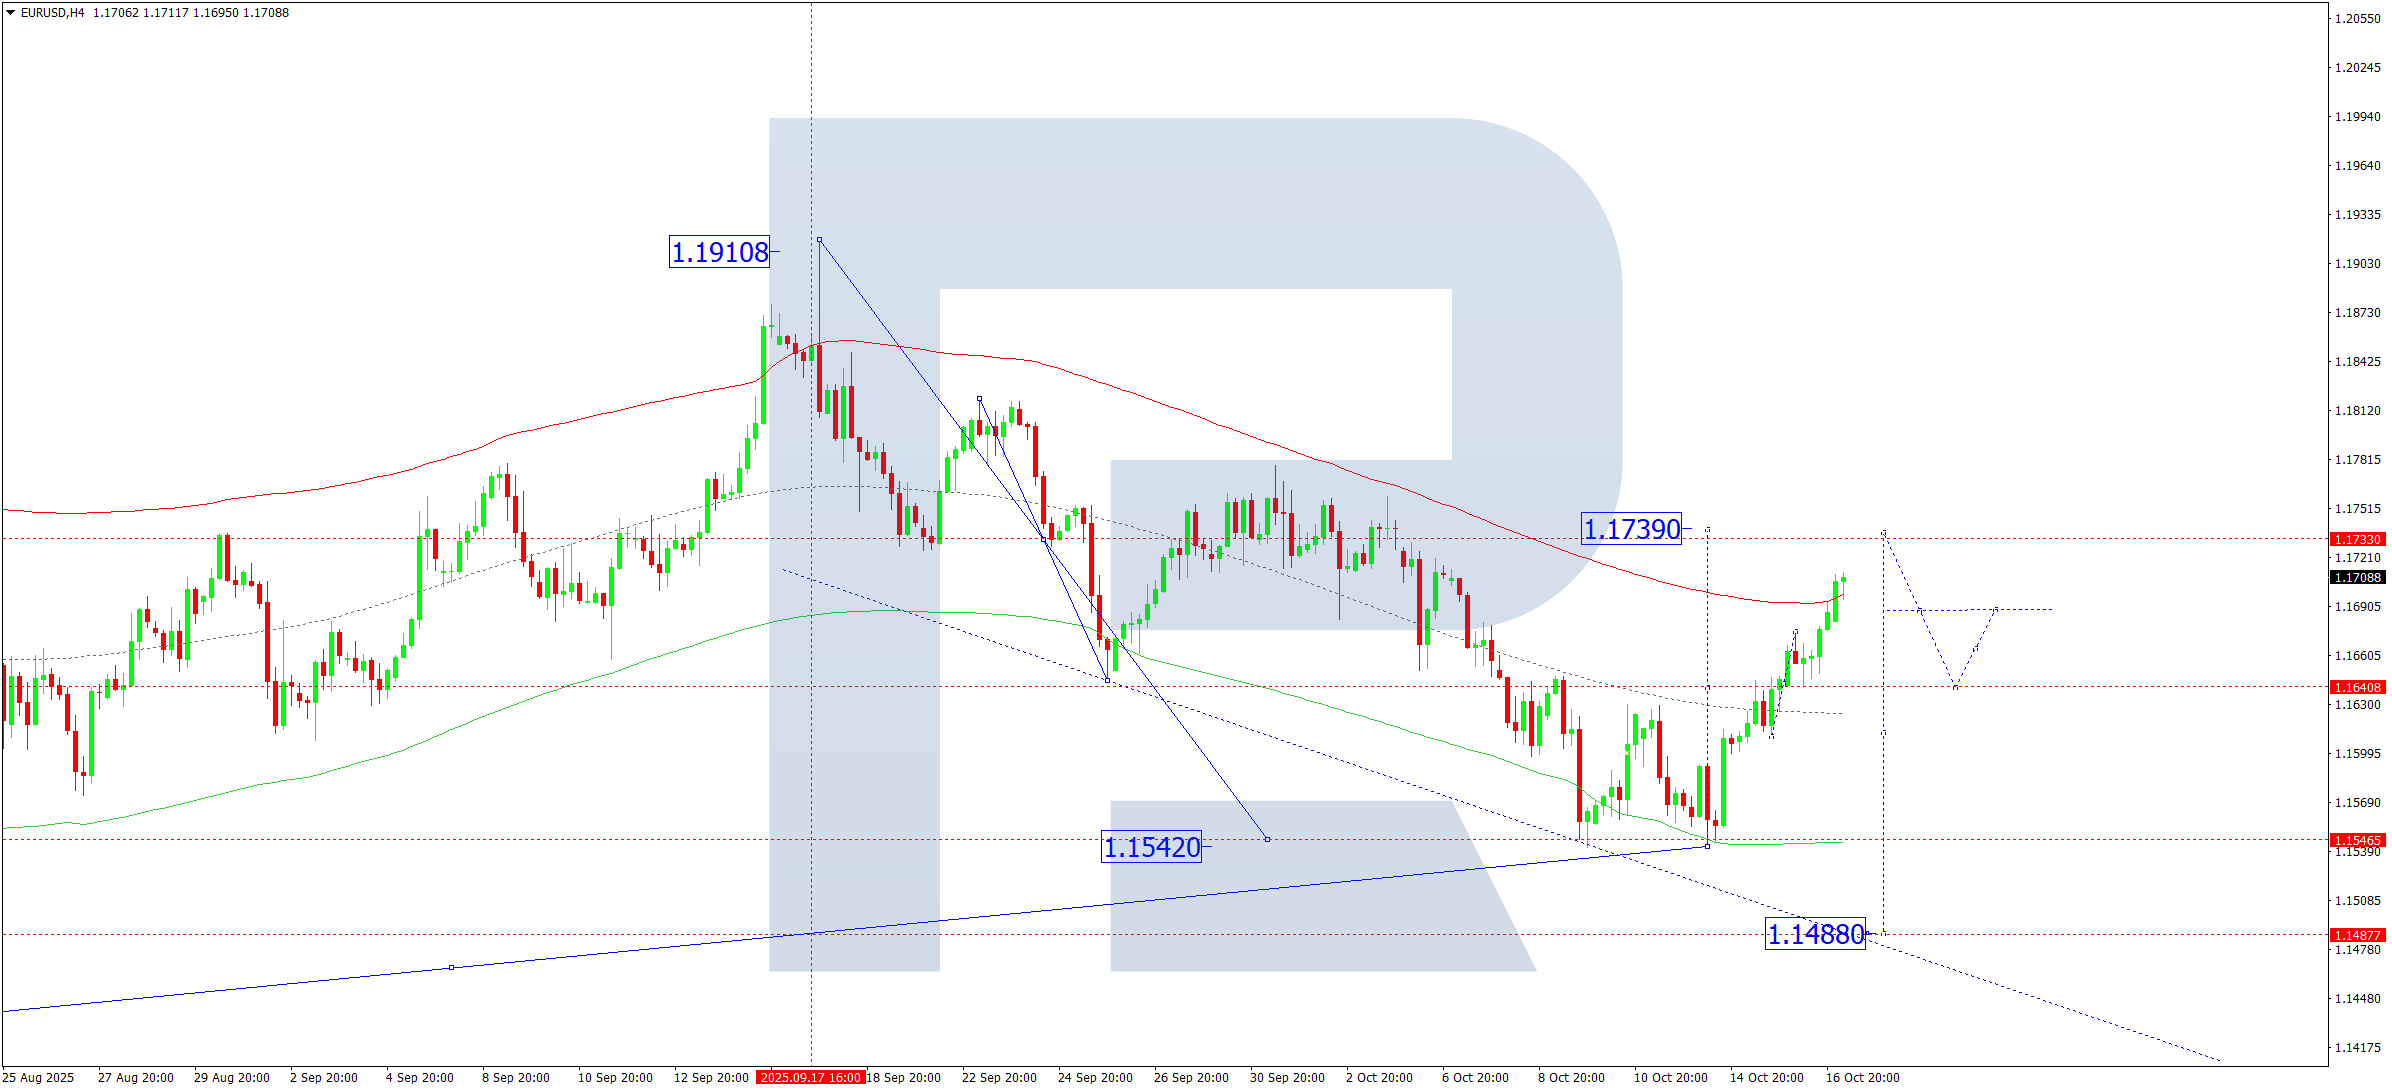
On the H4 timeframe, EURUSD has formed a consolidation zone near 1.1640 and broken to the upside, continuing its corrective movement towards 1.1733. For 17 October 2025, a pullback to 1.1640 (retesting from above) is expected. If this level holds, the pair could rise further towards 1.1739. Once this corrective phase concludes, a new bearish wave targeting 1.1488 may develop.
This outlook aligns with the Elliott Wave structure and a bearish wave matrix, with a key pivot at 1.1740. A move to the upper boundary of the Price Envelope at 1.1739 is anticipated before a reversal towards the lower boundary near 1.1488.
Technical Outlook:
The corrective move may complete around 1.1739, setting the stage for a new bearish wave towards 1.1488.
USDJPY Forecast
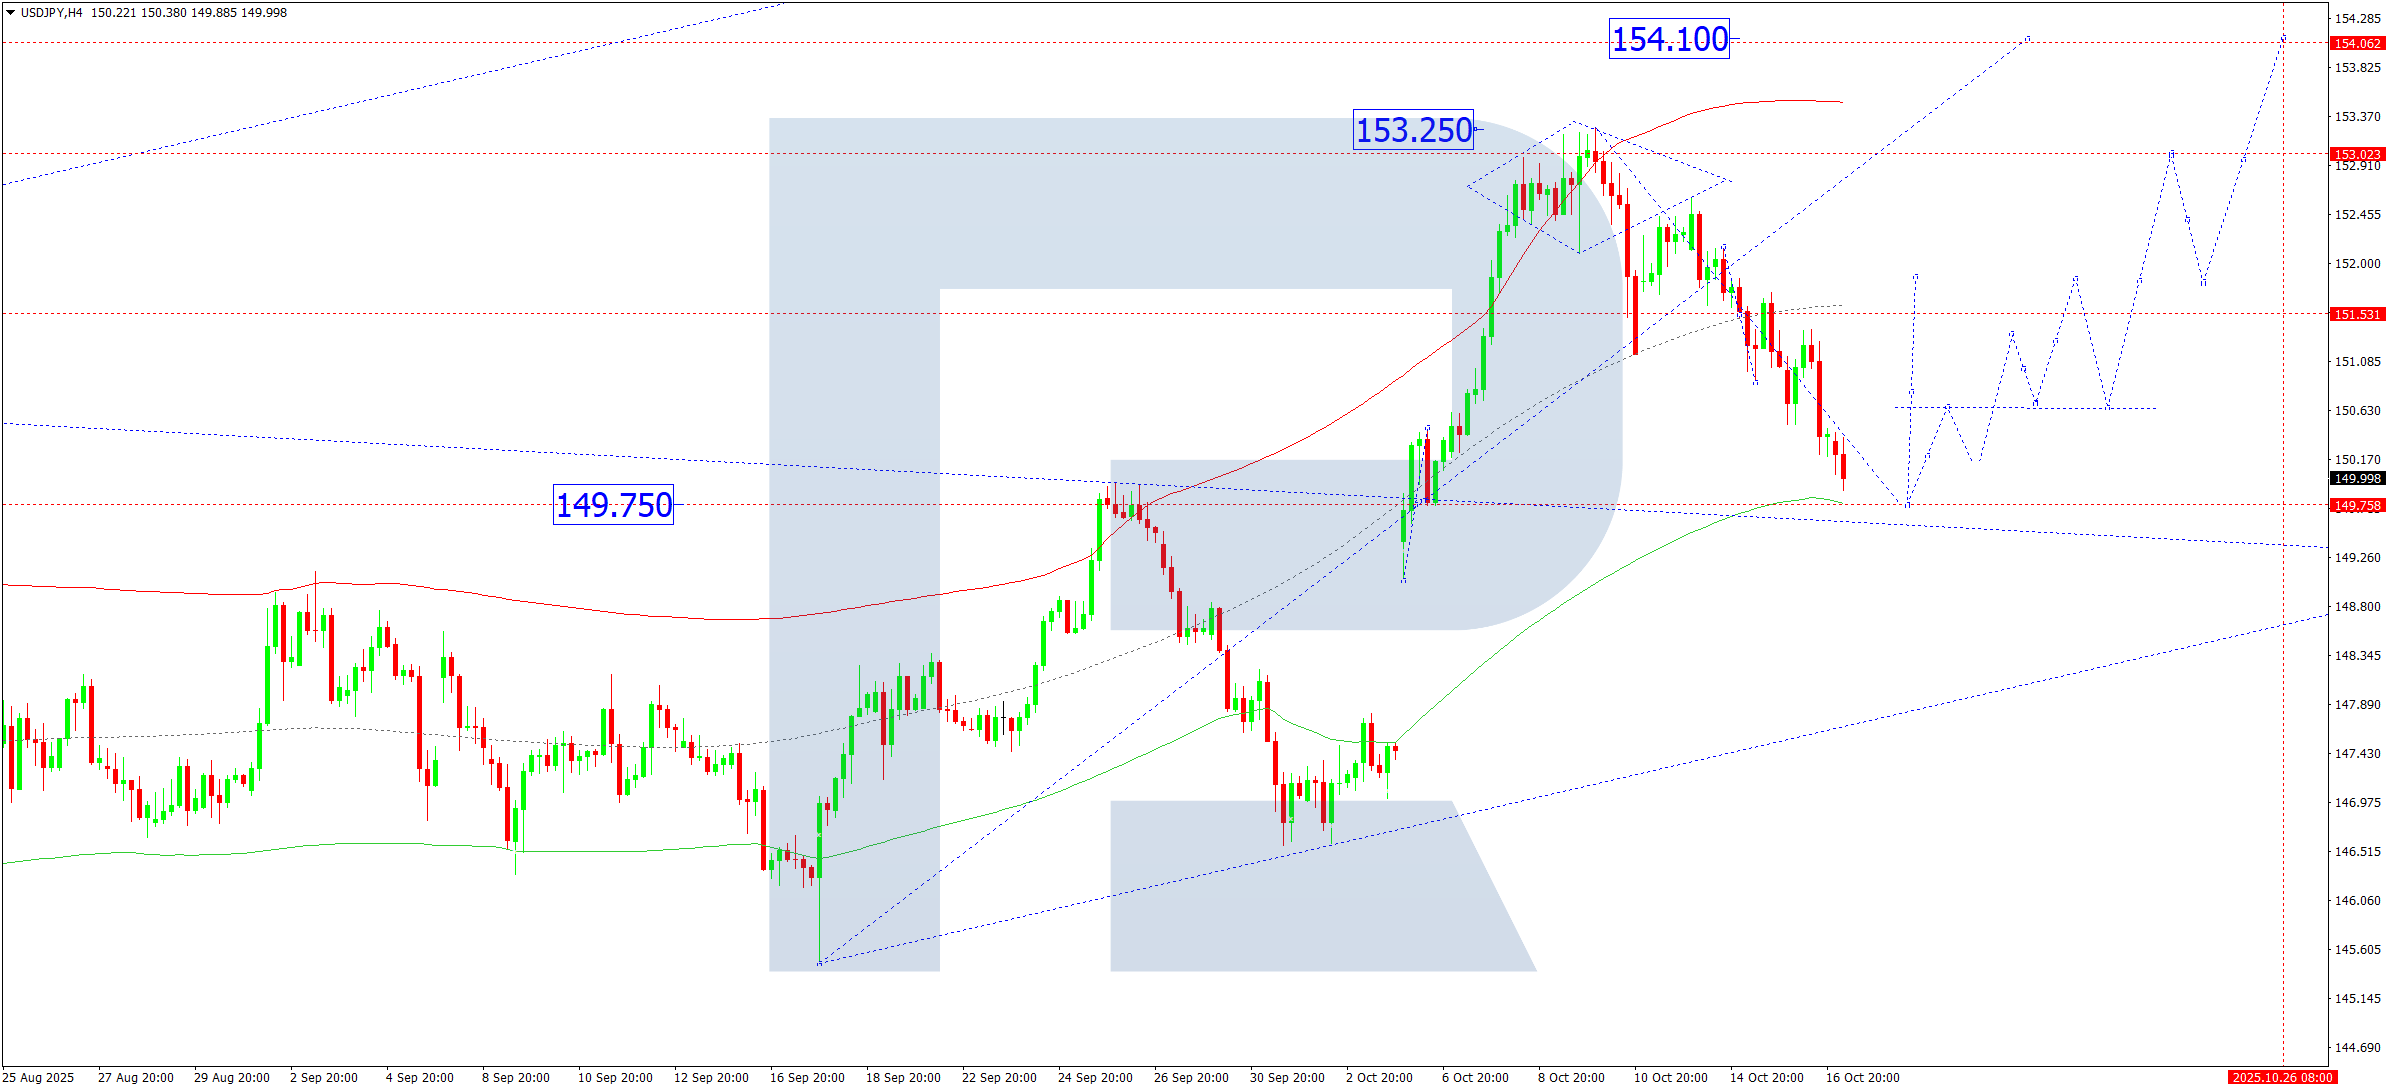
USDJPY remains in a corrective phase on the H4 chart, targeting 149.75. On 17 October 2025, the correction is expected to complete, followed by a bullish continuation towards 151.85, with the potential to extend to 154.10.
The Elliott Wave structure and a bullish wave matrix support this scenario, with 149.75 acting as a key pivot level. Once the correction ends near the lower boundary of the Price Envelope, a bullish wave towards the upper boundary at 154.10 is expected.
Technical Outlook:
Further correction to 149.75 likely, followed by a bullish move towards 151.85 and potentially 154.10.
GBPUSD Forecast
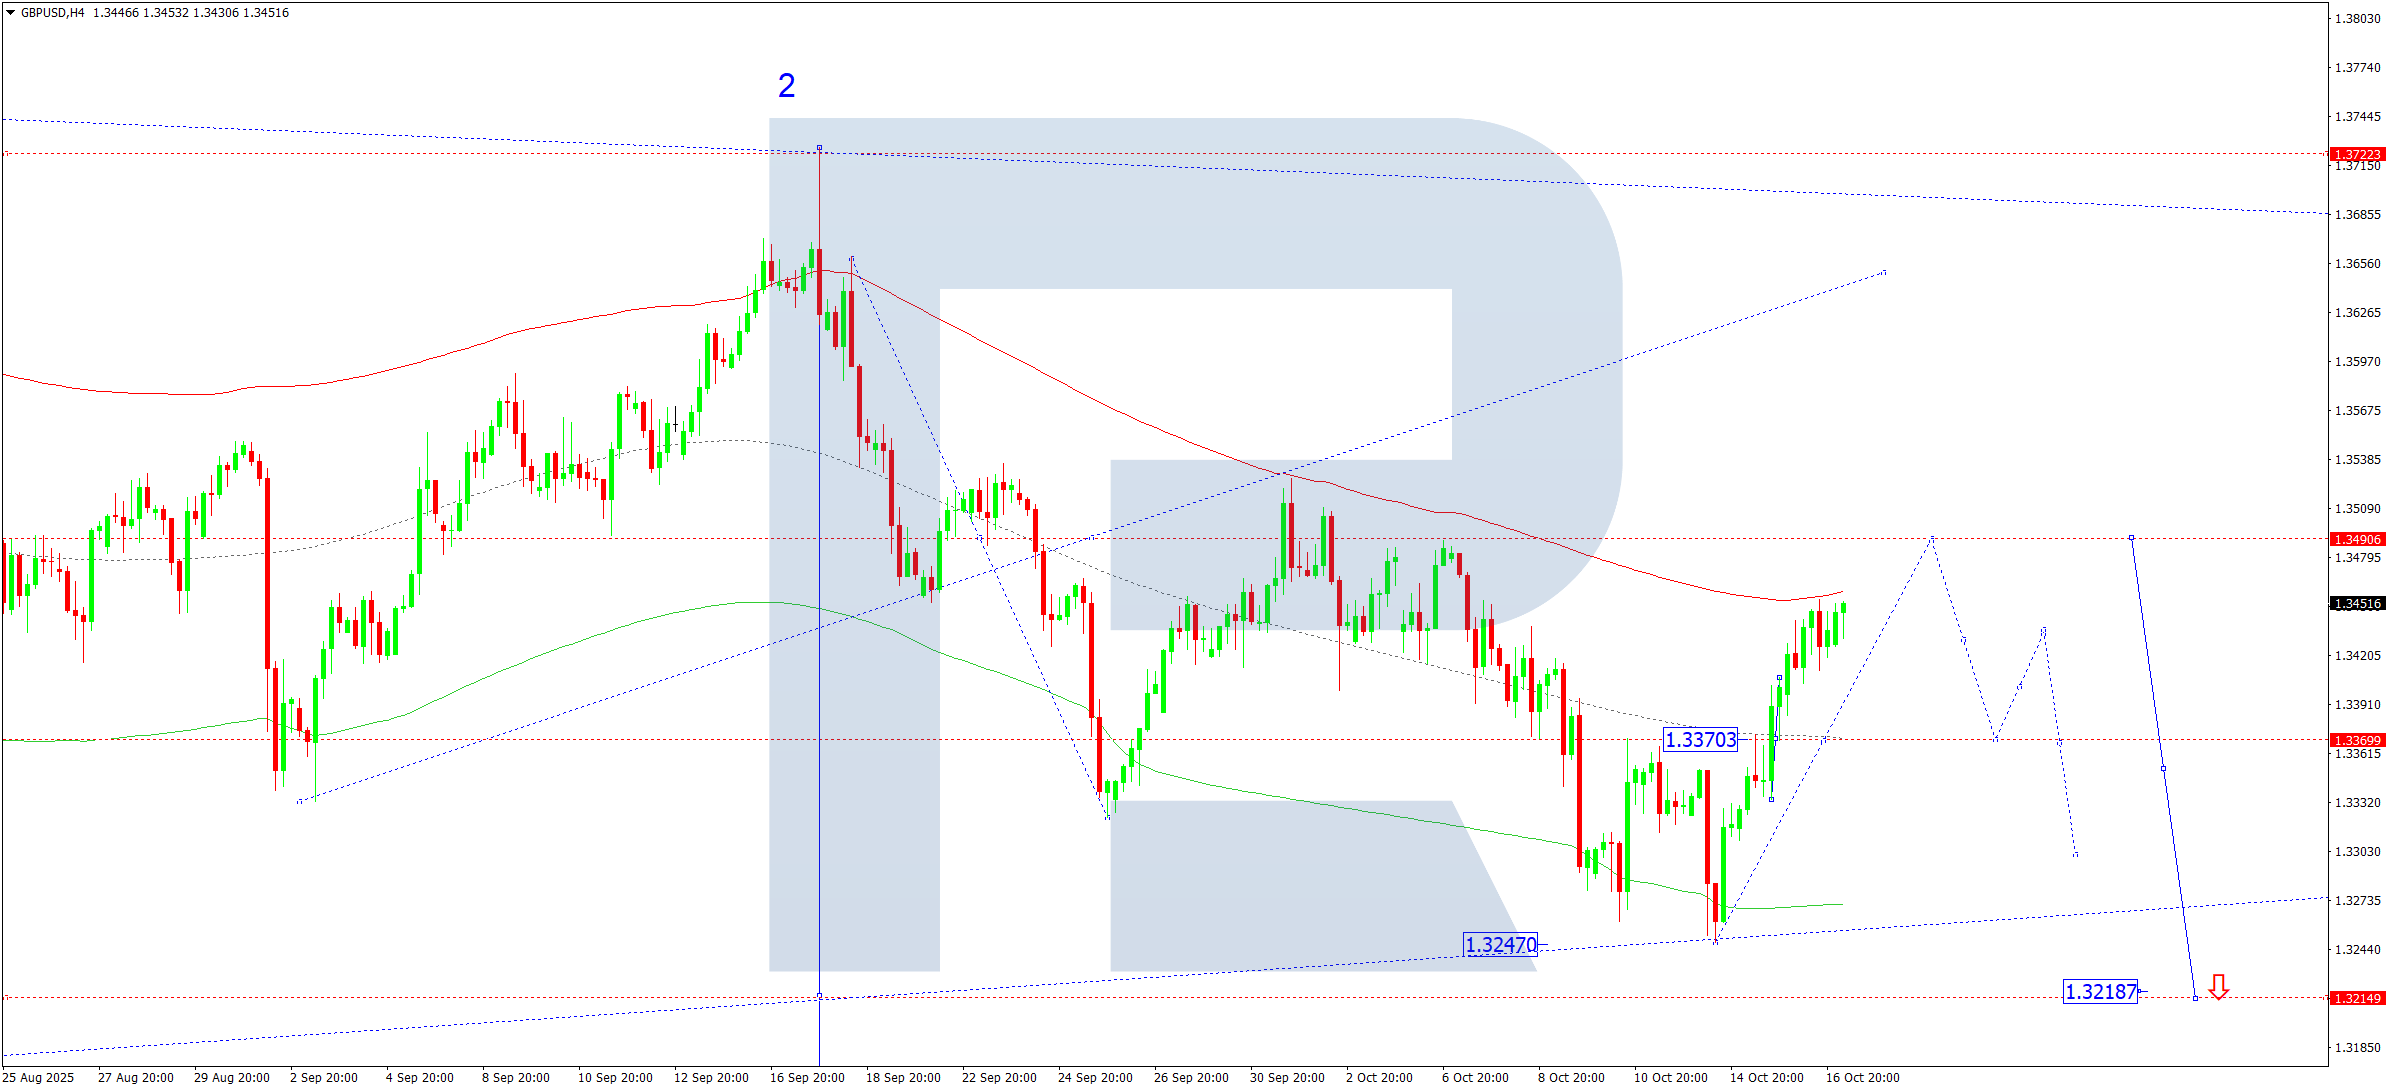
GBPUSD has broken out of a consolidation range near 1.3370 on the H4 chart, moving upwards toward 1.3490 in a corrective wave. This correction is likely to end today, after which a decline back to 1.3370 is expected. A break below this level could lead to further downside toward 1.3218.
Supported by the Elliott Wave structure and a bearish wave matrix, 1.3490 acts as the pivot. The Price Envelope shows consolidation around its midpoint, with potential for a move to the upper boundary before a reversal toward 1.3218 or even 1.3125.
Technical Outlook:
Correction may conclude near 1.3490, followed by a potential decline to 1.3218 and 1.3125.
AUDUSD Forecast
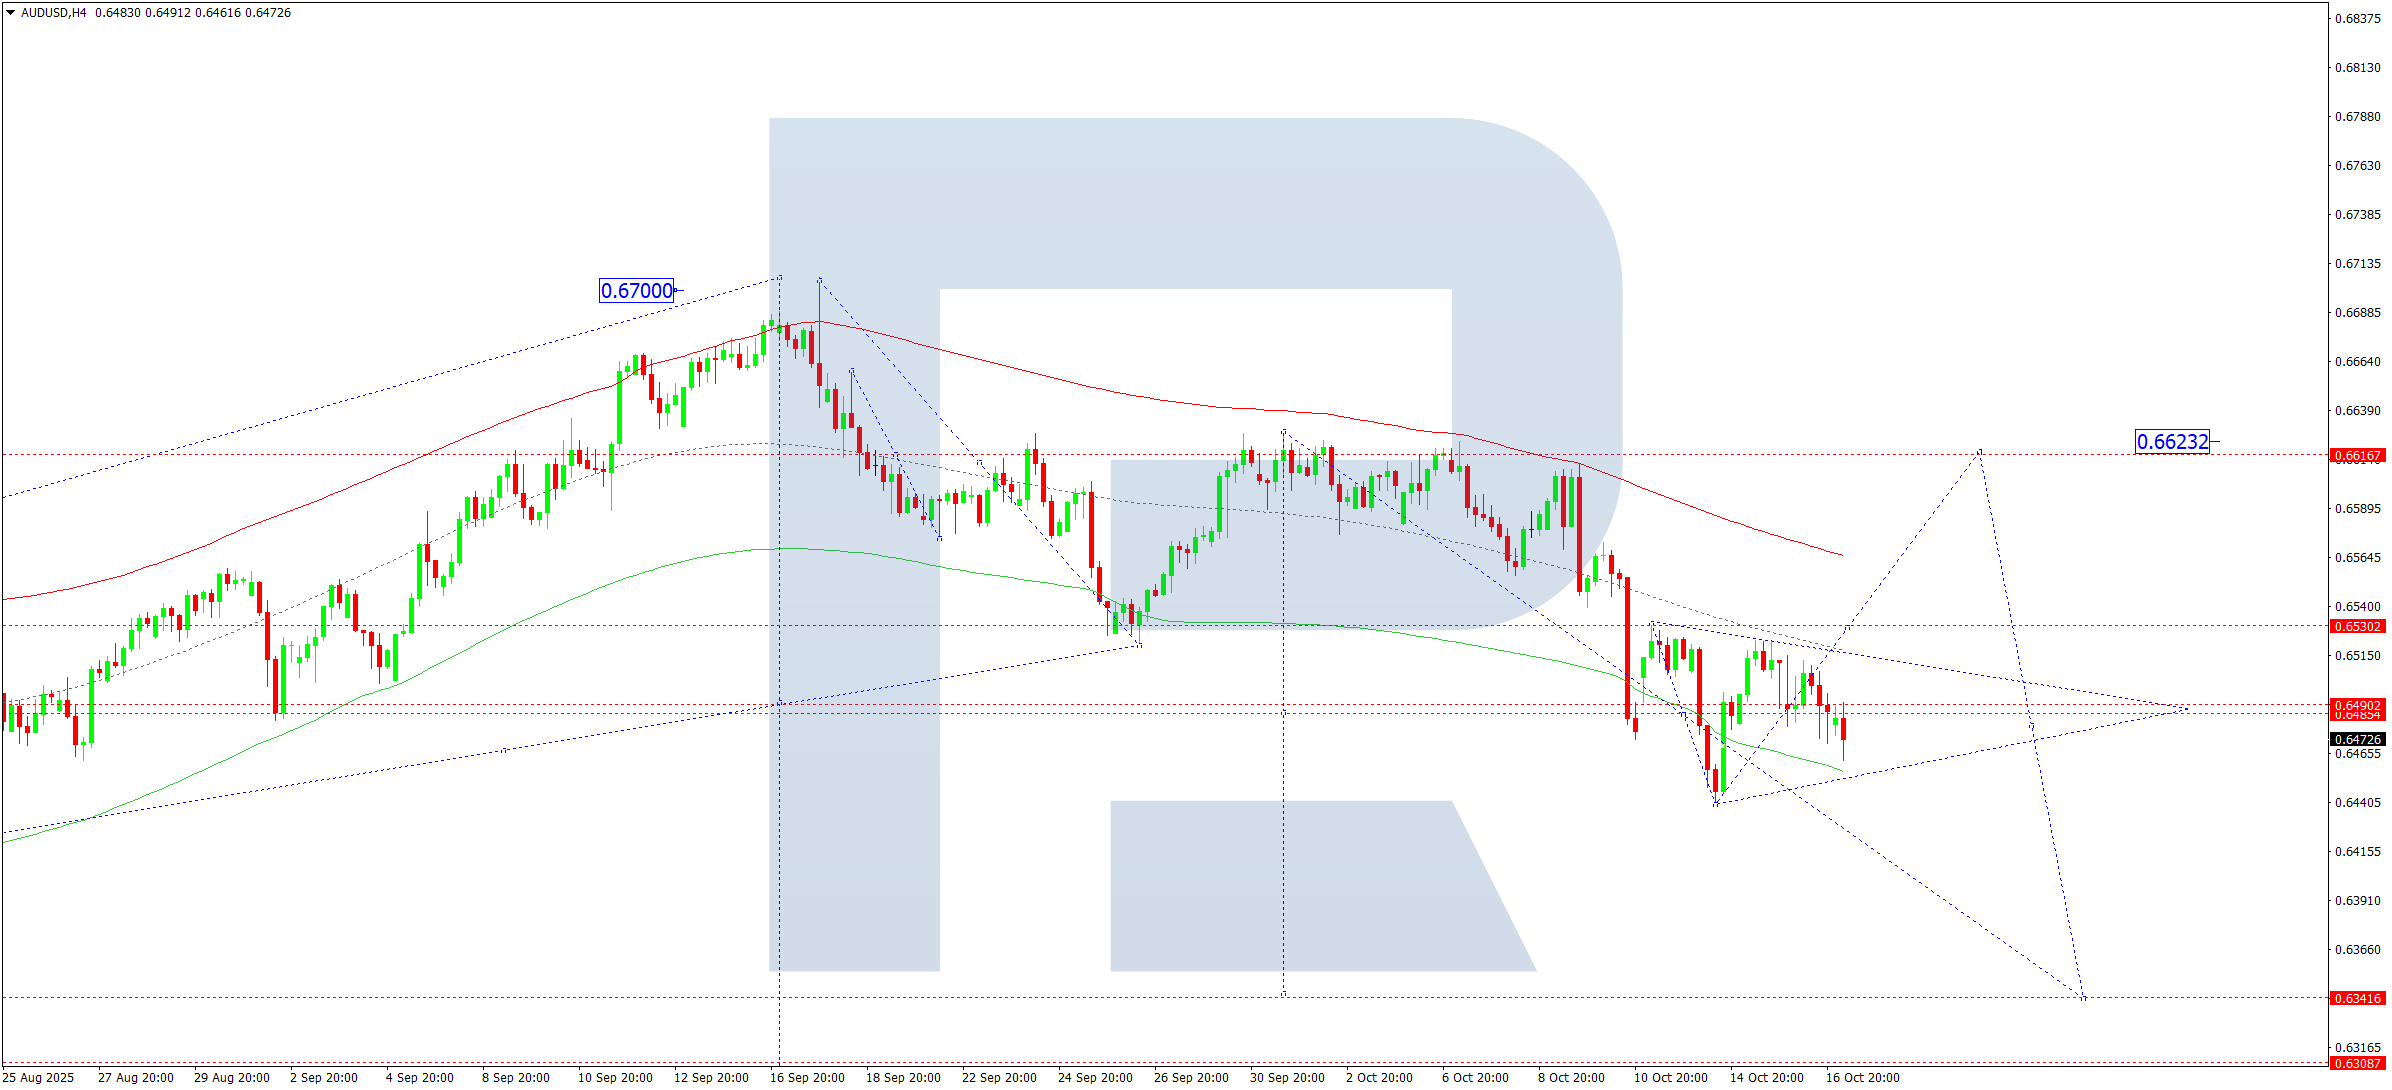
AUDUSD is consolidating near 0.6490 on the H4 chart. A downside breakout could trigger a move towards 0.6340, while an upside breakout may lead to a short-term correction to 0.6623, before resuming the downtrend.
The Elliott Wave structure and bearish wave matrix highlight 0.6620 as a key pivot. Currently, the pair is above the lower Price Envelope boundary at 0.6440. A breakout above could lead to a move toward 0.6623, while a downside move opens the path to 0.6340.
Technical Outlook:
Short-term correction to 0.6623 possible, followed by a bearish move towards 0.6340.
USDCAD Forecast
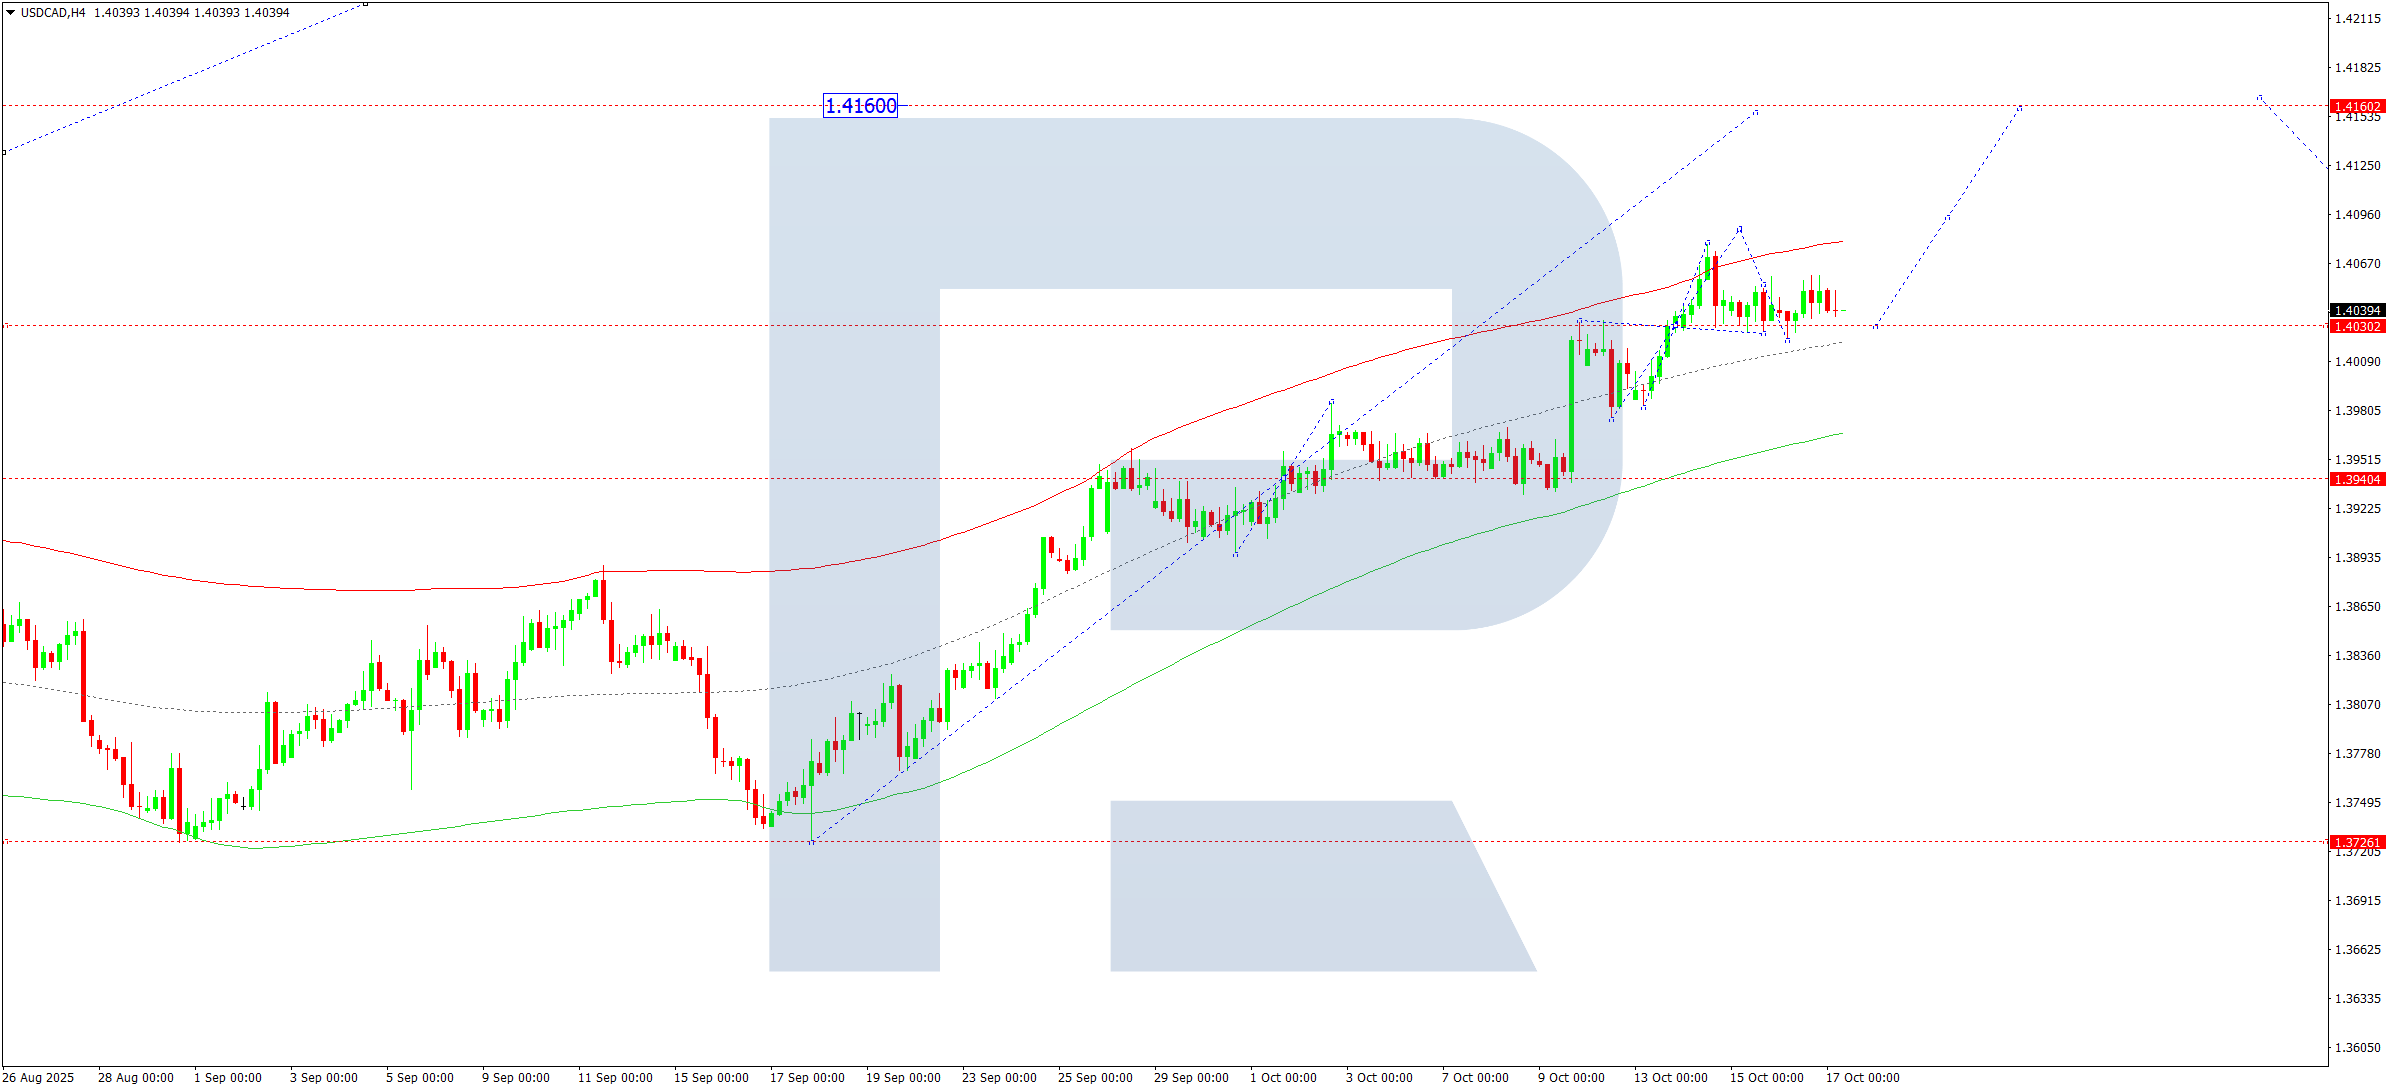
USDCAD is forming a consolidation zone around 1.4030 on the H4 chart. A downward breakout may trigger a correction towards 1.3940, while an upward breakout could initiate a third bullish wave to 1.4160. A retracement back to 1.3940 may follow.
This is in line with the Elliott Wave structure and a bullish matrix, with 1.3940 as the pivot. The pair is expected to rise toward the upper boundary of the Price Envelope at 1.4160, then pull back before targeting 1.4330.
Technical Outlook:
Likely continuation toward 1.4080 and 1.4160, followed by a potential correction to 1.3940.
XAUUSD (Gold) Forecast
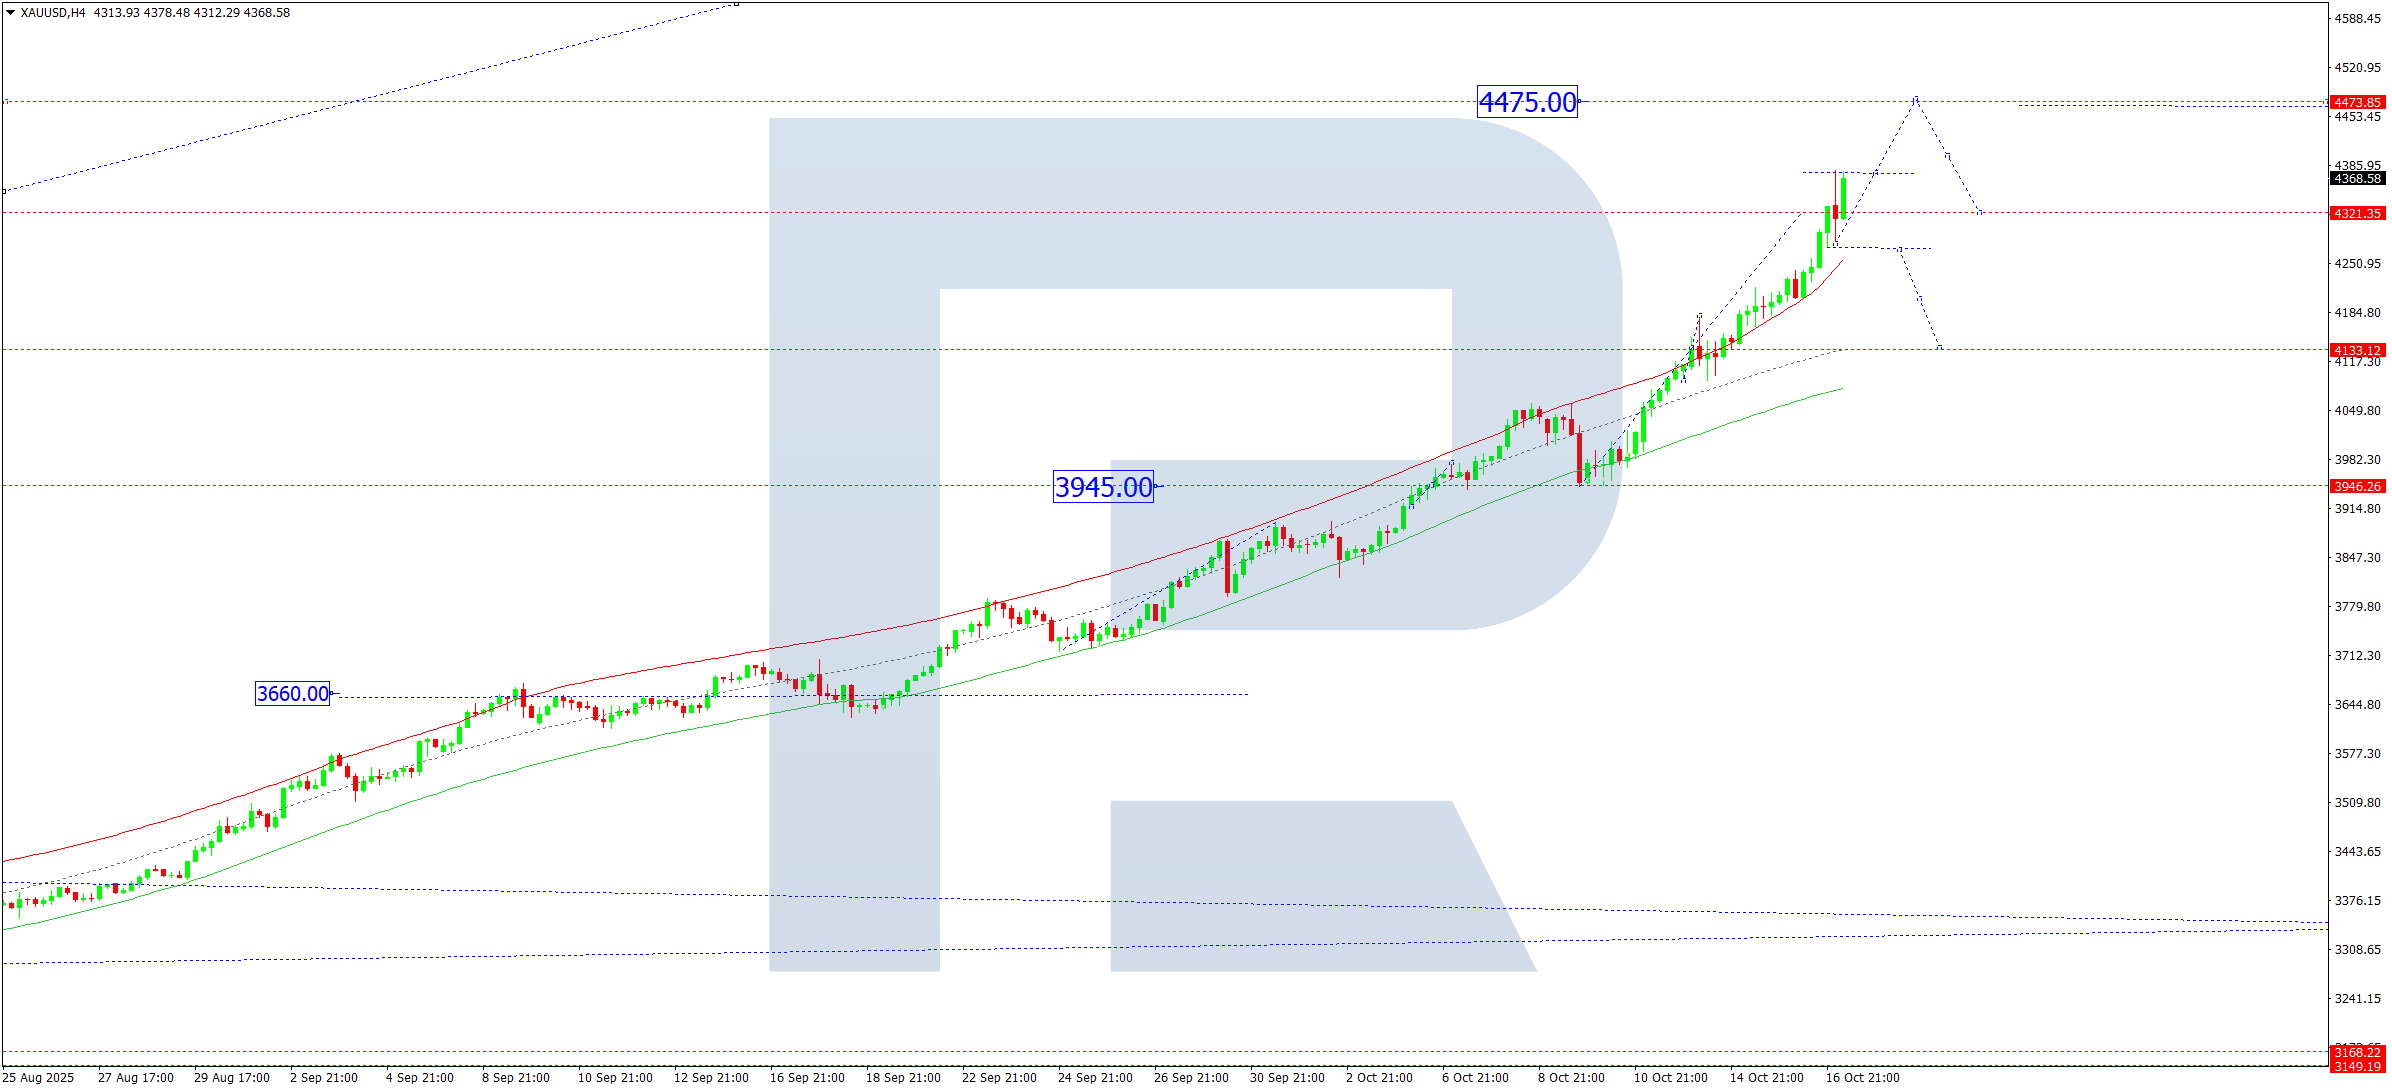
Gold has reached 4,375 on the H4 chart and is currently forming a consolidation range below this level. A breakout to the upside could lead to 4,475, while a breakdown may initiate a correction to 4,133.
This is supported by the Elliott Wave pattern and a bullish wave matrix, with a major pivot at 3,660. A continued move towards the upper Price Envelope boundary at 4,475 is expected before any significant retracement toward 4,133.
Technical Outlook:
Potential for further upside to 4,475, with a correction toward 4,133 thereafter.
Brent Crude Forecast
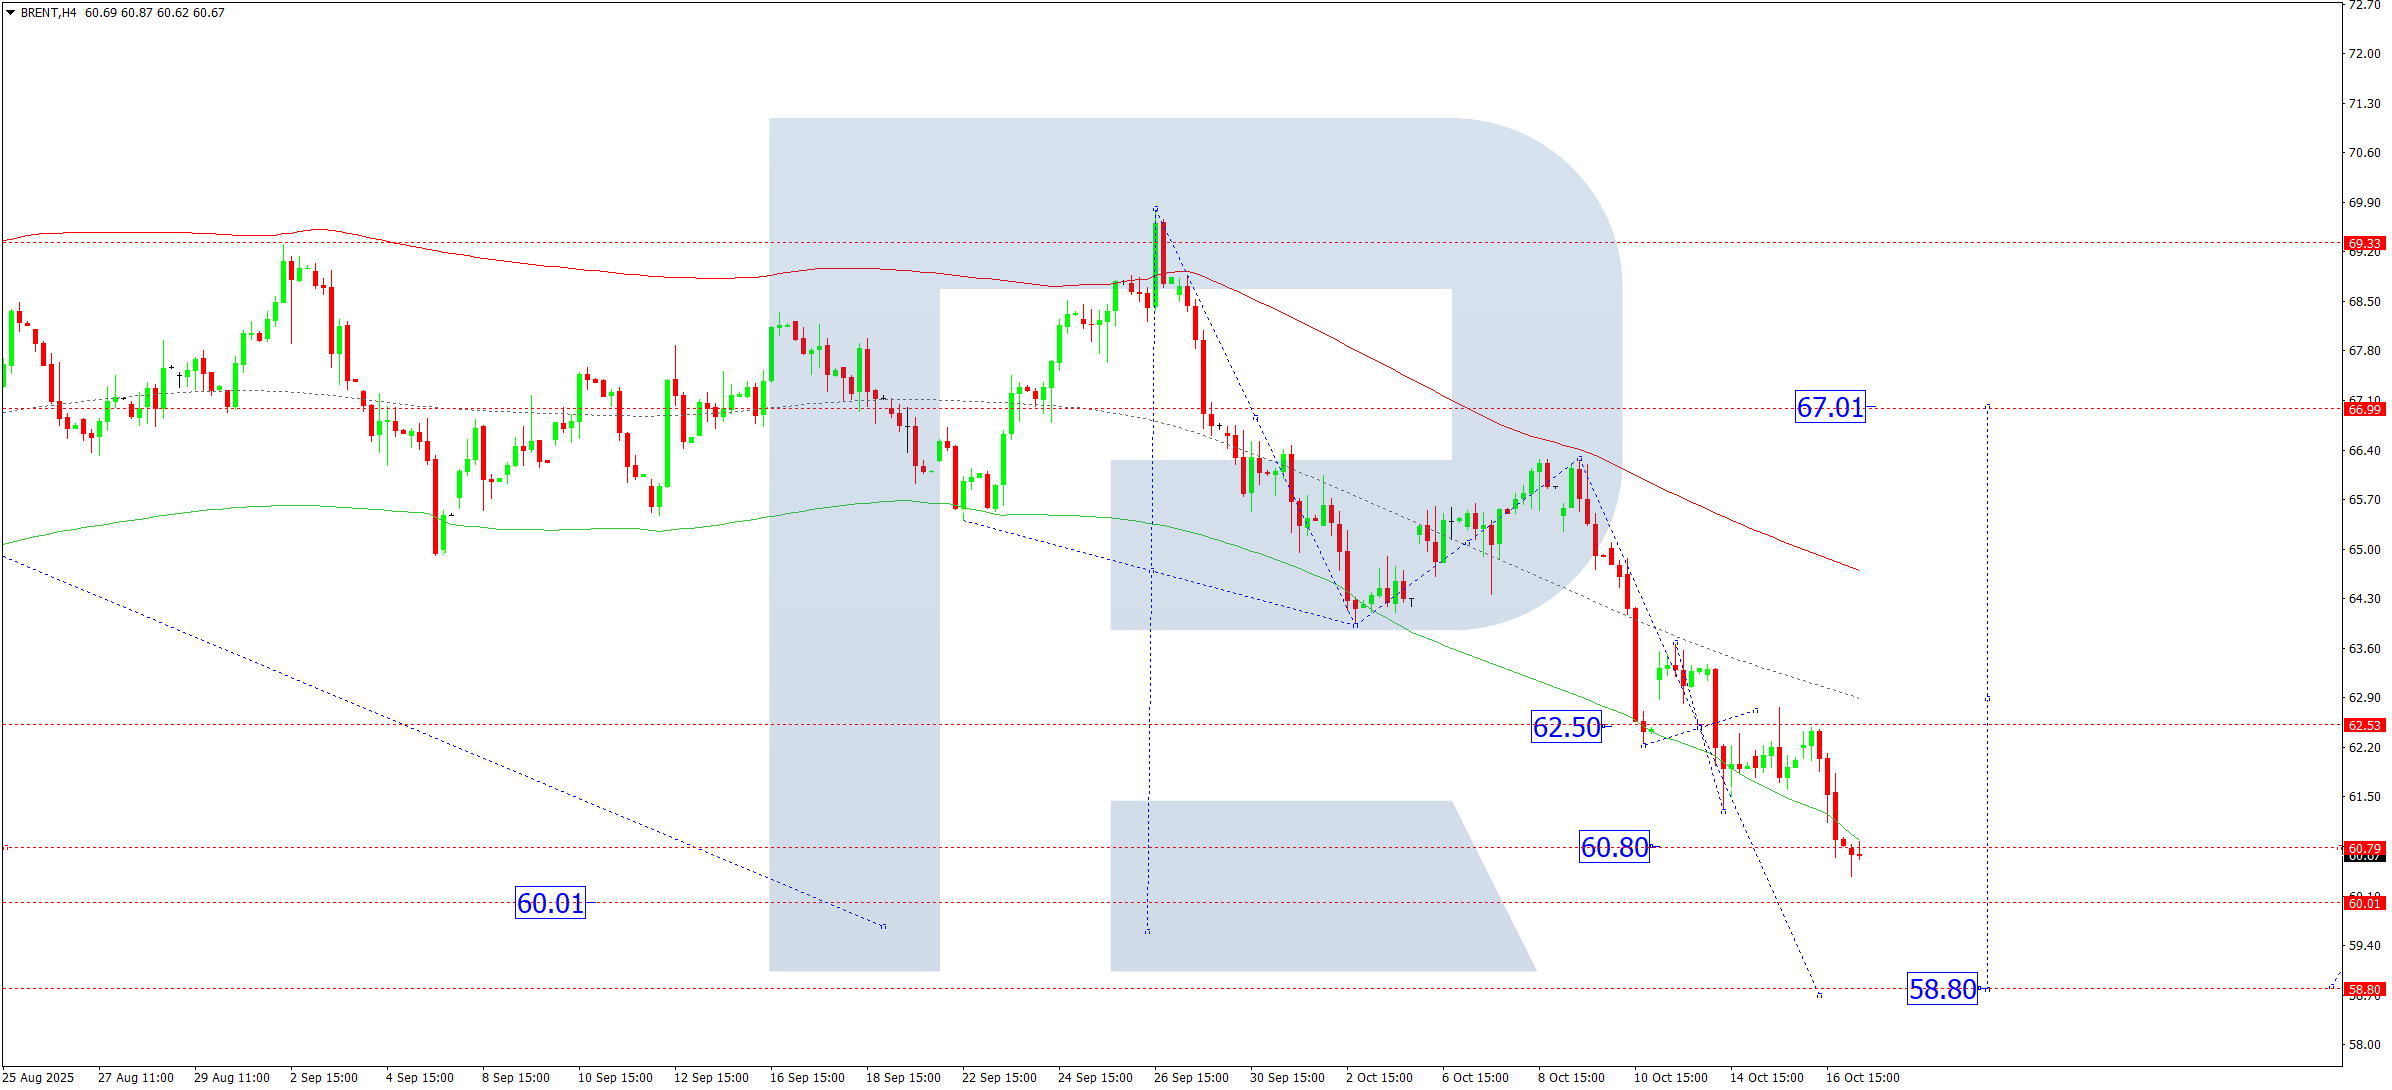
Brent crude completed a decline to 60.80 and is now consolidating at this level on the H4 chart. A downside breakout may open the way to 60.00, possibly extending to 58.80. A reversal and rally towards 63.00, and potentially 67.00, may follow.
This view aligns with the Elliott Wave structure and bearish matrix, with 63.63 as the pivotal resistance. Brent may correct towards the upper boundary of the Price Envelope at 63.00 before another decline toward 60.00.
Technical Outlook:
Possible decline to 60.00 before a corrective move higher to 63.00.
Risk Disclaimer:
Past performance is not indicative of future results. This analysis is for informational purposes only and does not constitute investment advice. Trading carries risk and may not be suitable for all investors.
Leave a Reply