
Daily Technical Analysis and Forecast – 21 October 2025
EURUSD Forecast – 21 October 2025
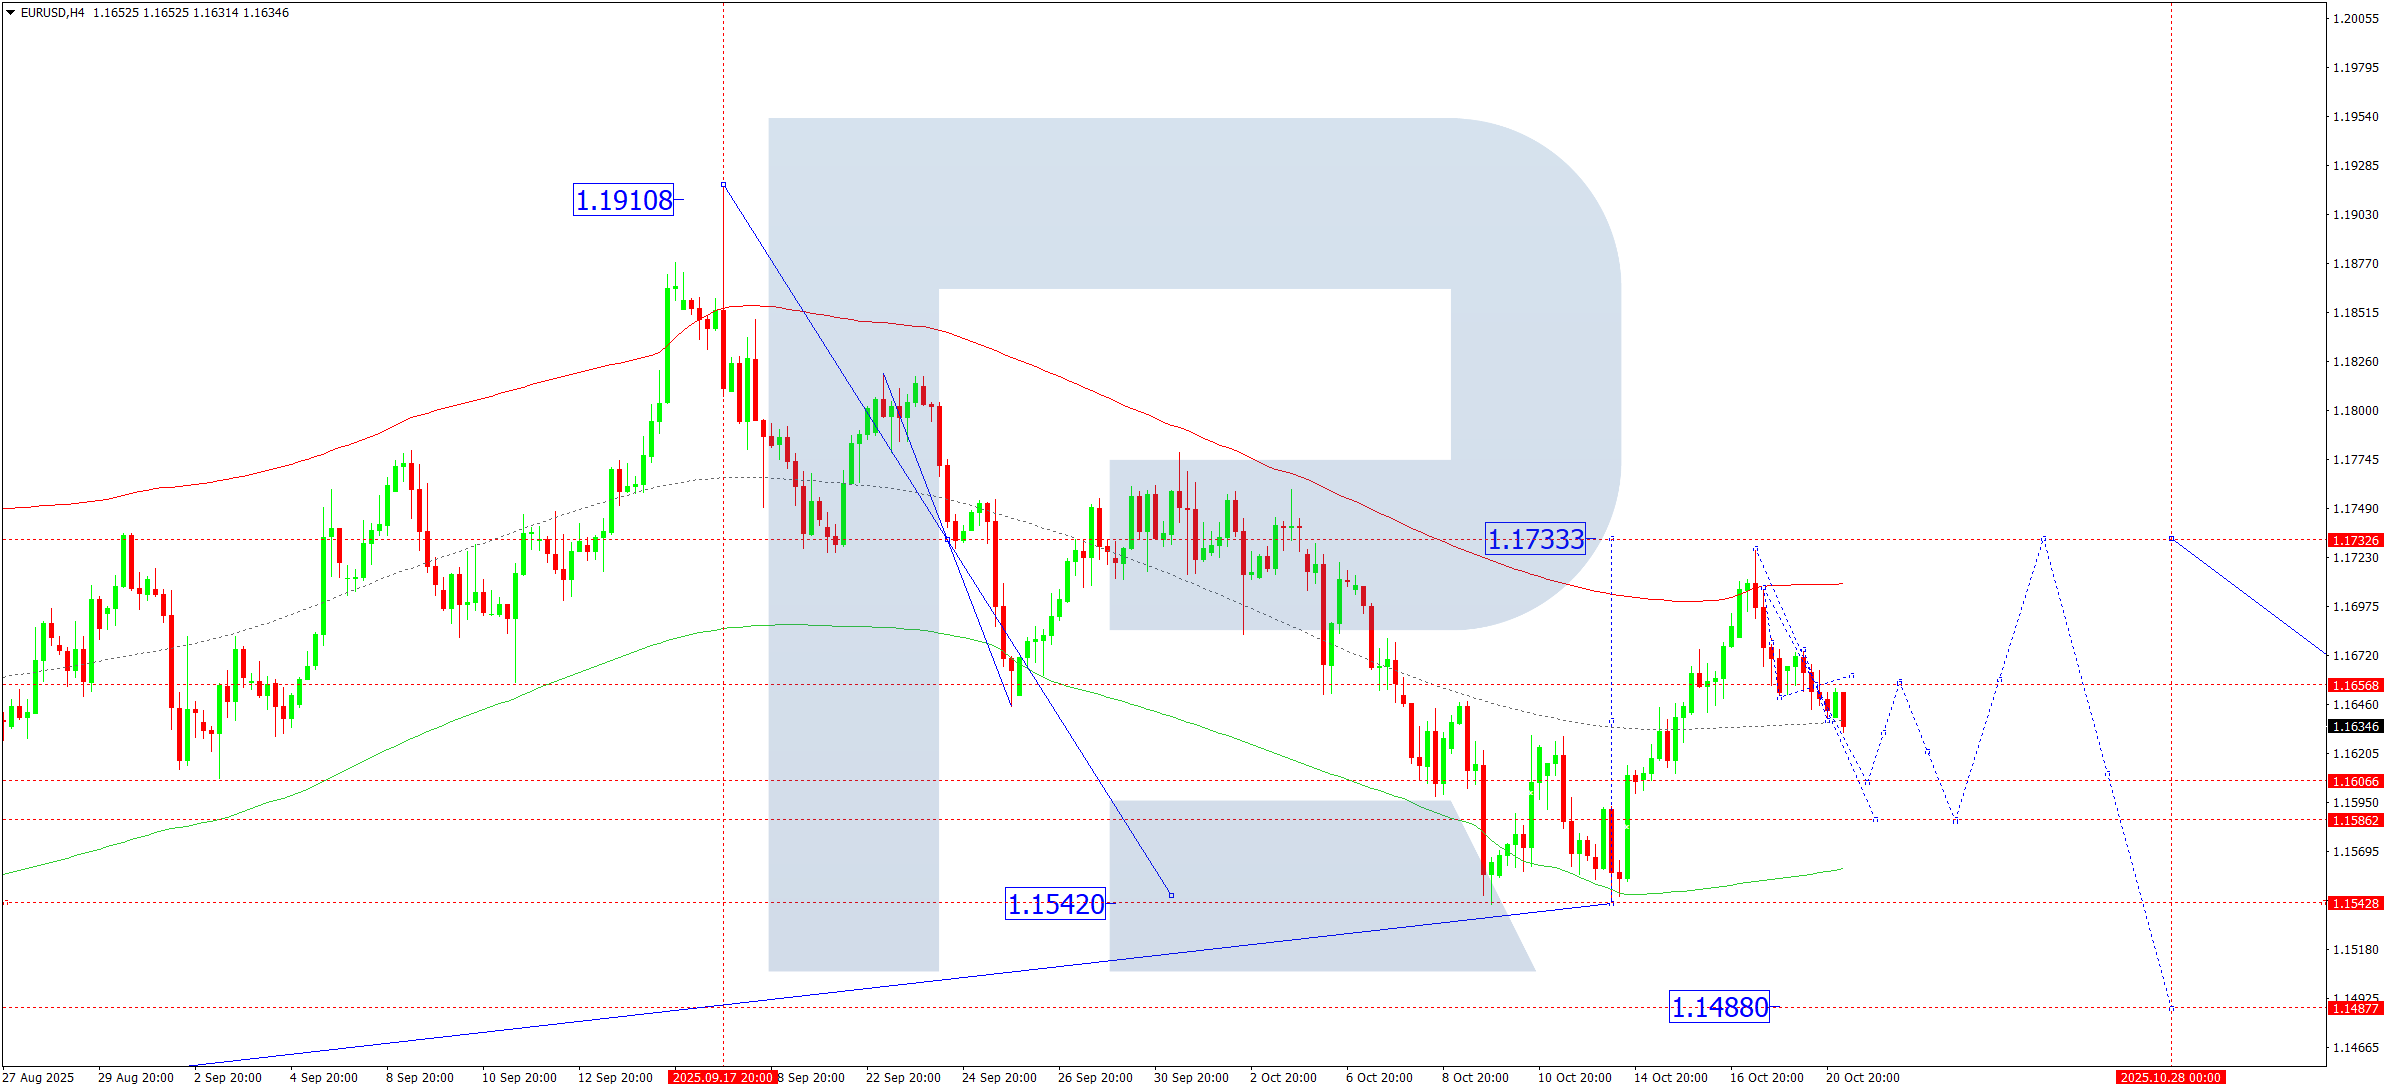
On the H4 timeframe, EURUSD formed a narrow consolidation zone near 1.1656 before breaking lower. For today, a continued decline towards 1.1606 is expected, followed by a rebound to retest 1.1656 from below. A further drop towards 1.1586 could follow, forming a broader consolidation structure.
A breakout to the upside could trigger a correction towards 1.1733, while a break below 1.1586 would pave the way for a move down to 1.1488 and possibly further to 1.1240.
The current structure aligns with the Elliott Wave theory, highlighting a bearish wave setup with 1.1733 as the pivot. Price is expected to approach the lower boundary of the Price Envelope at 1.1586 before possibly bouncing towards the central line at 1.1656.
Key levels:
- Support: 1.1606, 1.1586
- Resistance: 1.1656, 1.1733
USDJPY Forecast – 21 October 2025
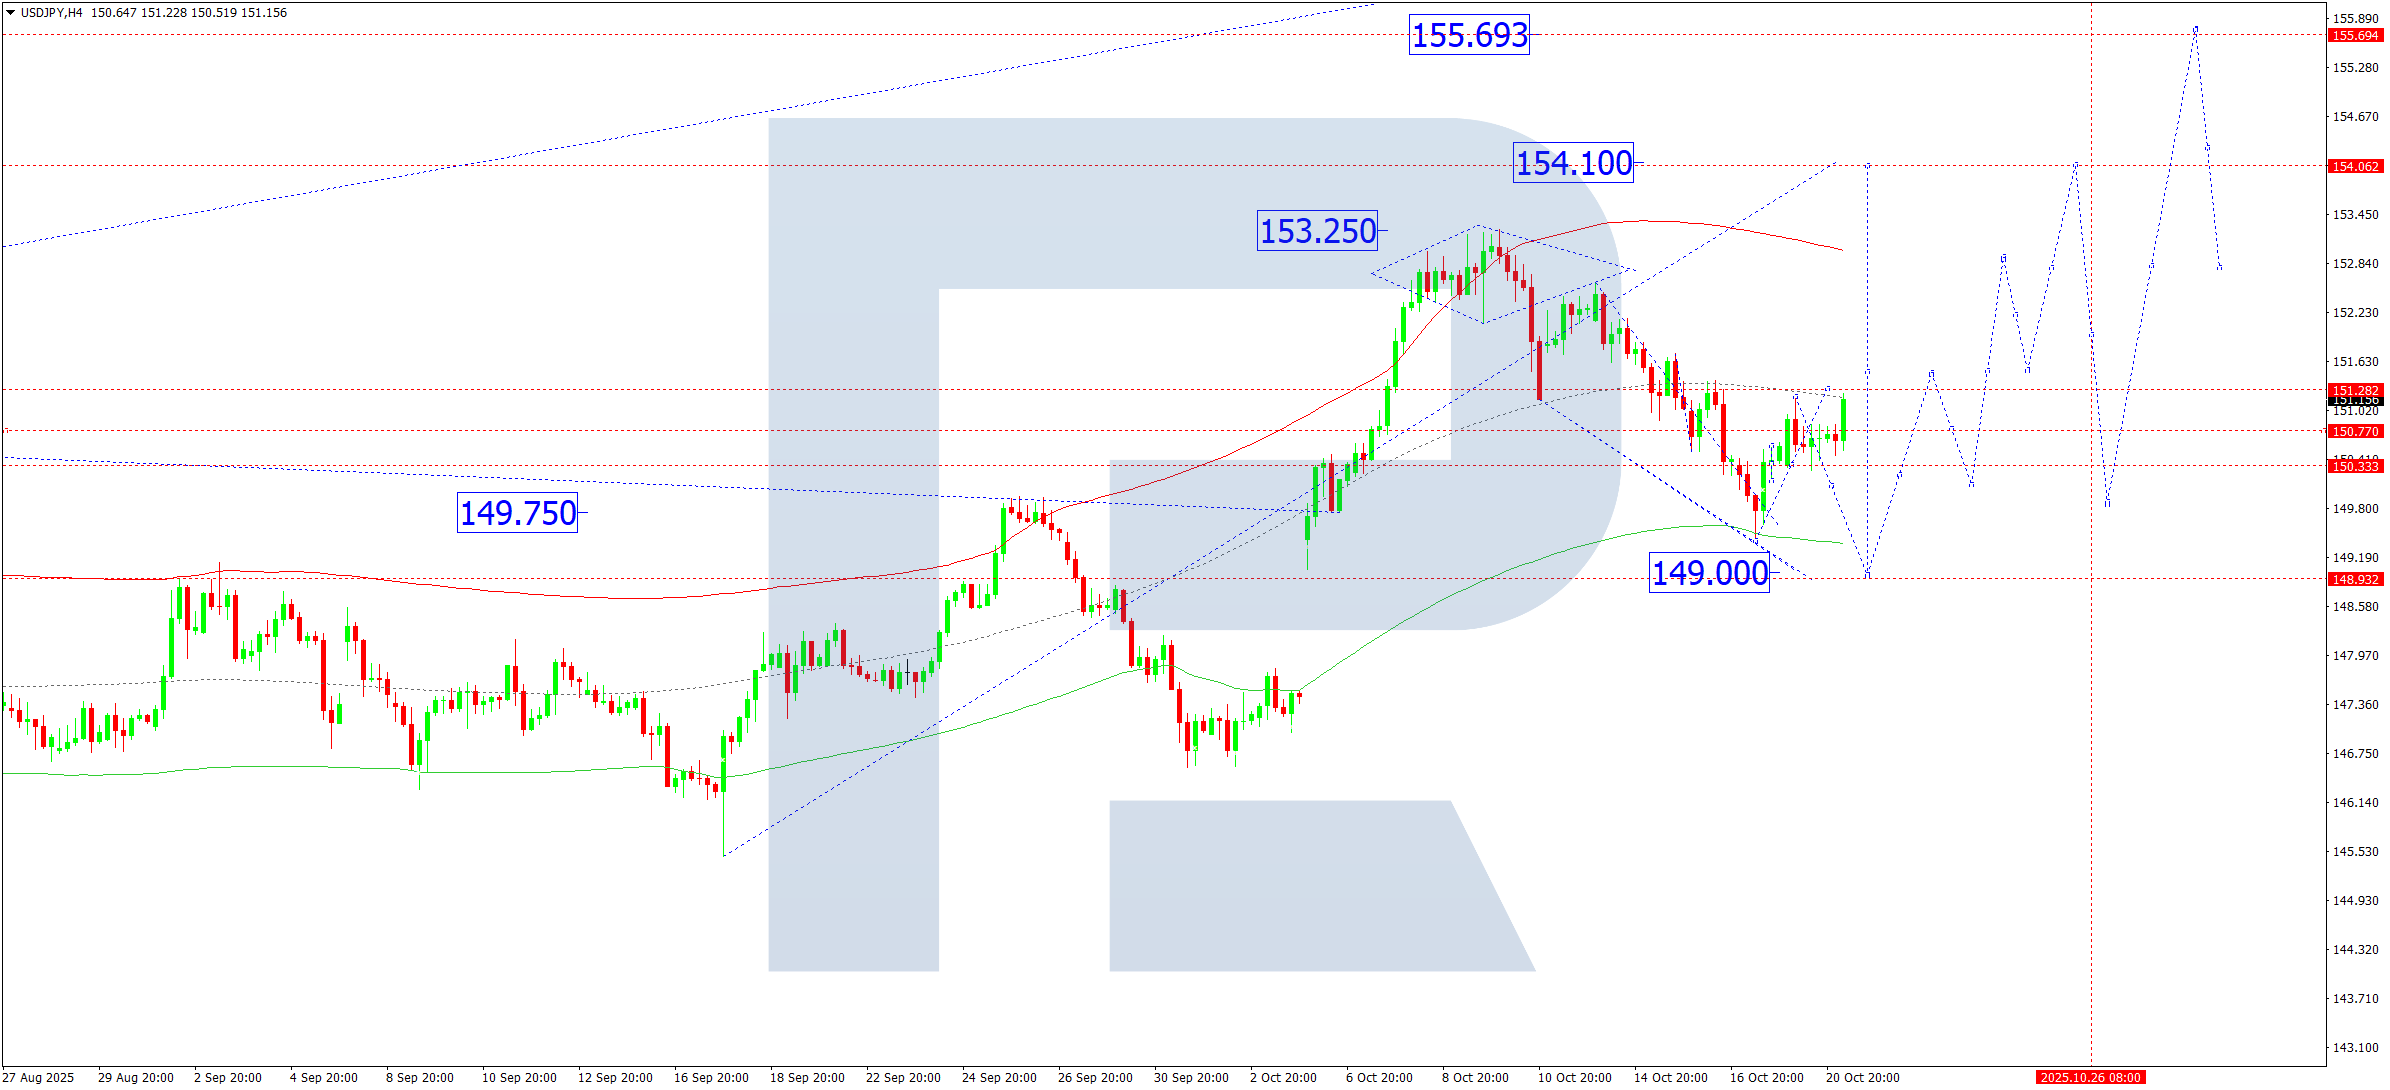
USDJPY formed a consolidation around 150.33 on the H4 chart, with an upward breakout pointing to a continued correction towards 151.30. After reaching this level, a pullback towards 149.00 is possible, completing the correction. From there, a bullish wave could extend to 154.10.
This outlook is supported by a bullish Elliott Wave pattern and wave matrix, with a key pivot at 149.75. A move towards the lower boundary of the Price Envelope at 149.00 is expected before advancing toward 151.10 and the upper limit at 154.10.
Key levels:
- Resistance: 151.30, 154.10
- Support: 149.75, 149.00
GBPUSD Forecast – 21 October 2025
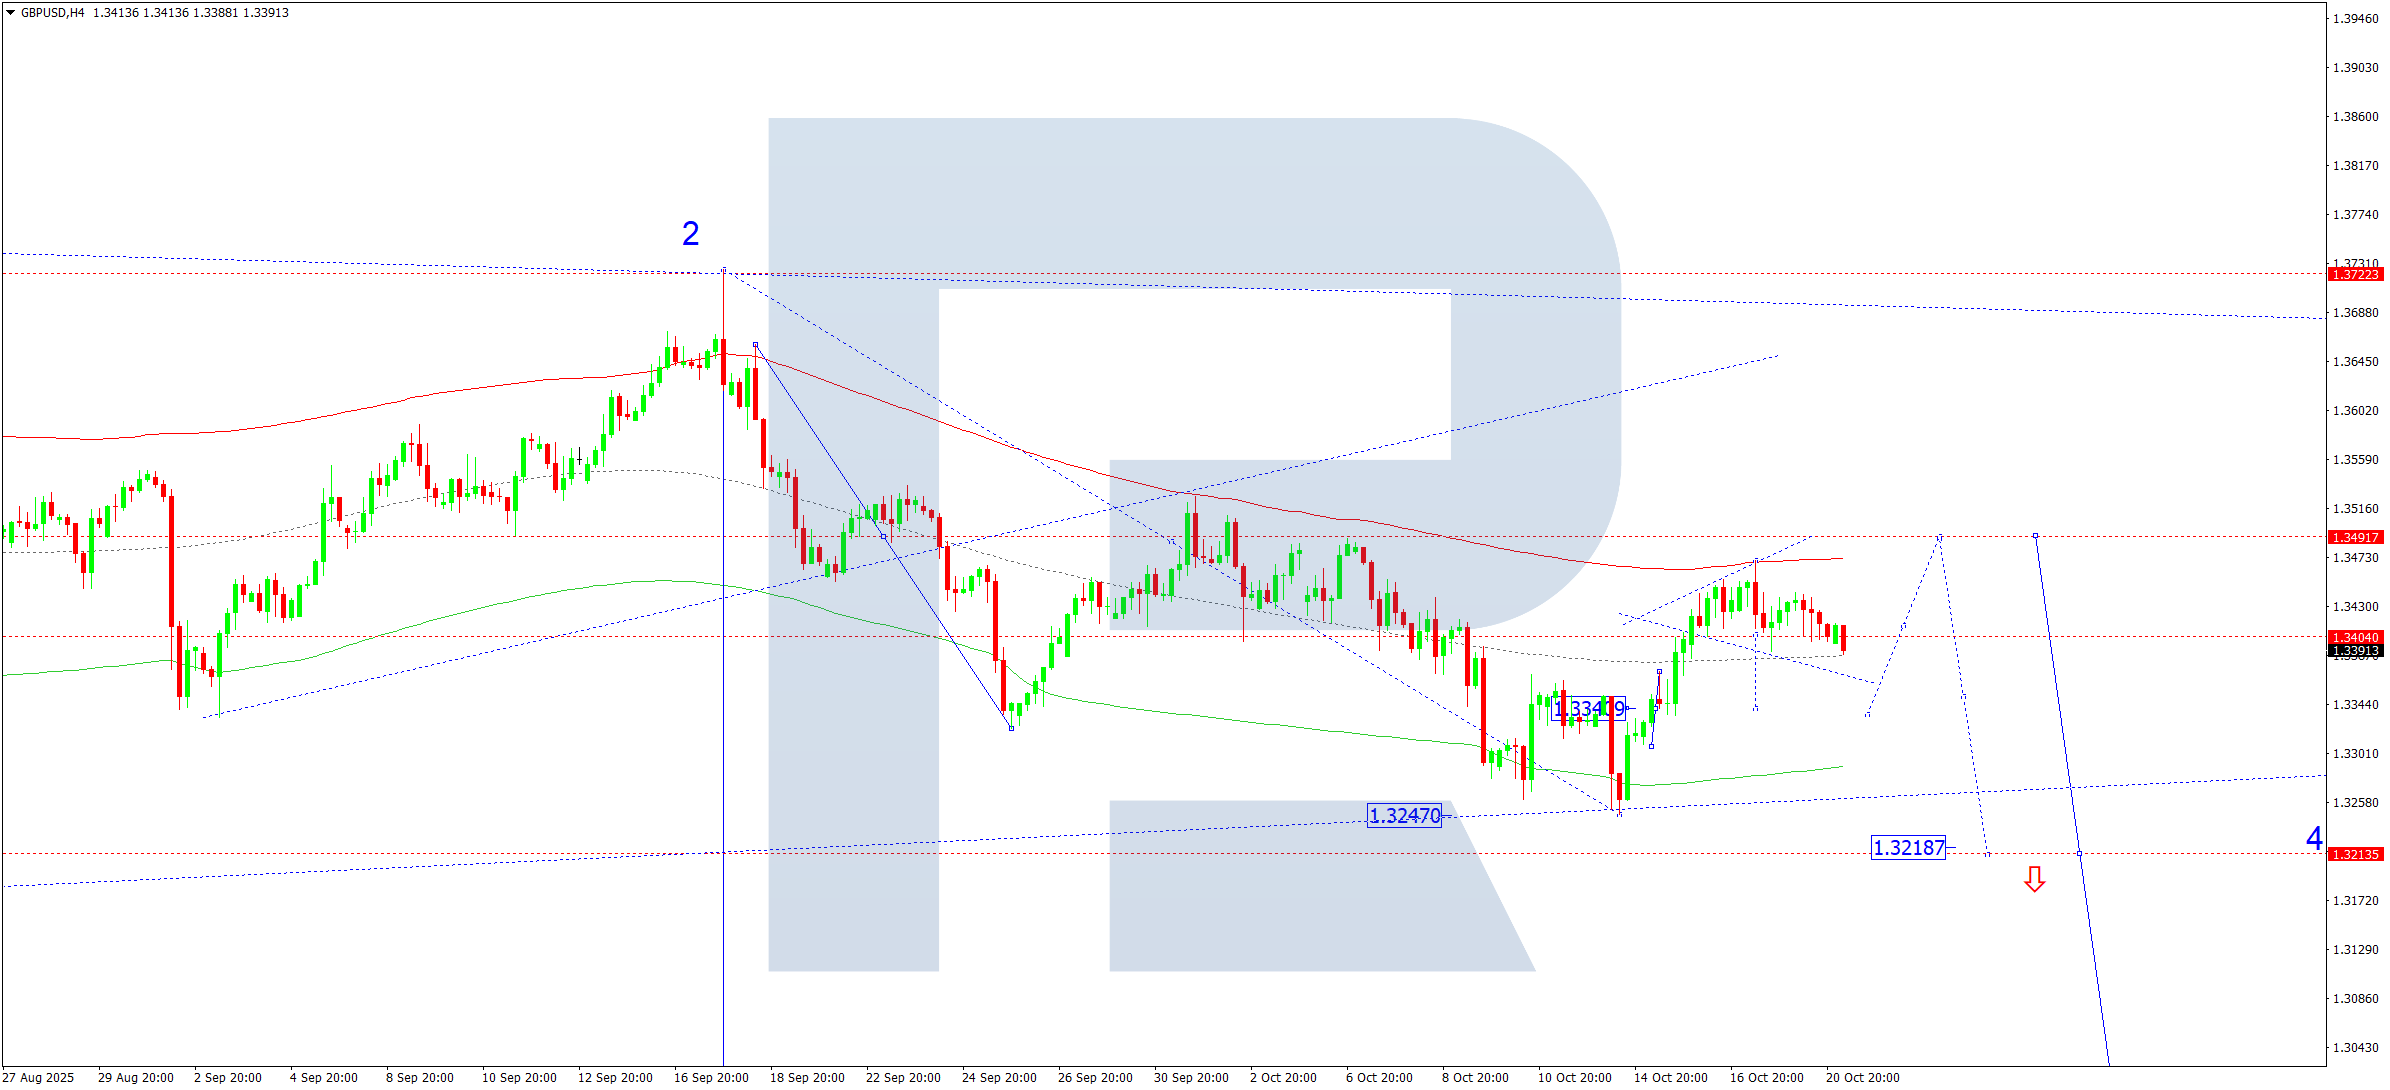
GBPUSD broke down from a consolidation range near 1.3400 on the H4 timeframe. Today’s outlook suggests a decline to 1.3340, followed by a potential correction up to 1.3490, before a further downward move towards 1.3218.
This projection is based on a bearish Elliott Wave structure, with a critical pivot at 1.3490. Price is moving away from the central line of the Price Envelope and may test its lower boundary before rebounding briefly.
Key levels:
- Support: 1.3340, 1.3218
- Resistance: 1.3490
AUDUSD Forecast – 21 October 2025
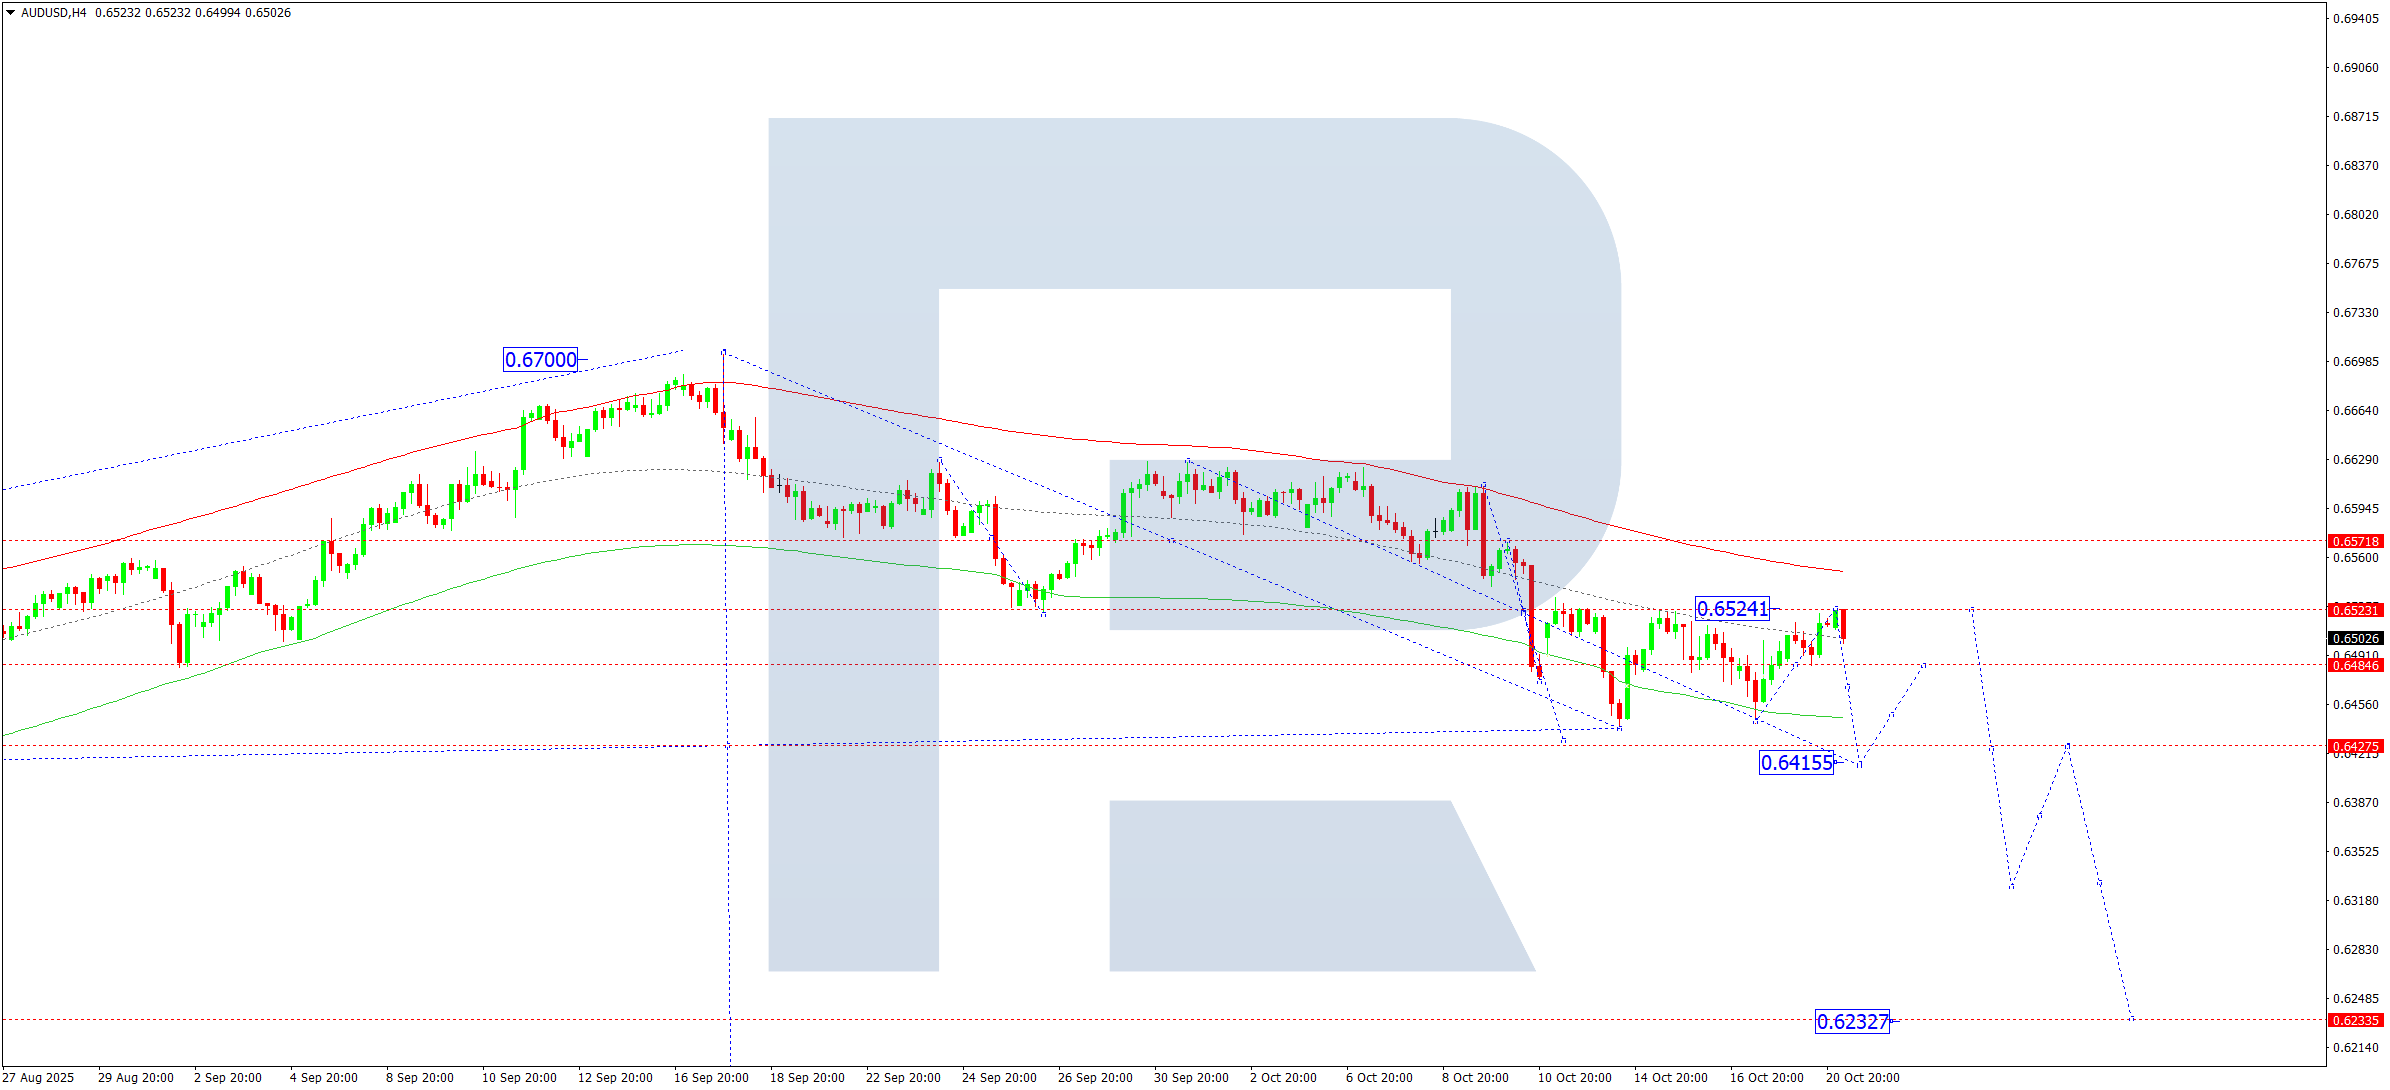
AUDUSD completed a correction to 0.6524 and has since resumed a downward trend, targeting 0.6415. A break below this level could extend the bearish move towards 0.6233.
Elliott Wave analysis supports this bearish scenario, with 0.6620 as the key pivot. The pair previously tested the Price Envelope’s lower boundary at 0.6440 and corrected to the central line at 0.6524. A move back to the lower boundary at 0.6415 is anticipated.
Key levels:
- Support: 0.6415, 0.6233
- Resistance: 0.6524, 0.6620
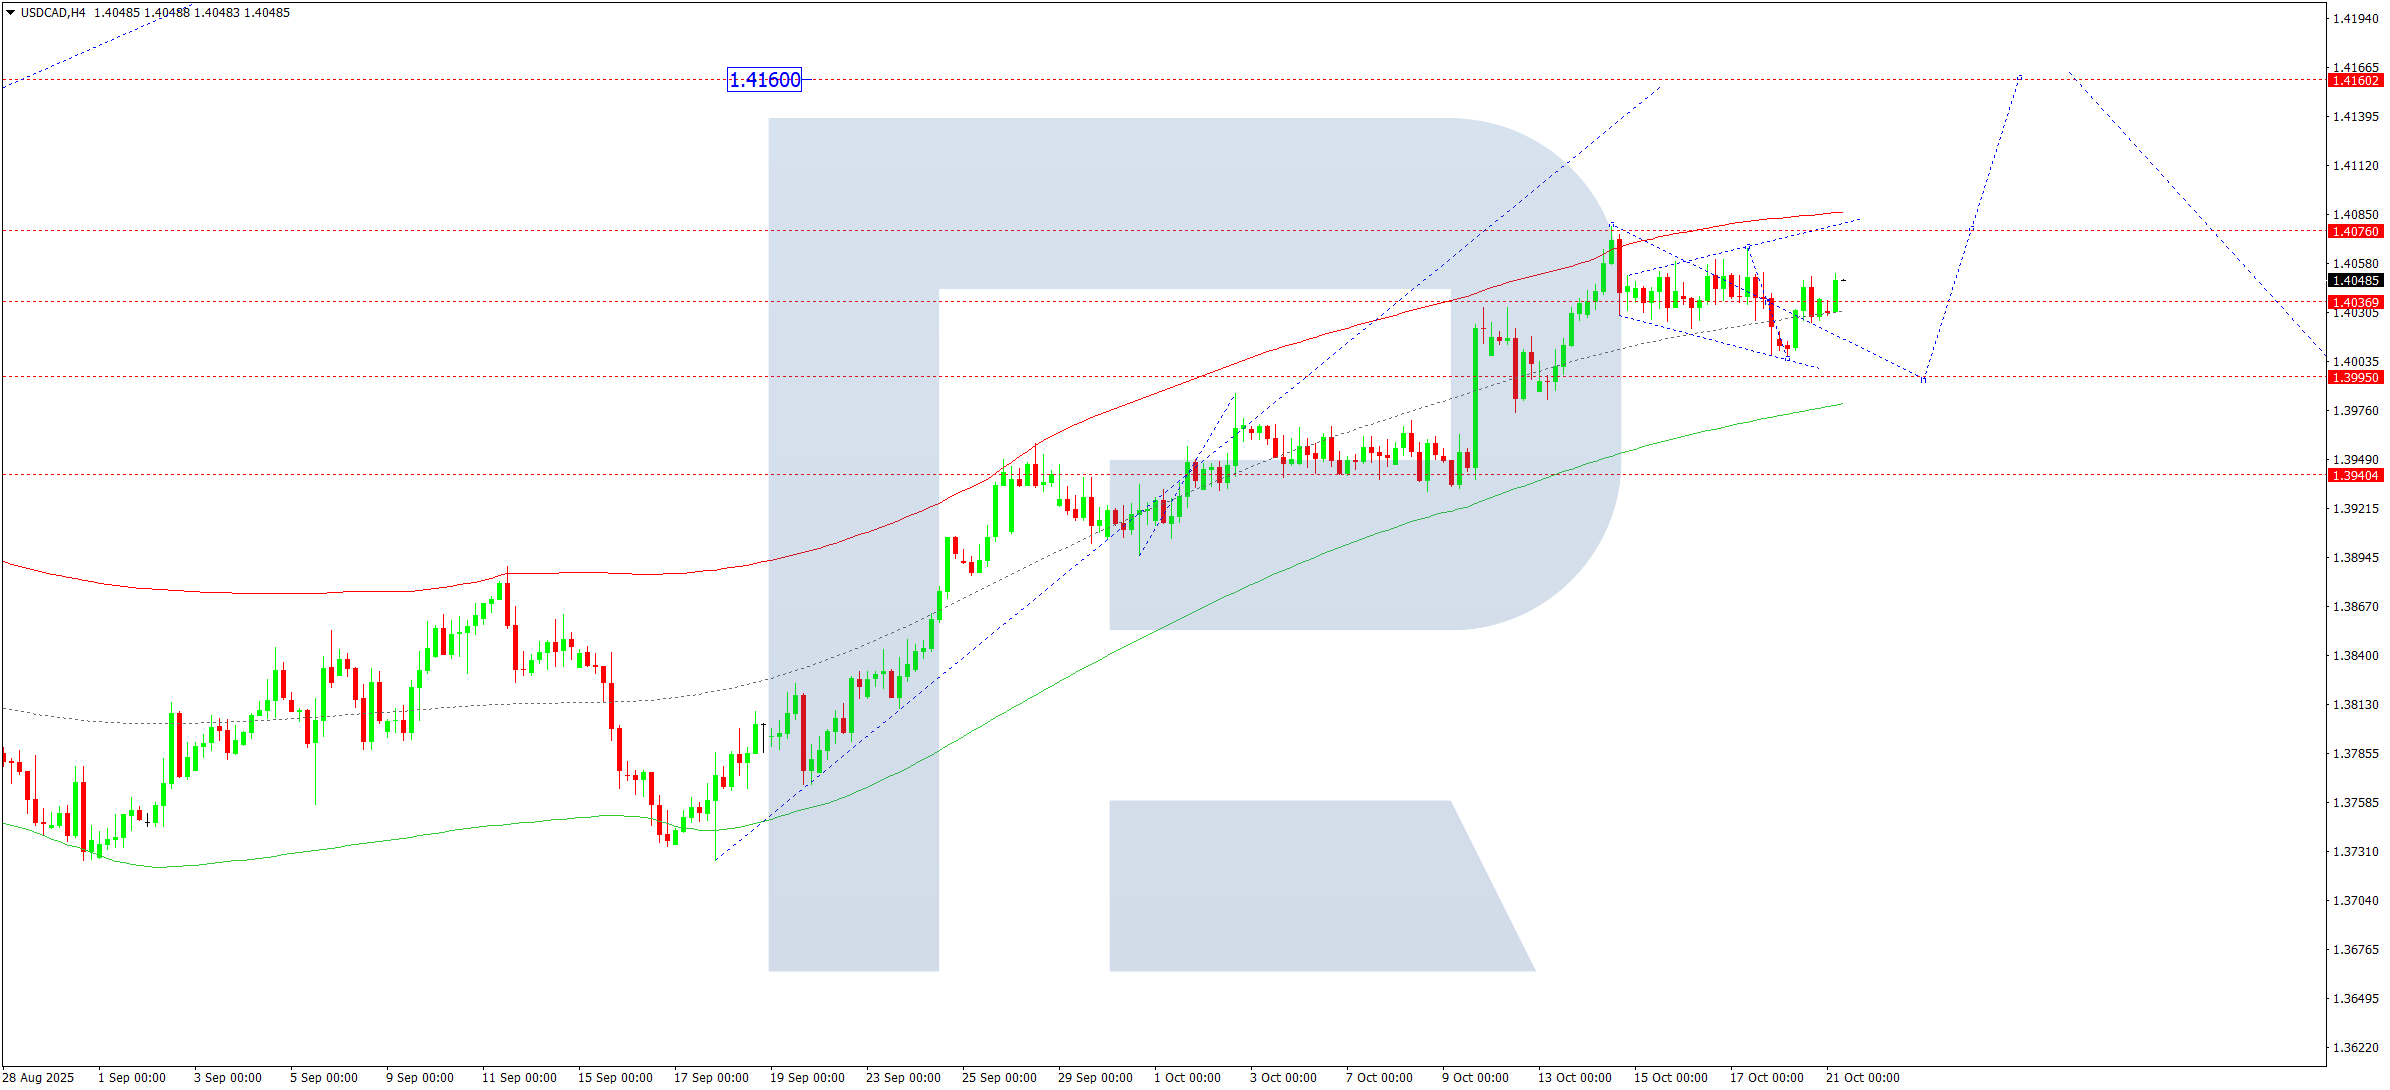
USDCAD Forecast – 21 October 2025
USDCAD continues to consolidate near 1.4035 on the H4 chart. An upward extension towards 1.4076 is likely today, with a possible pullback to 1.3995. If 1.4076 is broken, the bullish trend could extend to 1.4160.
The Elliott Wave structure and wave matrix suggest a bullish outlook, with 1.3940 as a critical pivot. The pair is eyeing the Price Envelope’s upper boundary at 1.4160, potentially followed by a corrective pullback to 1.3940.
Key levels:
- Resistance: 1.4076, 1.4160
- Support: 1.3995, 1.3940
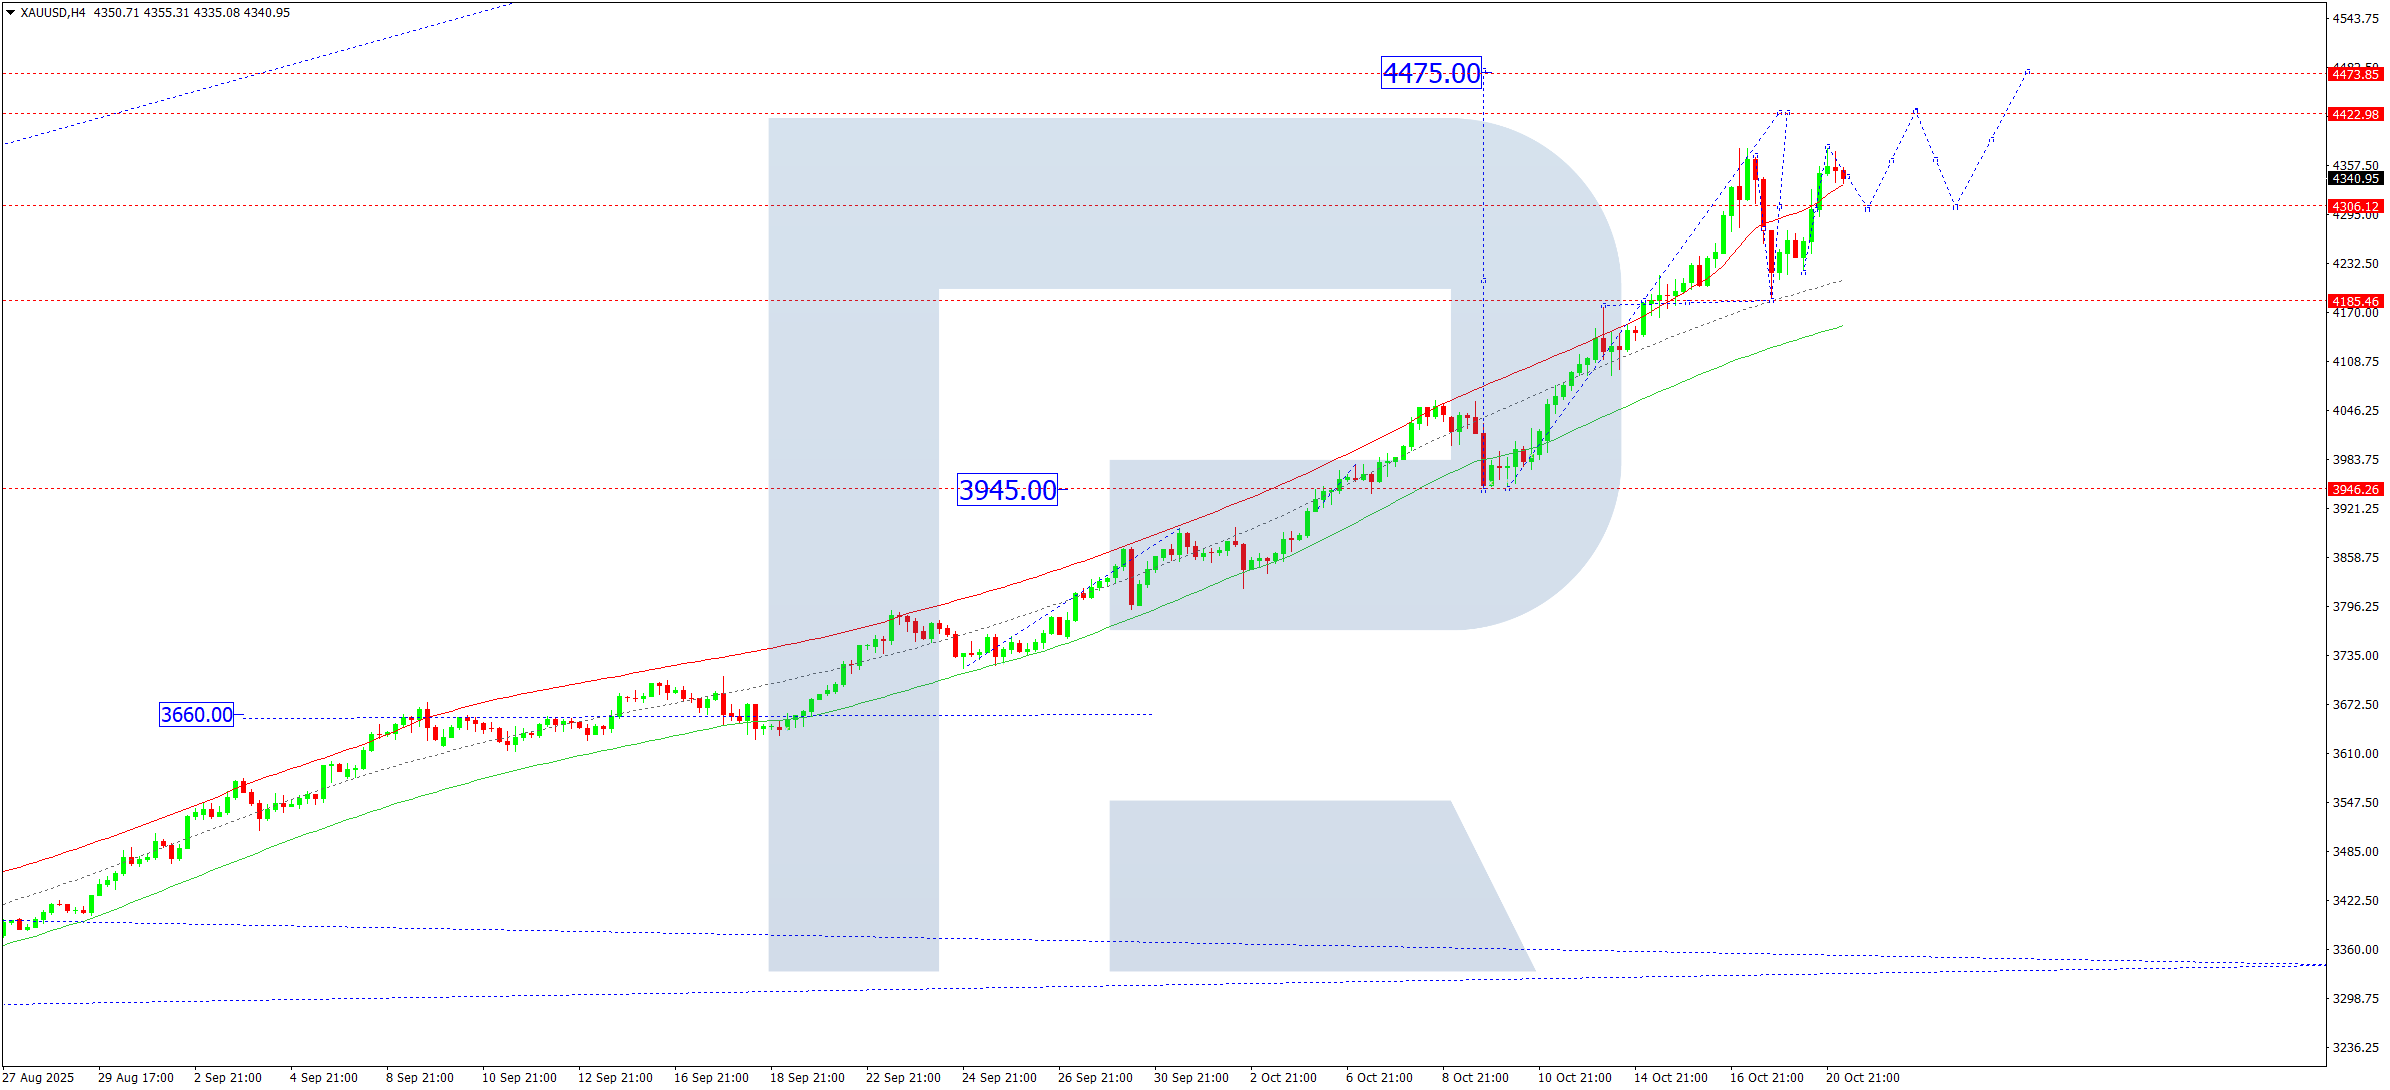
XAUUSD (Gold) Forecast – 21 October 2025
Gold (XAUUSD) is consolidating around 4,306 on the H4 chart. A breakout to the upside may trigger a move toward 4,422, with potential to extend to 4,475. If the price breaks downward instead, a correction to 4,170 is likely.
The bullish wave matrix aligns with the Elliott Wave perspective, identifying 3,660 as a long-term pivot. Gold may continue trending toward the Price Envelope’s upper boundary at 4,475 before entering a corrective phase.
Key levels:
- Resistance: 4,422, 4,475
- Support: 4,306, 4,170
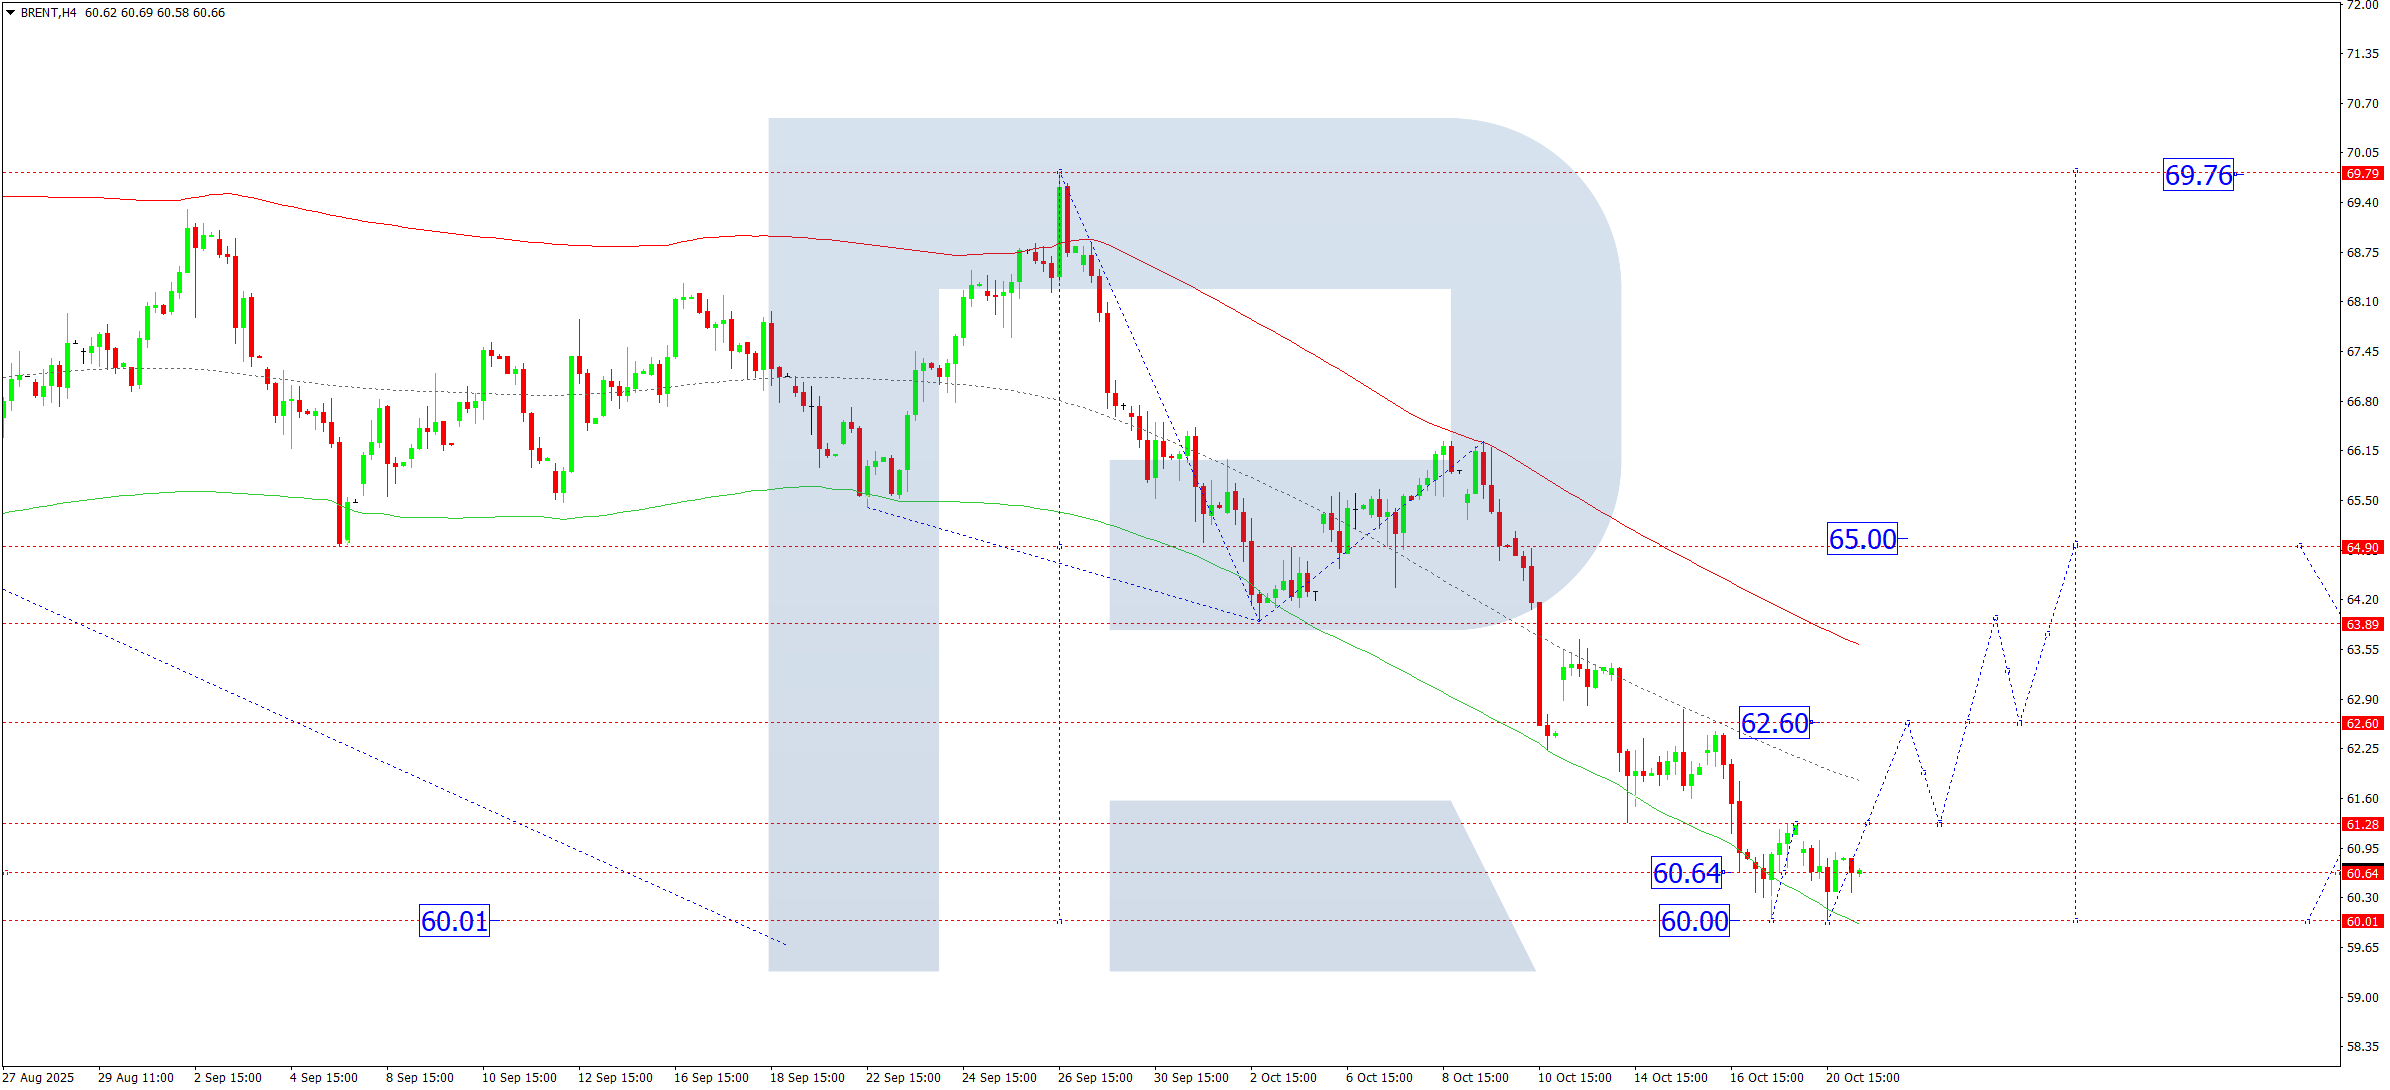
Brent Crude Oil Forecast – 21 October 2025
Brent crude rallied to 61.28 and then pulled back to 60.00, forming a consolidation band around 60.64. A breakout to the upside could lead to a move toward 62.60, and further to 65.00. Conversely, a break below the range could send the price down to 59.00, before a new bullish wave emerges toward 65.00.
This structure is consistent with Elliott Wave analysis, with 65.65 as the key pivot. Price has tested the lower boundary of the Price Envelope at 60.00, with the upper target at 65.00 in focus.
Key levels:
- Resistance: 62.60, 65.00
- Support: 60.00, 59.00
Disclaimer:
Past performance is not indicative of future results. All forecasts and analyses provided herein are for informational purposes only and should not be considered financial advice. Always conduct your own research or consult a financial advisor before making trading decisions.
Leave a Reply