
Daily Technical Analysis and Forecast — 27 October 2025
EURUSD Forecast
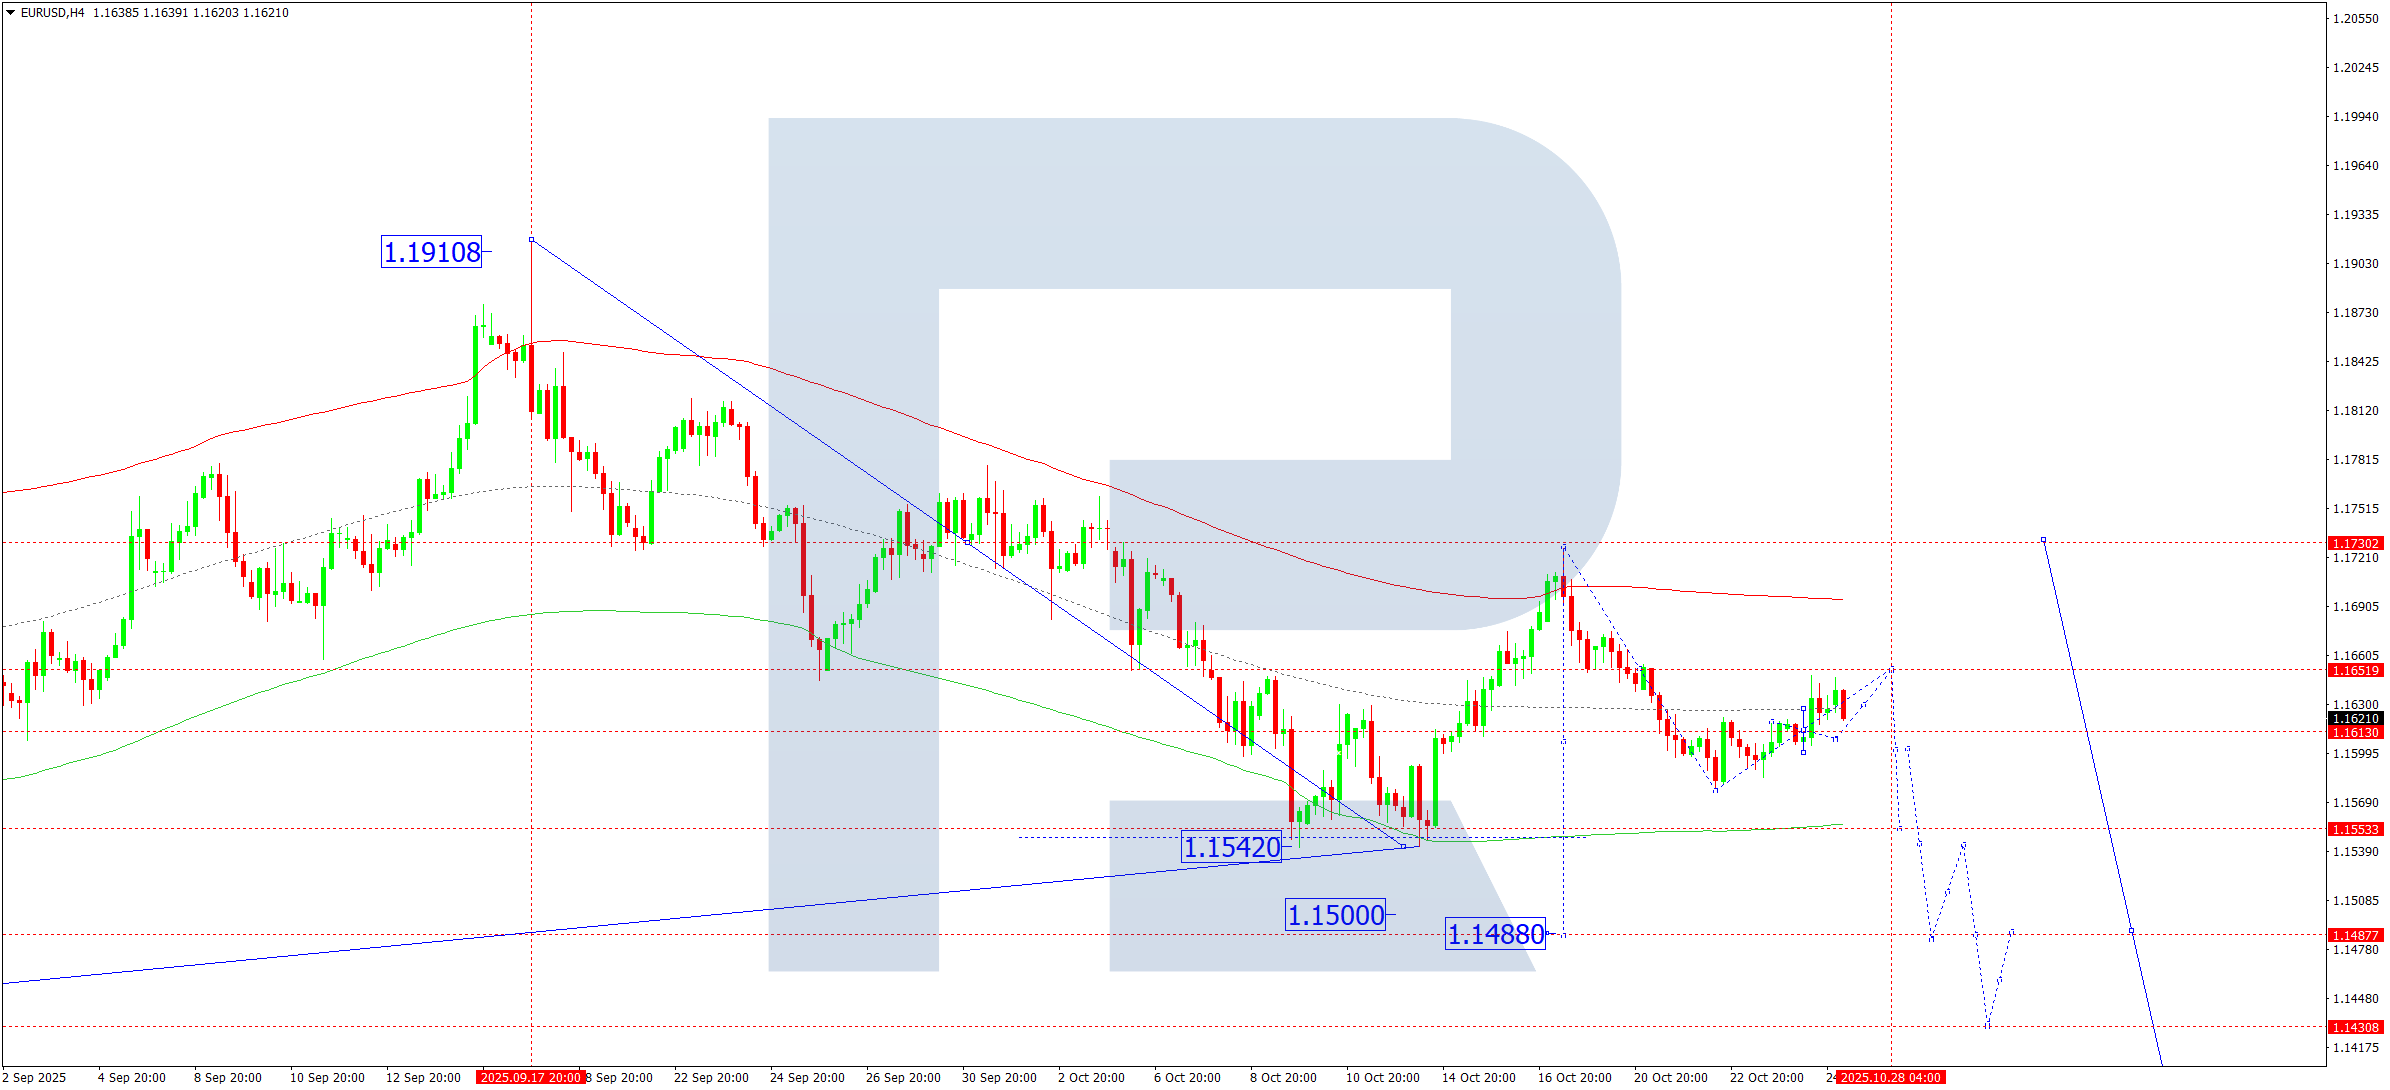
On the H4 chart, EURUSD continues to trade within a tight consolidation range around 1.1604, which has recently expanded towards 1.1647. On 27 October 2025, the pair is expected to decline towards 1.1600, followed by a potential upward correction to 1.1651, where the corrective phase may complete. Afterward, a decline towards 1.1533 is likely, and a breakout below this level could open the way for a continuation of the bearish wave towards 1.1488.
The Elliott Wave structure and the bearish wave matrix support this scenario, with a key pivot level located at 1.1730. Price action is expected to move towards the lower boundary of the Price Envelope near 1.1533, followed by a possible rebound to its median line around 1.1600.
Outlook: Technical indicators point to a likely decline towards 1.1533.
USDJPY Forecast
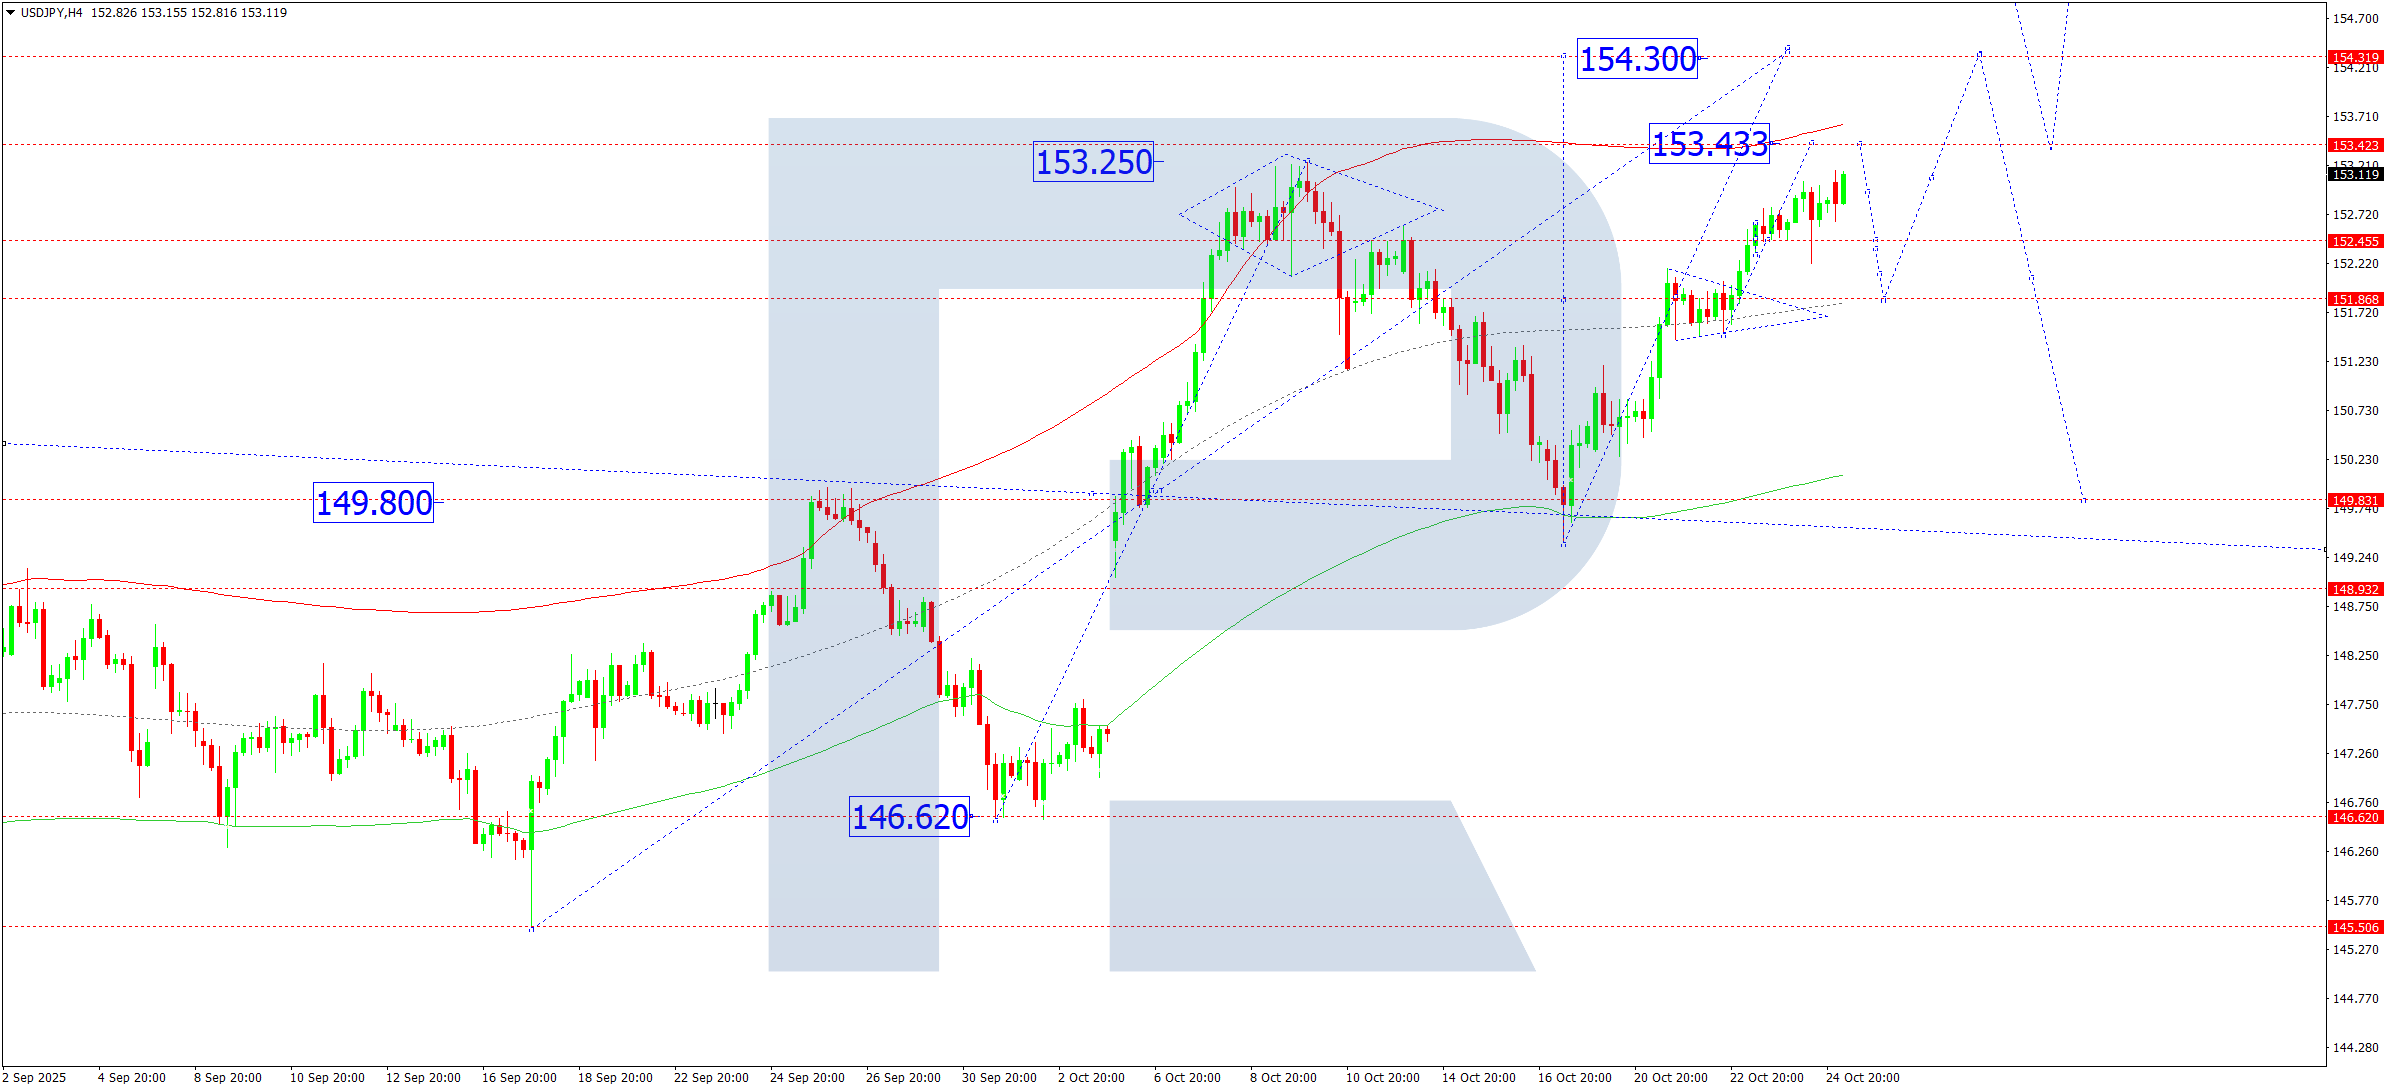
On the H4 chart, USDJPY maintains its upward trajectory toward 153.43. The pair is expected to reach this level today, after which a correction to 152.45 may develop before resuming its advance toward the next local target at 154.30.
The Elliott Wave structure and bullish wave matrix confirm this outlook, with the main pivot level at 149.80. The market has consolidated near the Price Envelope’s central line at 151.88 and is now expanding toward the upper boundary at 154.30.
Outlook: Indicators suggest potential growth towards 154.33.
GBPUSD Forecast
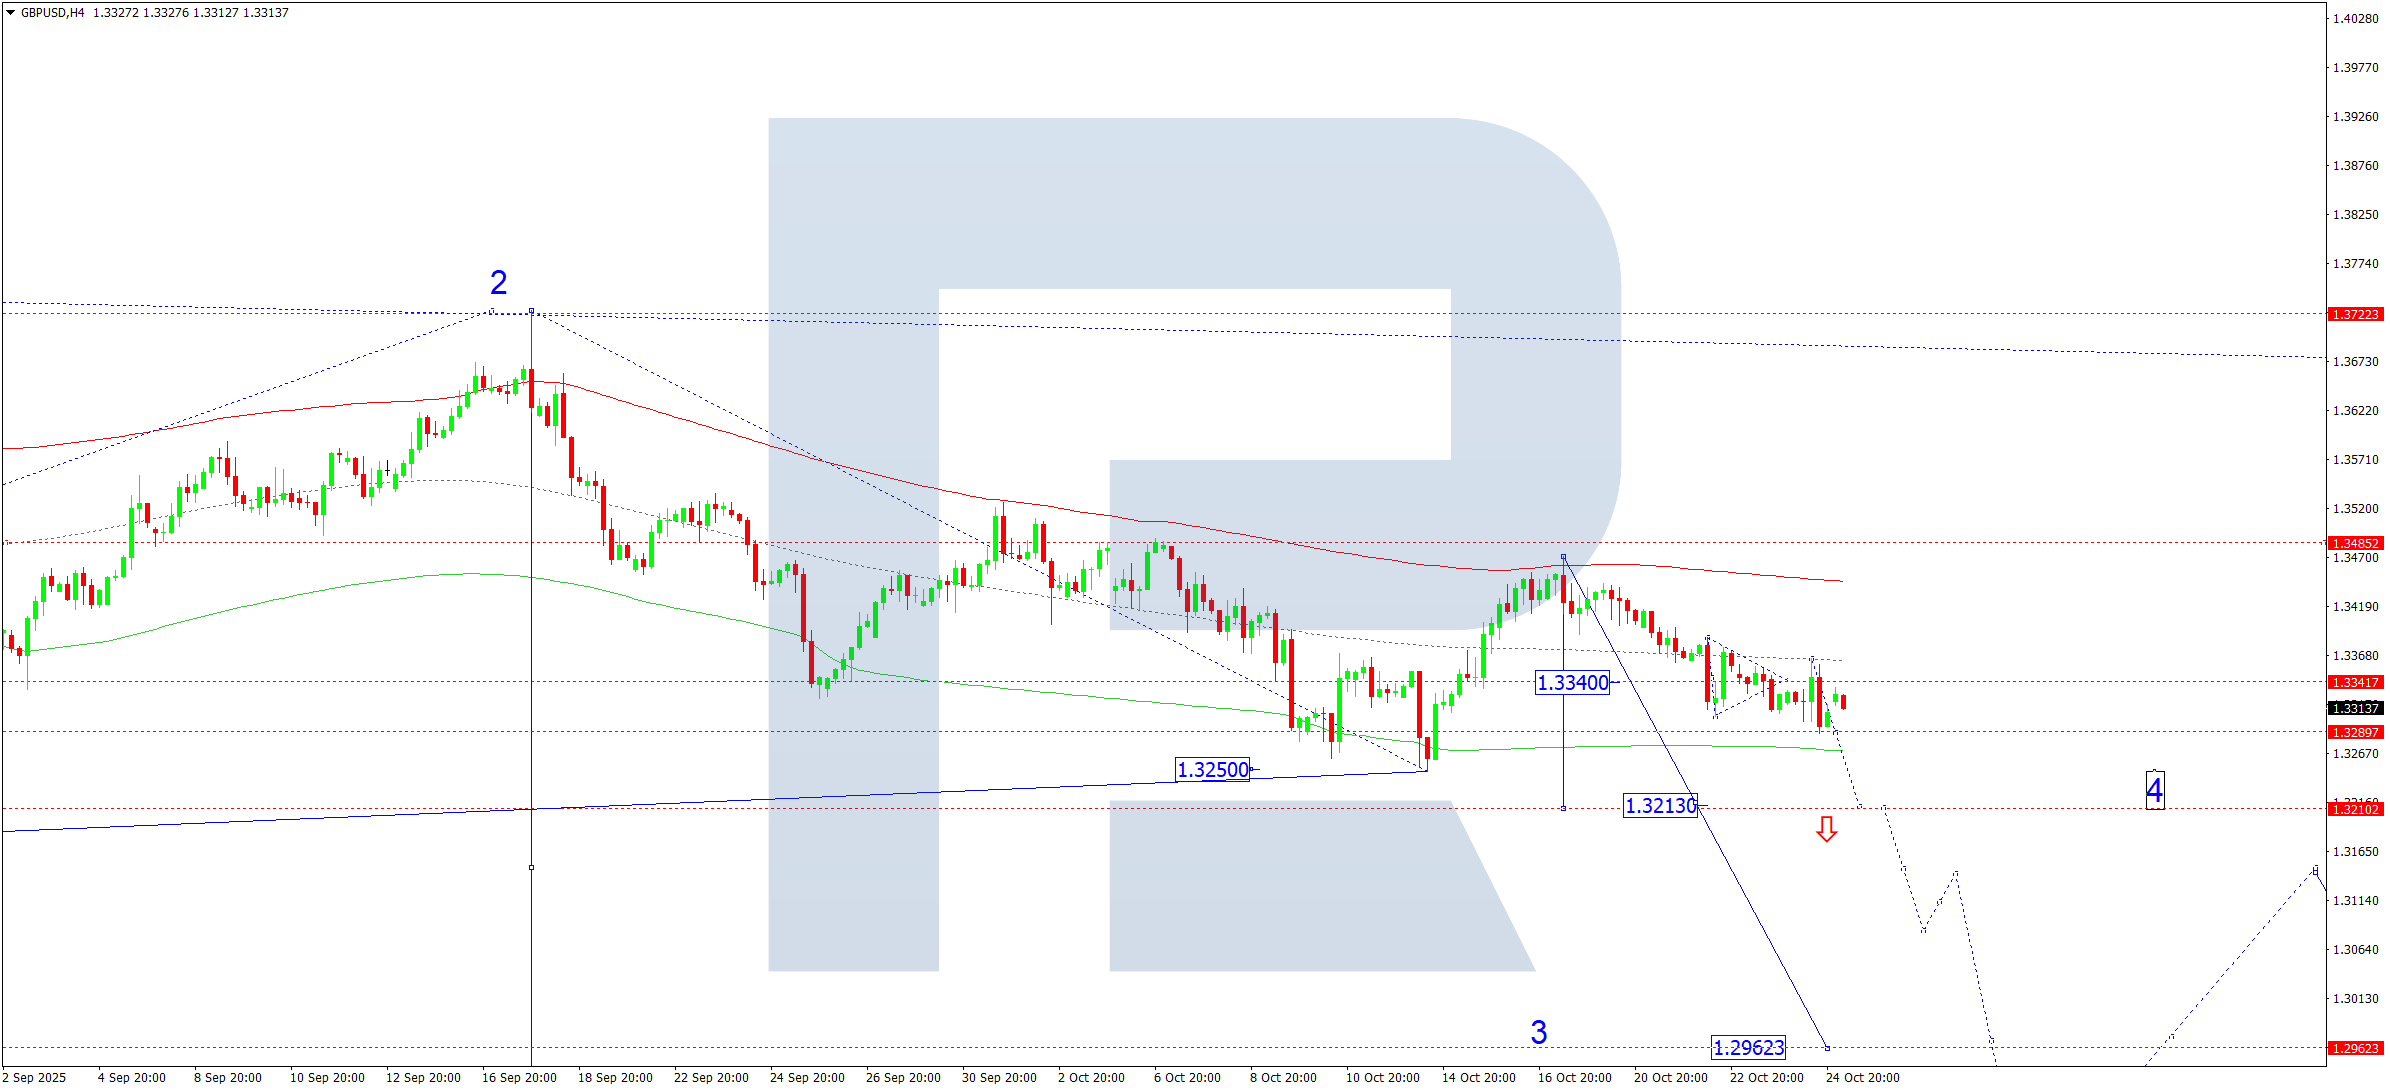
On the H4 chart, GBPUSD remains in a consolidation phase around 1.3340. A breakout to the upside could initiate a correction toward 1.3400, while a downside breakout would likely resume the third wave of the broader downtrend, targeting 1.3213 initially and potentially extending to 1.2962 as the main objective.
The Elliott Wave and bearish wave matrix support this bearish continuation scenario, with the key pivot level set at 1.3490. The pair is fluctuating around the Price Envelope’s central line at 1.3340, and a move below this area may lead to a drop toward the lower boundary at 1.3213.
Outlook: Indicators favor a decline towards 1.3213.
AUDUSD Forecast
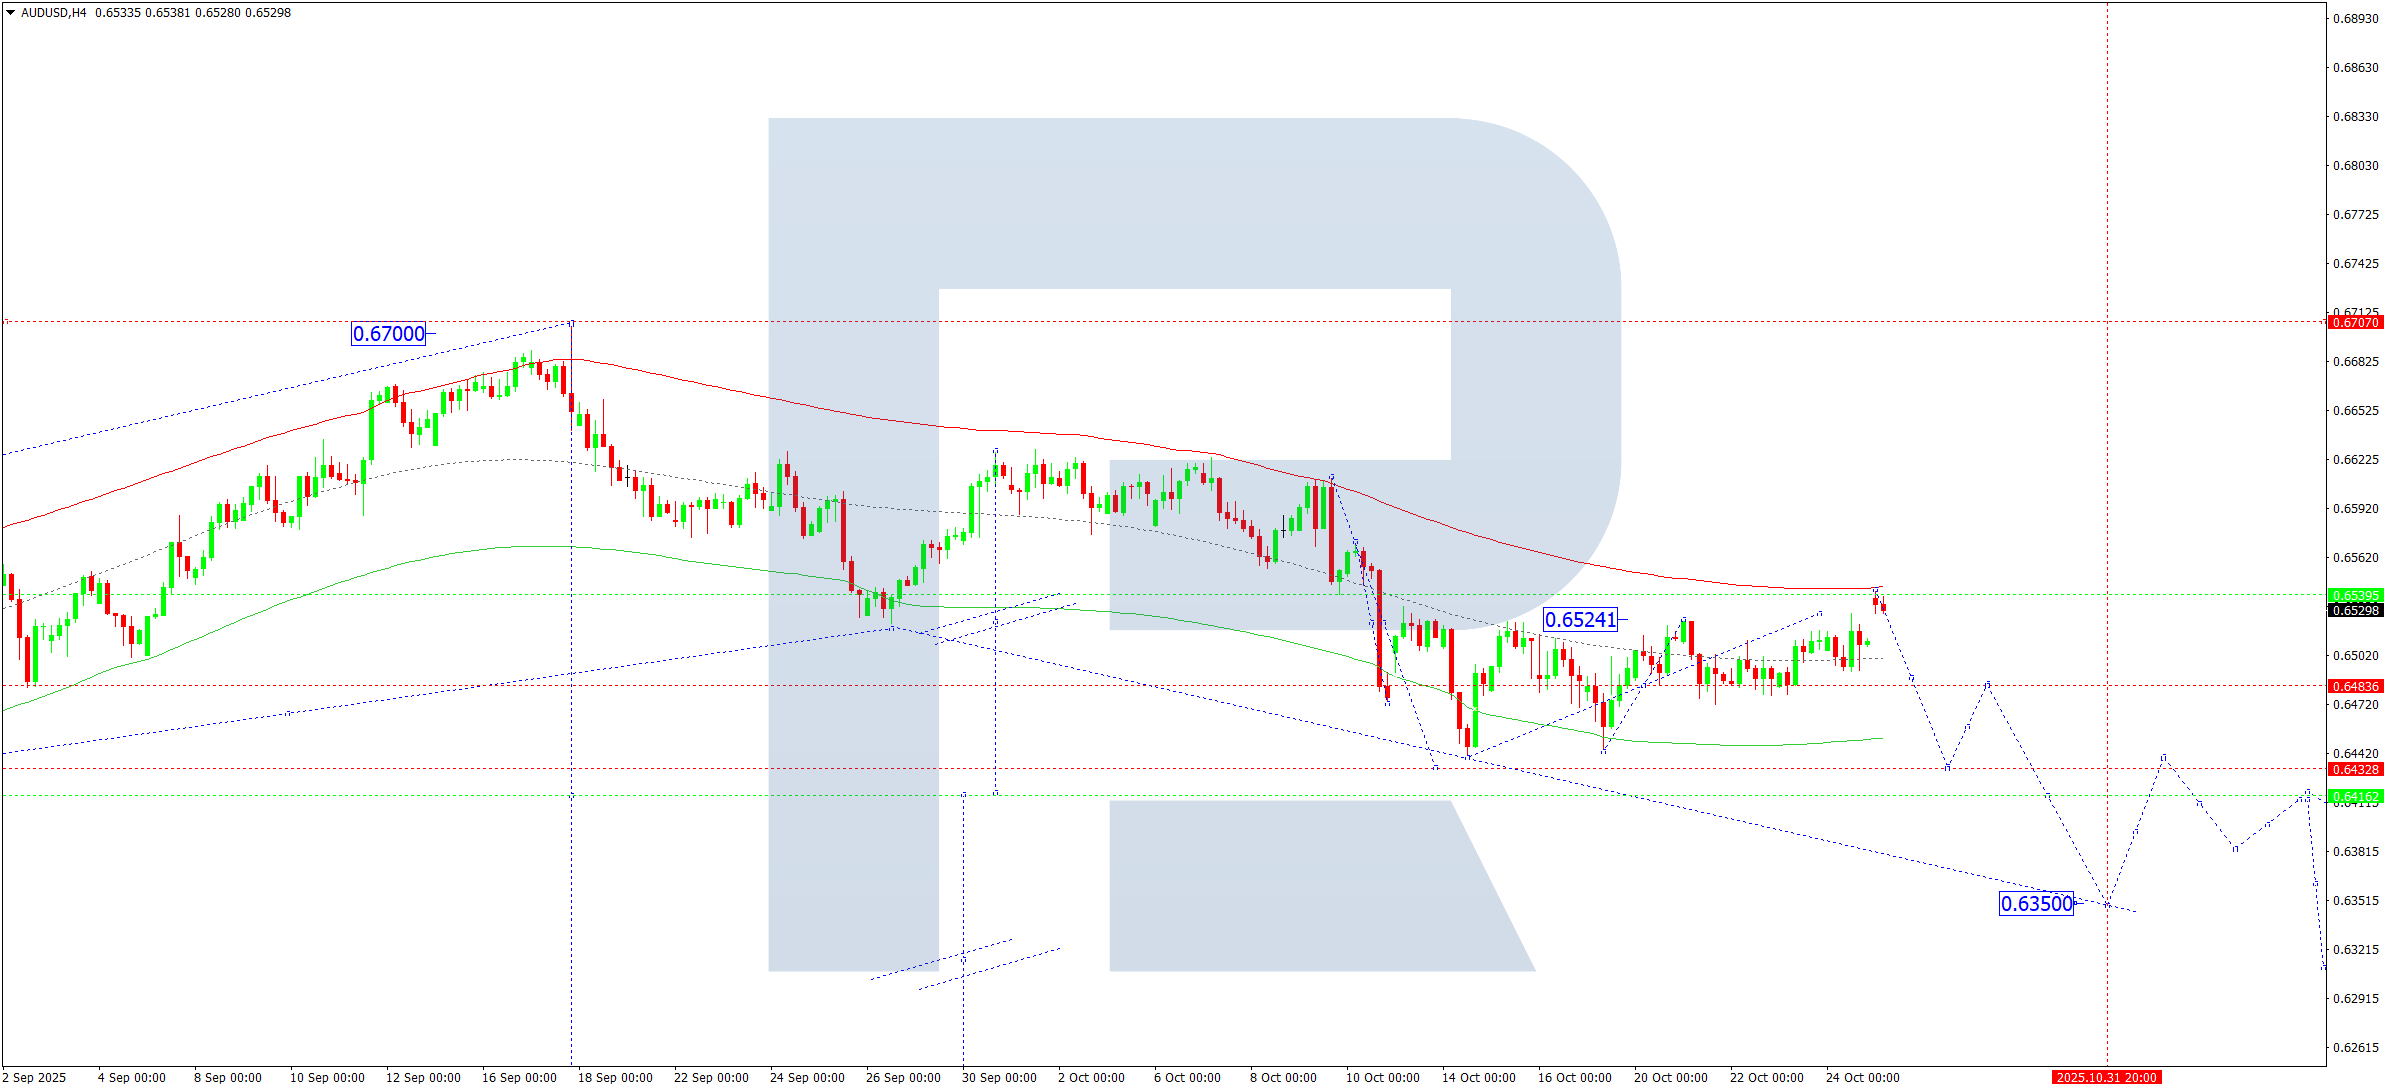
On the H4 chart, AUDUSD has expanded its consolidation to 0.6542. A decline toward 0.6484 is expected today, and a break below this level could extend the downward move to 0.6432, with the possibility of further losses toward 0.6350.
The Elliott Wave structure and bearish wave matrix confirm this scenario, with a key pivot point at 0.6525. The pair recently completed a correction near the Price Envelope’s upper boundary at 0.6542 and now appears poised for a drop toward the lower boundary at 0.6432.
Outlook: Indicators signal the beginning of a downward wave targeting 0.6432.
USDCAD Forecast
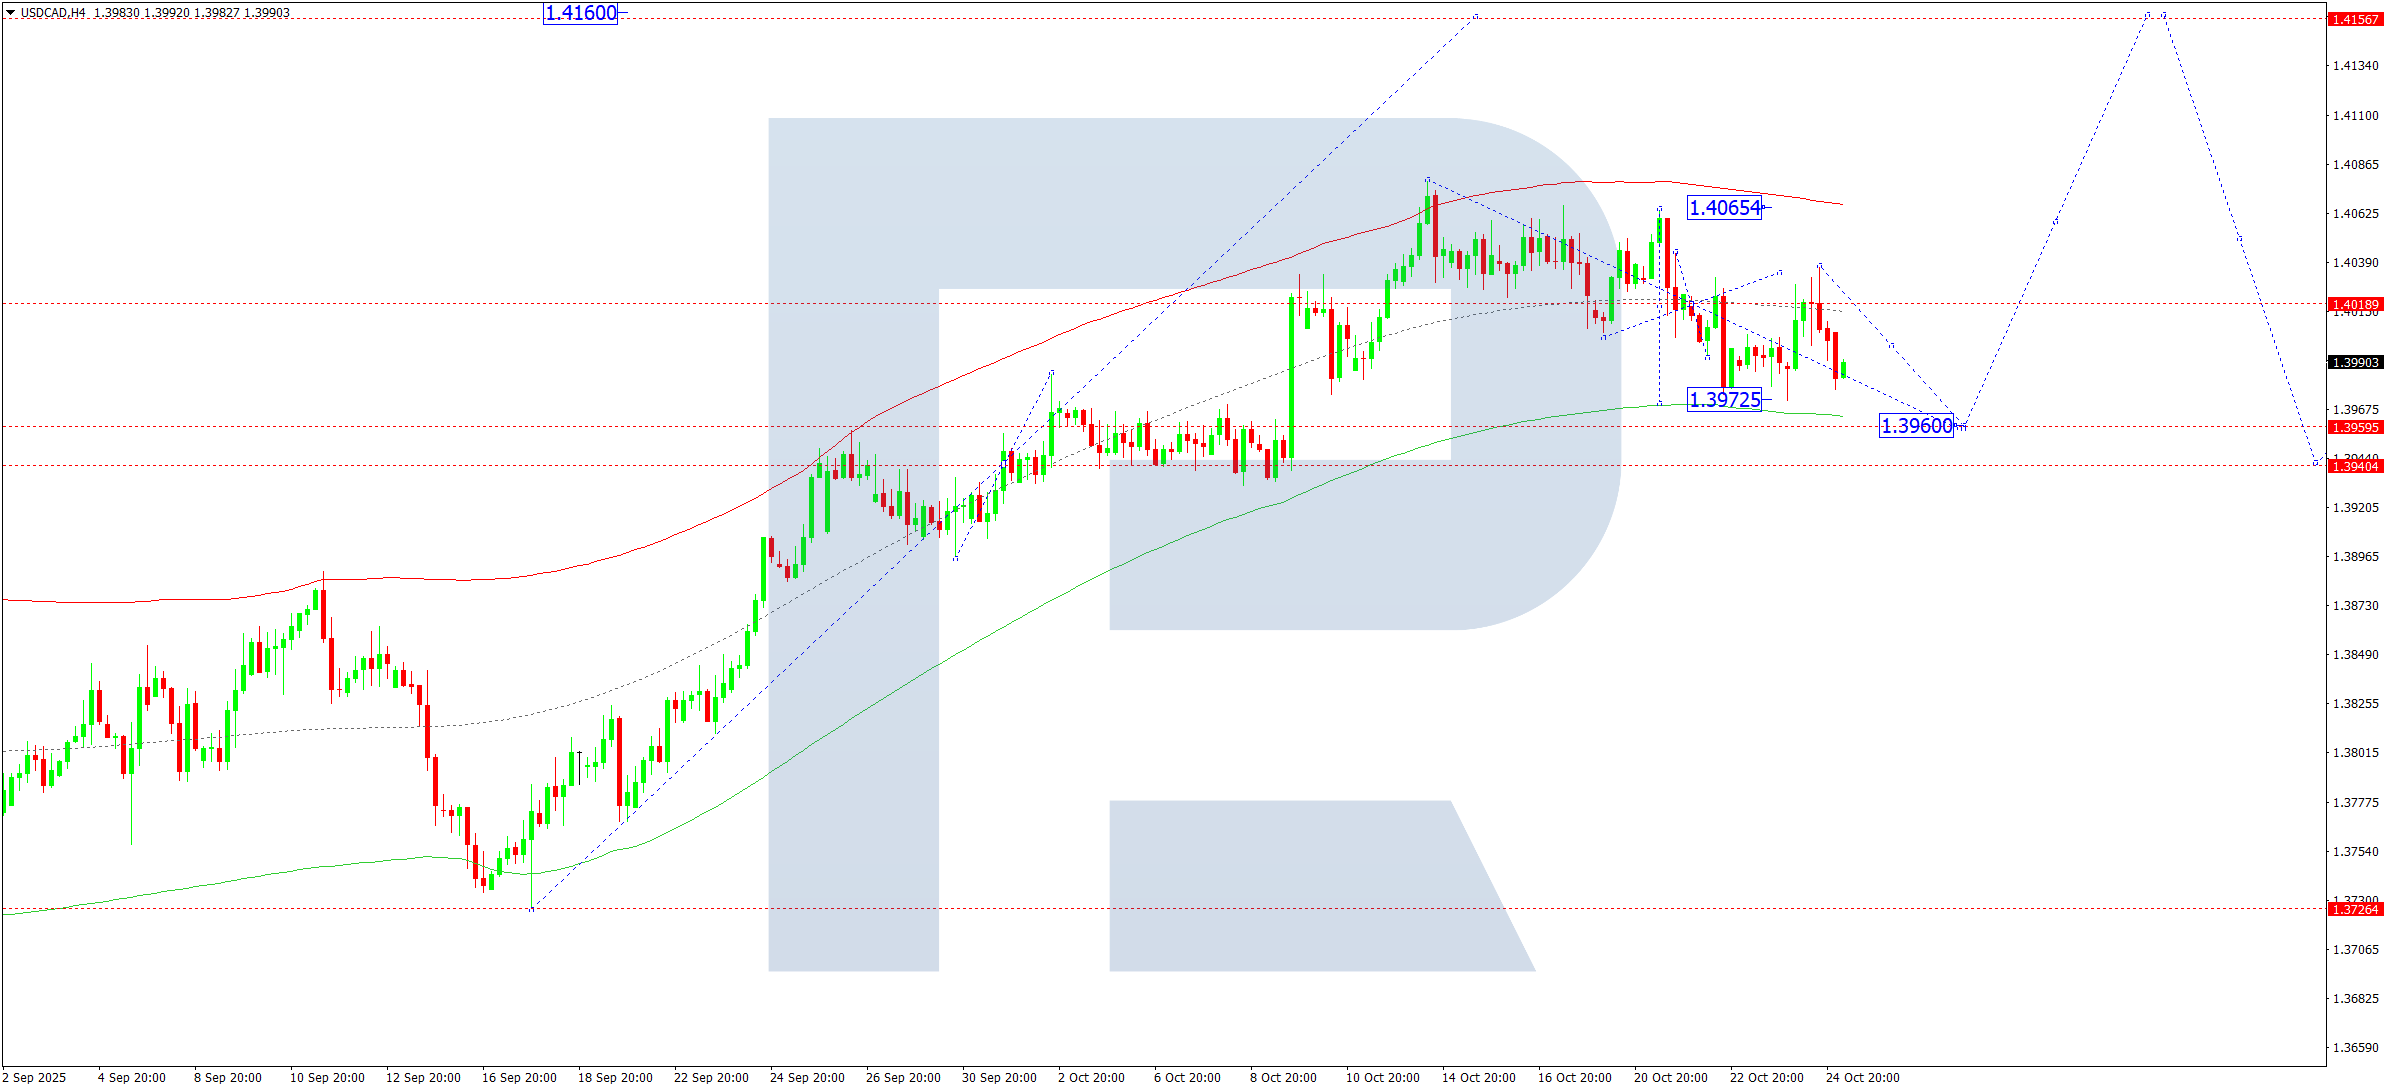
On the H4 chart, USDCAD continues to consolidate around 1.4019. A short-term decline towards 1.3960 may occur, followed by a rebound to 1.4070. A breakout above this level would open the path for further upside toward 1.4160, the next local target.
This scenario aligns with the Elliott Wave structure and bullish wave matrix, anchored by a key pivot at 1.3940. The market is forming a corrective pattern towards the Price Envelope’s lower boundary at 1.3960, with an expected rebound to 1.4070. A break above that resistance could confirm an upward continuation towards 1.4160.
Outlook: Indicators suggest a possible continuation of the uptrend toward 1.4070 and 1.4160.
XAUUSD (Gold) Forecast
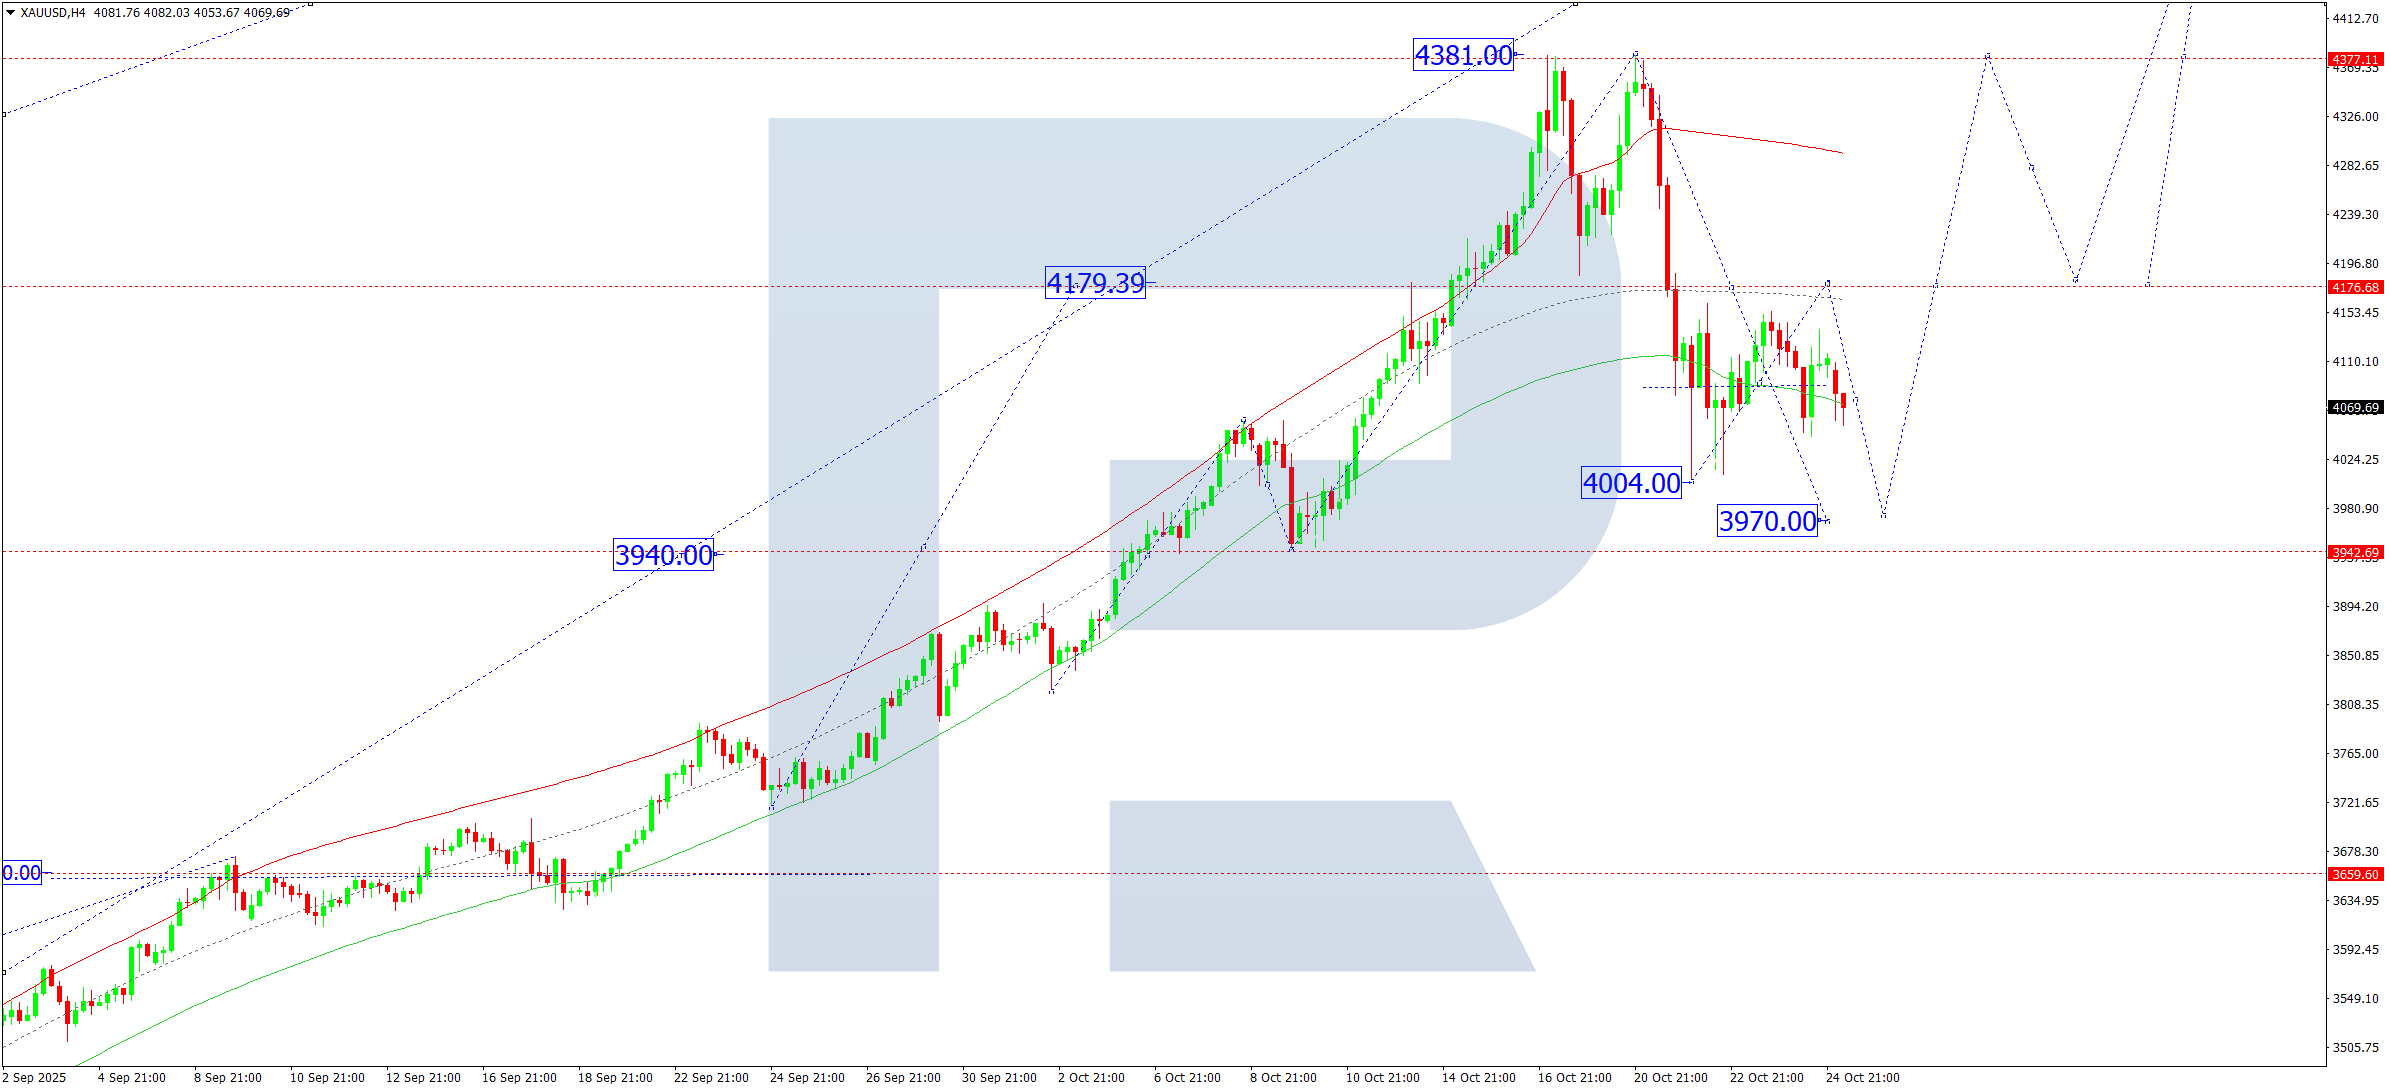
On the H4 chart, XAUUSD remains in consolidation around 4,090. The trading range may extend upwards to 4,180 and downwards to 3,970. A downside breakout could initiate a correction towards 3,666, while a breakout above 4,180 would indicate a continuation of the bullish trend toward 4,400.
The Elliott Wave and bullish wave matrix support this scenario, with a key pivot at 3,660. The metal is currently shaping a correction toward the lower boundary of the Price Envelope at 3,970, from which a renewed rise to 4,400 could develop.
Outlook: Indicators point to a short-term correction toward 3,970.
Brent Crude Forecast
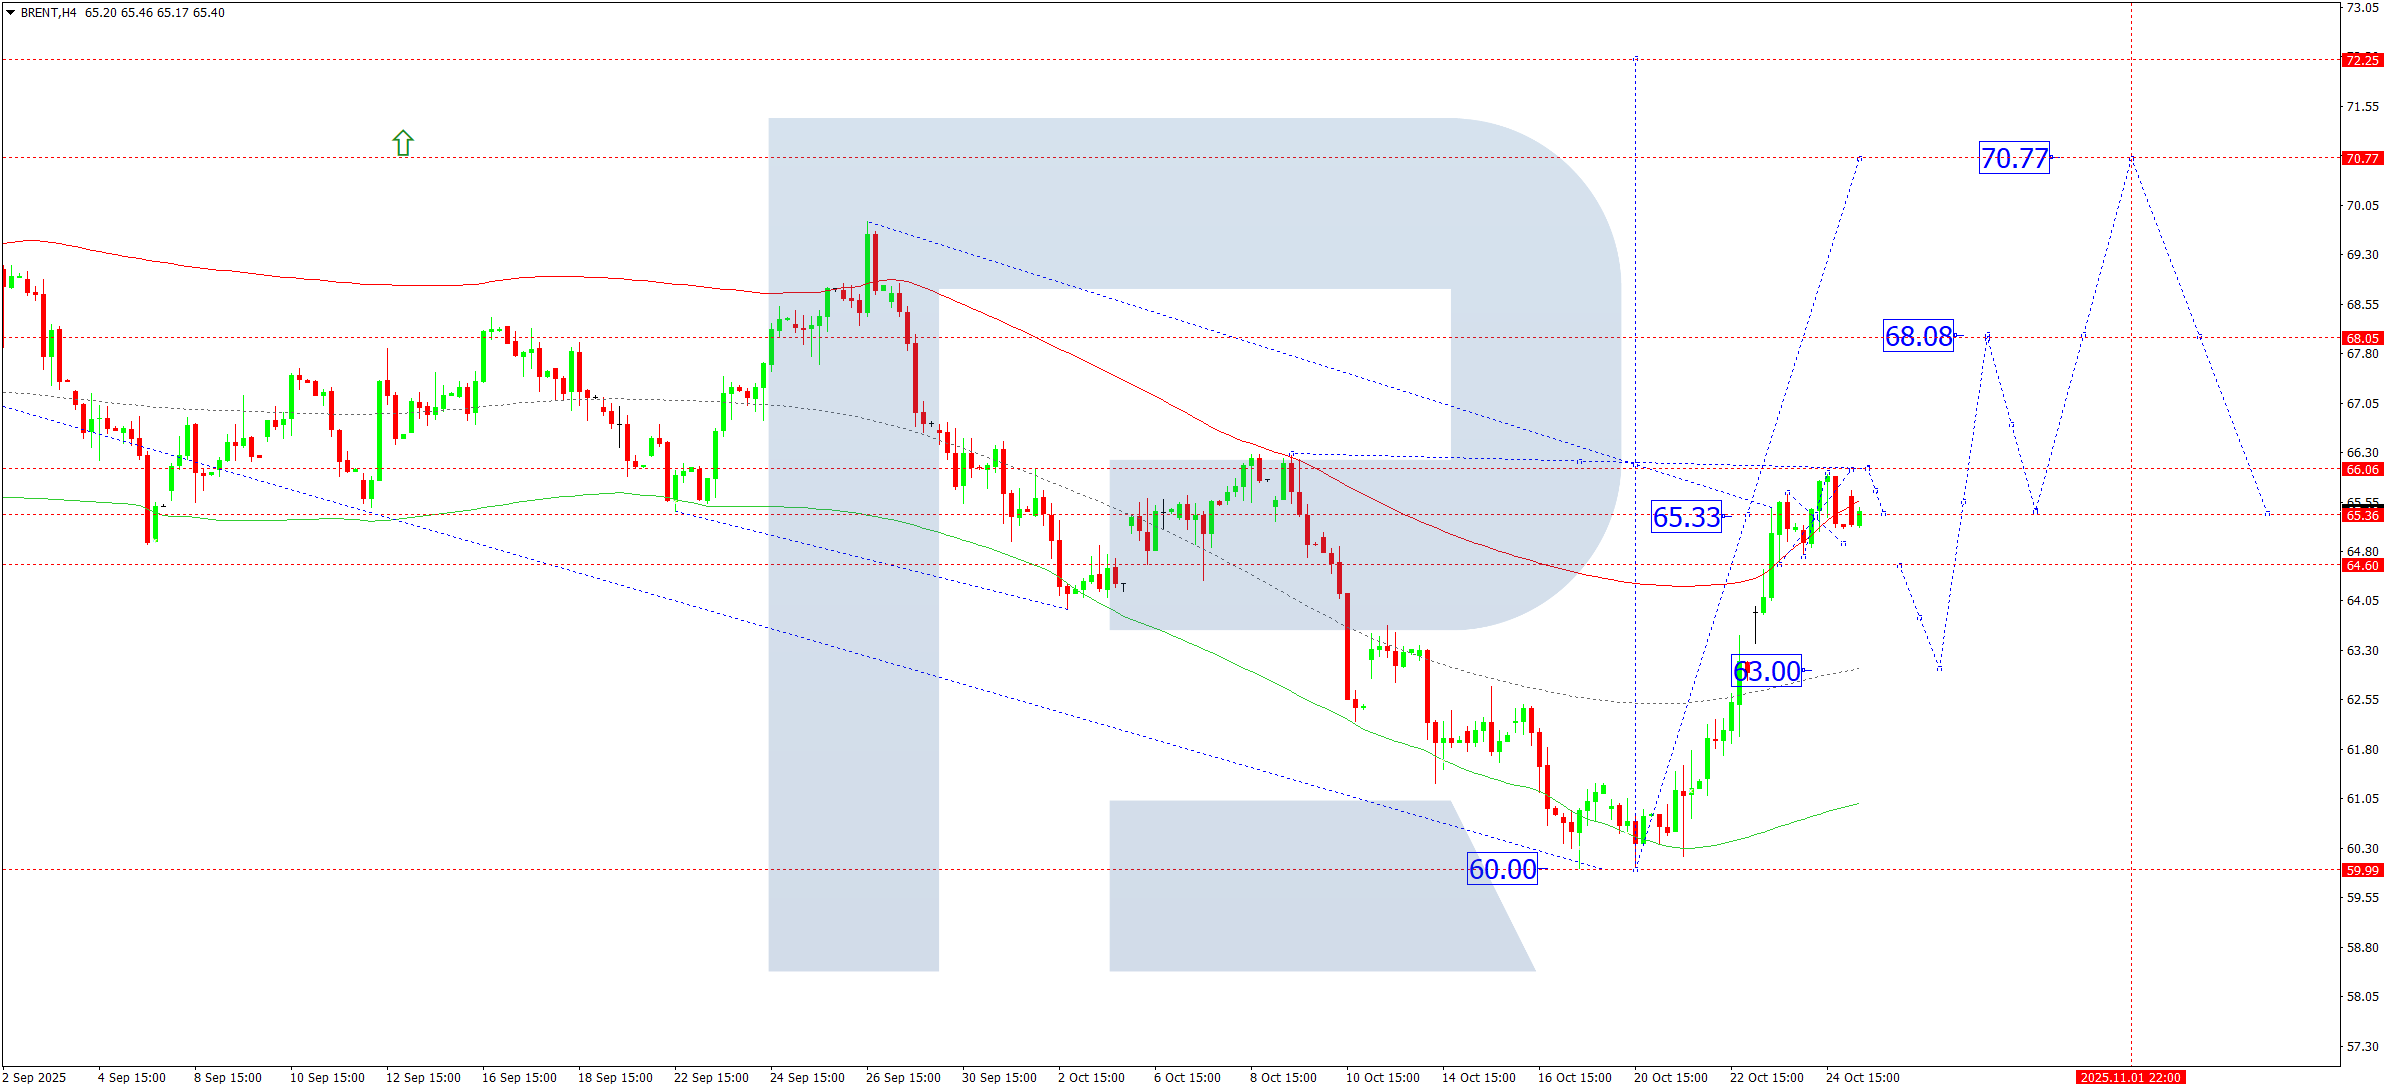
On the H4 chart, Brent crude consolidates near the peak of its upward impulse around 65.33. The range could expand upward to 66.06 and downward to 65.33. A break above 66.06 would confirm bullish continuation towards 68.08, and potentially 70.77. Conversely, a downward breakout could trigger a correction toward 63.00, before the uptrend resumes.
This scenario aligns with the Elliott Wave and bullish wave matrix, with a key pivot at 65.33. After reaching the lower boundary of the Price Envelope at 60.00, Brent appears to be forming a new growth impulse toward the upper boundary at 70.77, supported by ongoing geopolitical tensions.
Outlook: Technical indicators favor further growth toward 68.08 and 70.77.
Risk Warning:
Past performance is not indicative of future results. Financial markets involve risk, and forecasts are not guarantees of future price movement. Trade responsibly.
Leave a Reply