
Daily technical analysis and forecast for 15 December 2025
EURUSD Forecast
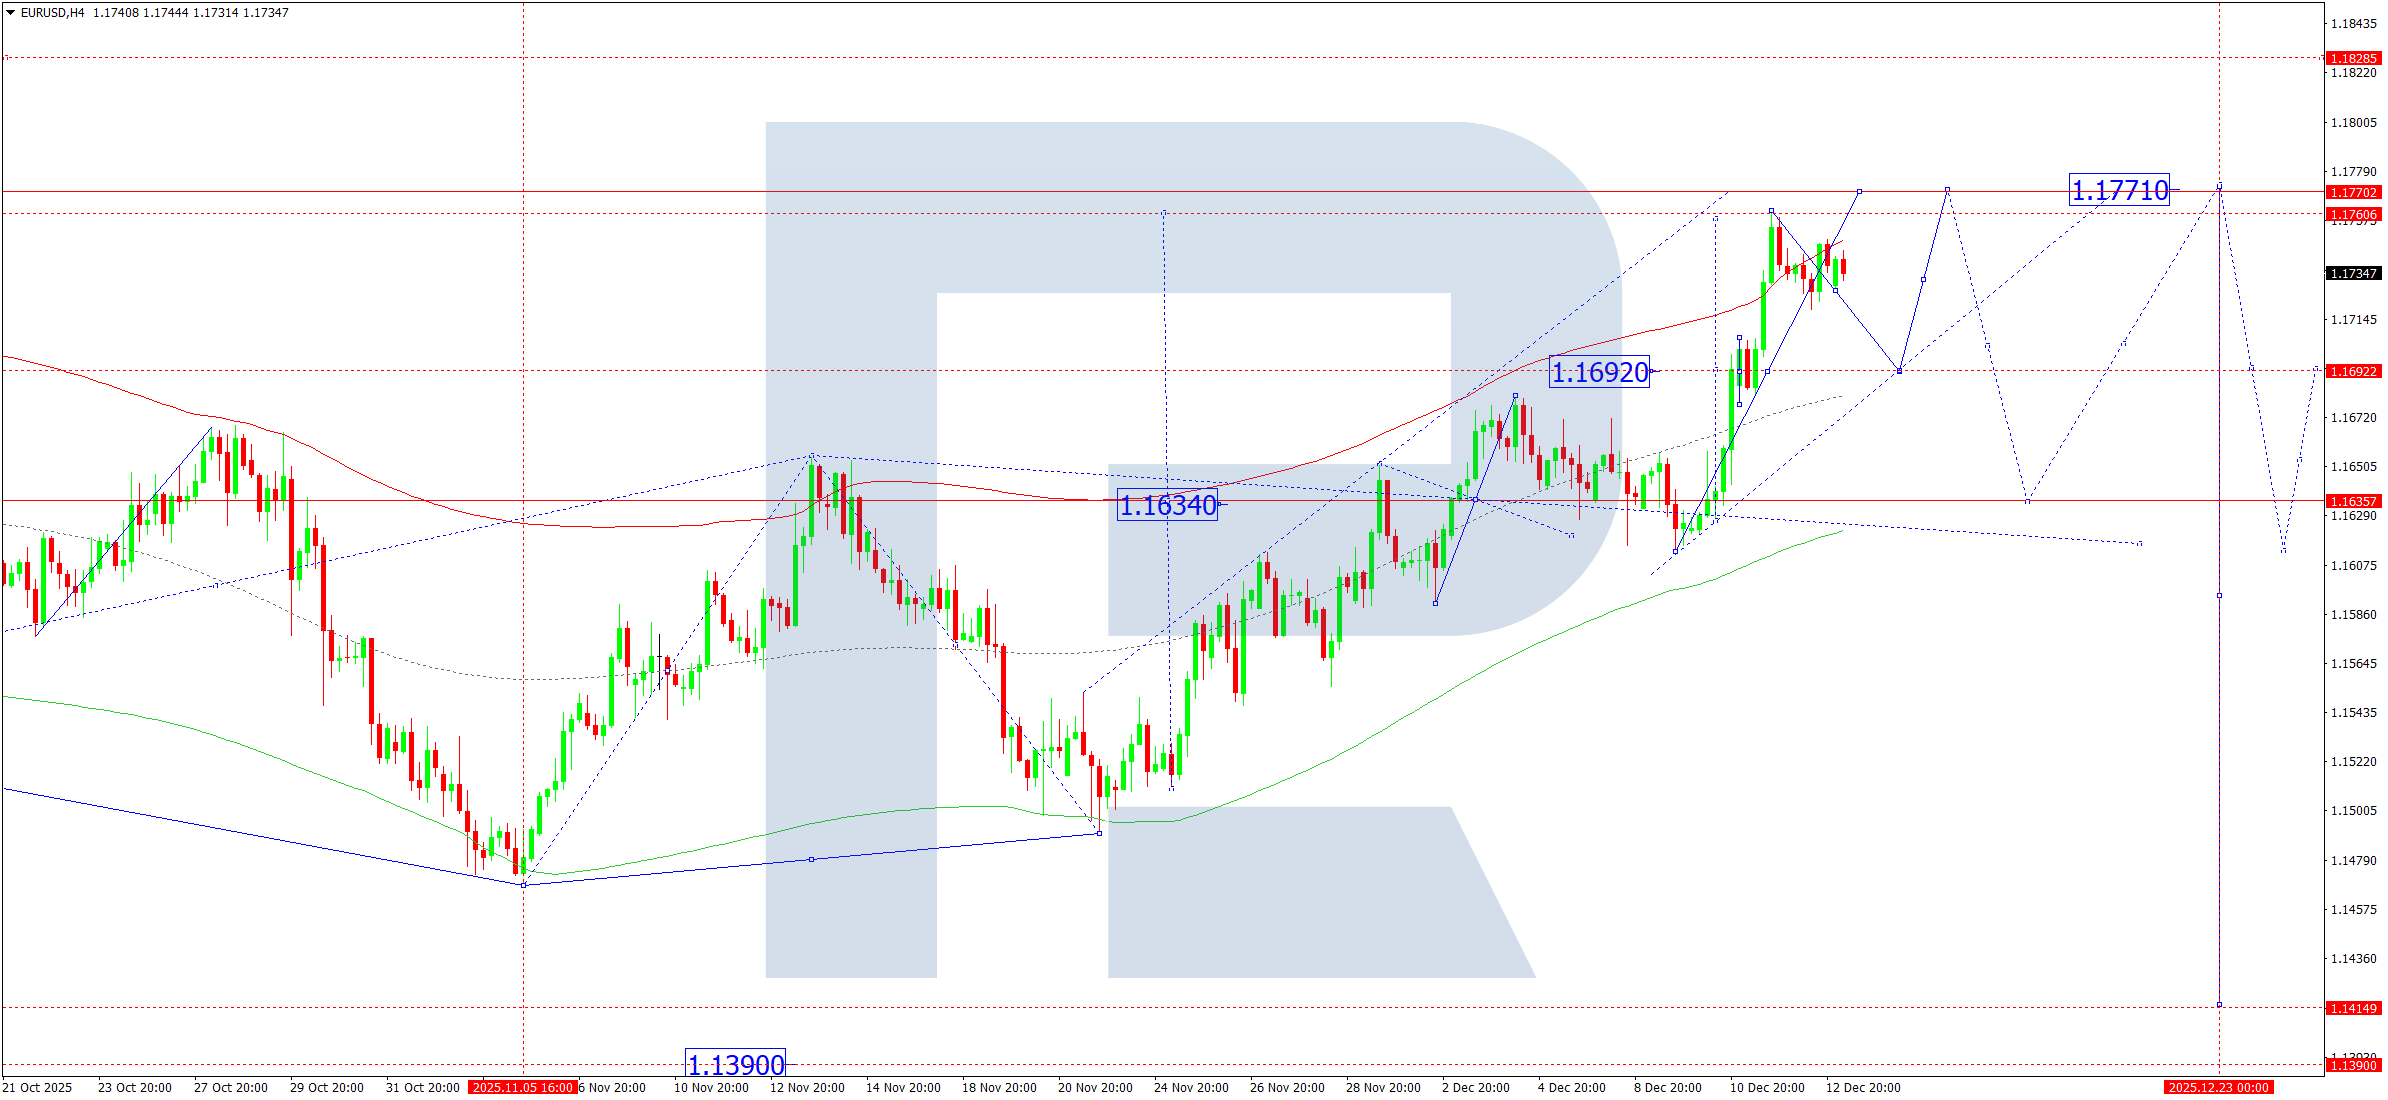
On the H4 chart, EURUSD continues to develop a corrective structure. The price is currently consolidating near 1.1634 and has already broken higher, reaching the local corrective target at 1.1760.
For 15 December 2025, a corrective pullback towards 1.1692 is expected. Once this level is tested, the pair may resume its upward movement towards 1.1771. Later, a broader decline towards 1.1634 remains possible.
The Elliott Wave structure and the Matrix of the upward wave, with a rotation center at 1.1634, support this scenario and define the dominant market structure. The recent upward move has reached the upper boundary of the Price Envelope at 1.1760, suggesting a potential correction towards the central line at 1.1692, with an extension towards 1.1634 not excluded.
Technical indicators favor a short-term decline towards 1.1692.
USDJPY Forecast
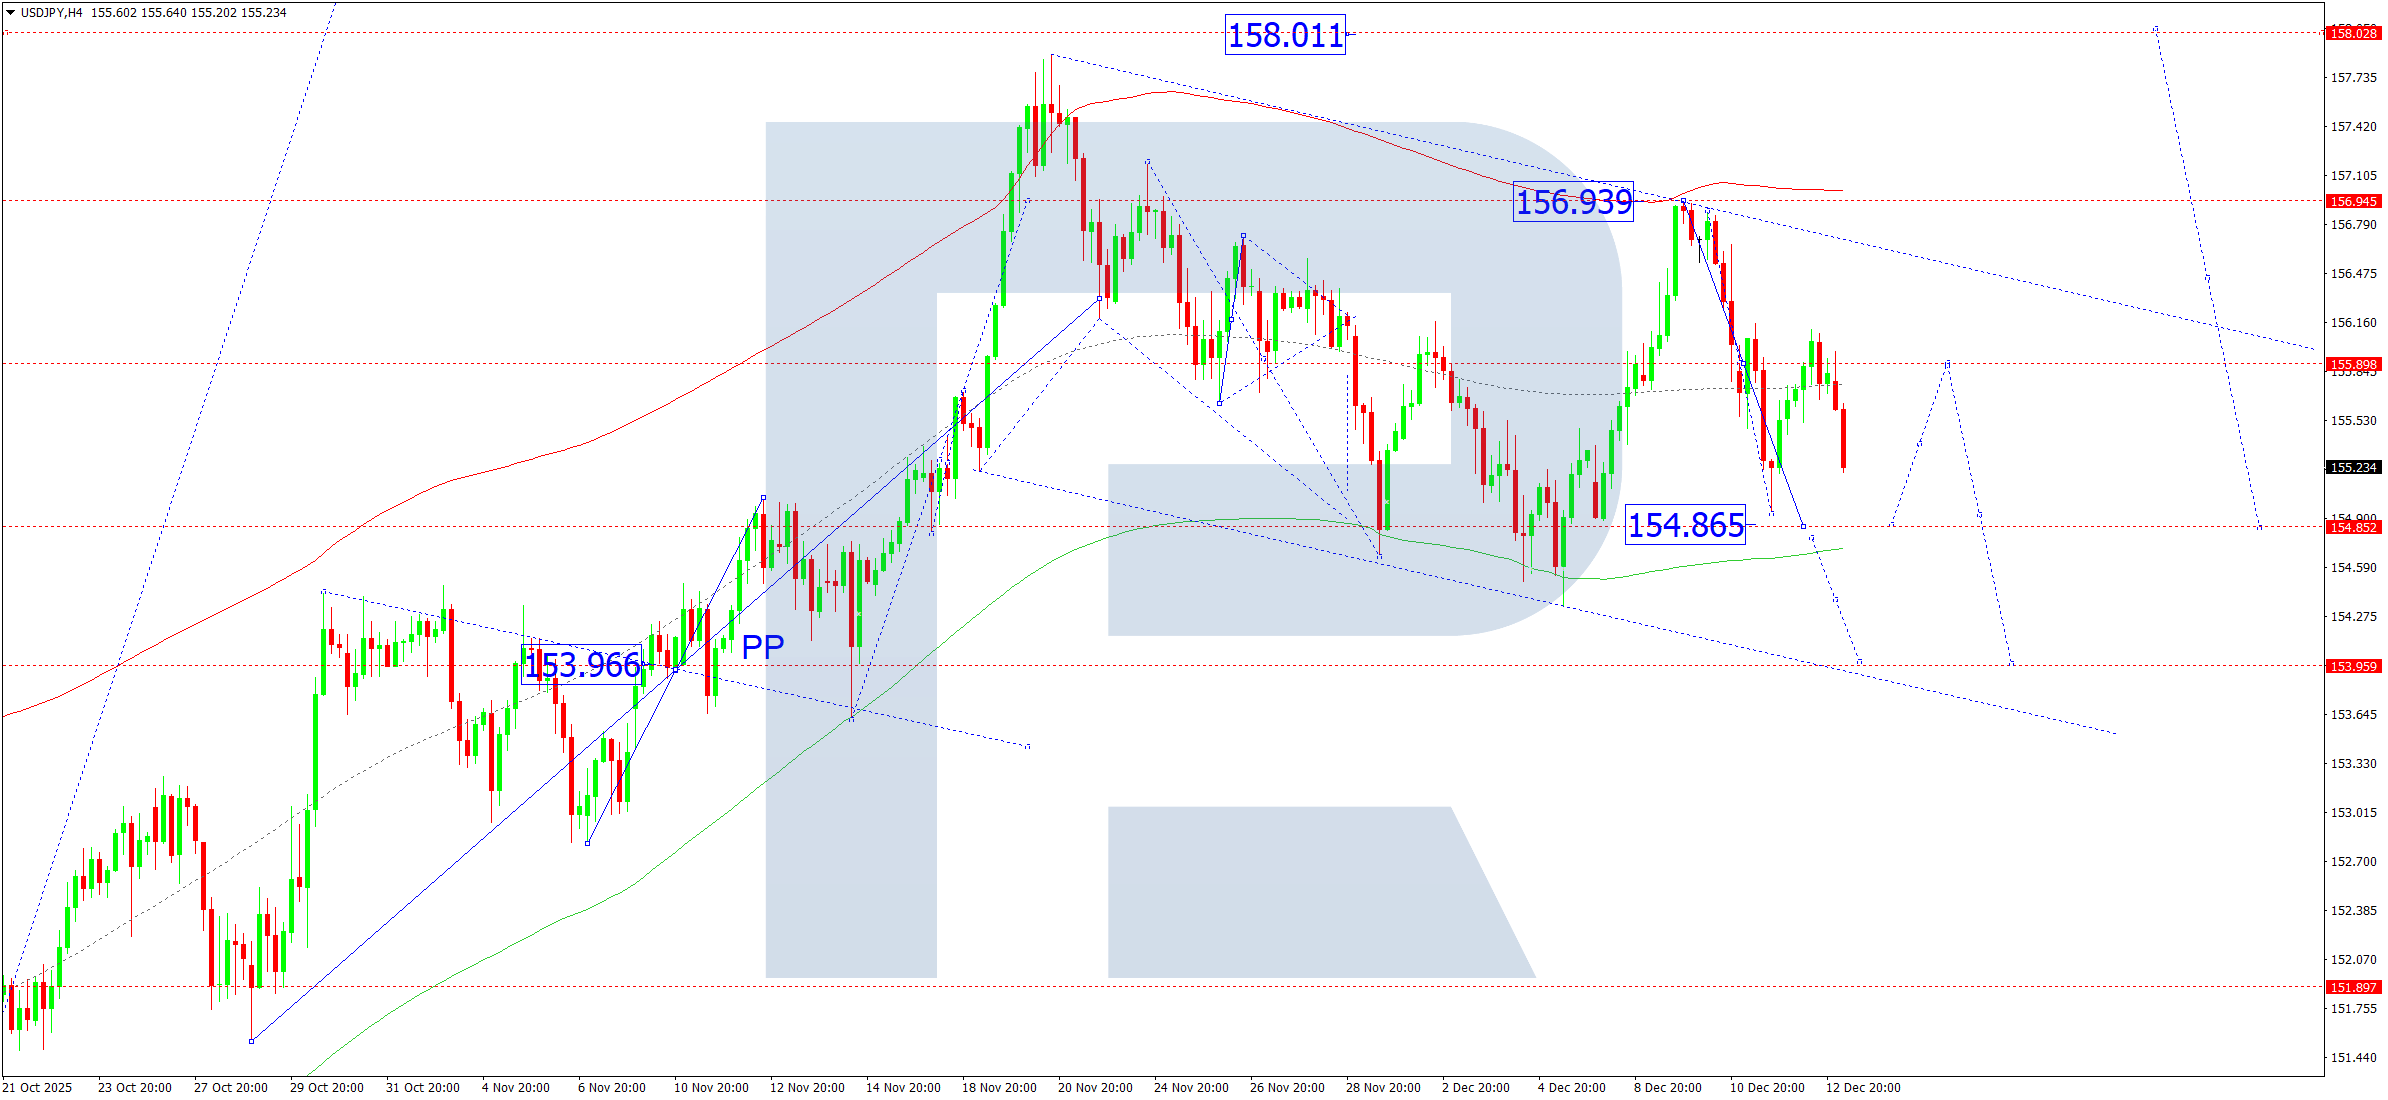
On the H4 chart, USDJPY remains in a consolidation phase centered around 155.90. For today, a corrective move lower towards 154.86 is anticipated, which may fully exhaust the current correction.
After this pullback, the pair may initiate a new upward wave, targeting 158.00 or higher.
The Elliott Wave structure and the Matrix of the upward wave, with a rotation center at 153.90, confirm this outlook. Price action is currently directed towards the lower boundary of the Price Envelope at 154.86, after which a recovery towards 155.90 may follow.
Technical indicators support a corrective decline towards 154.86.
GBPUSD Forecast
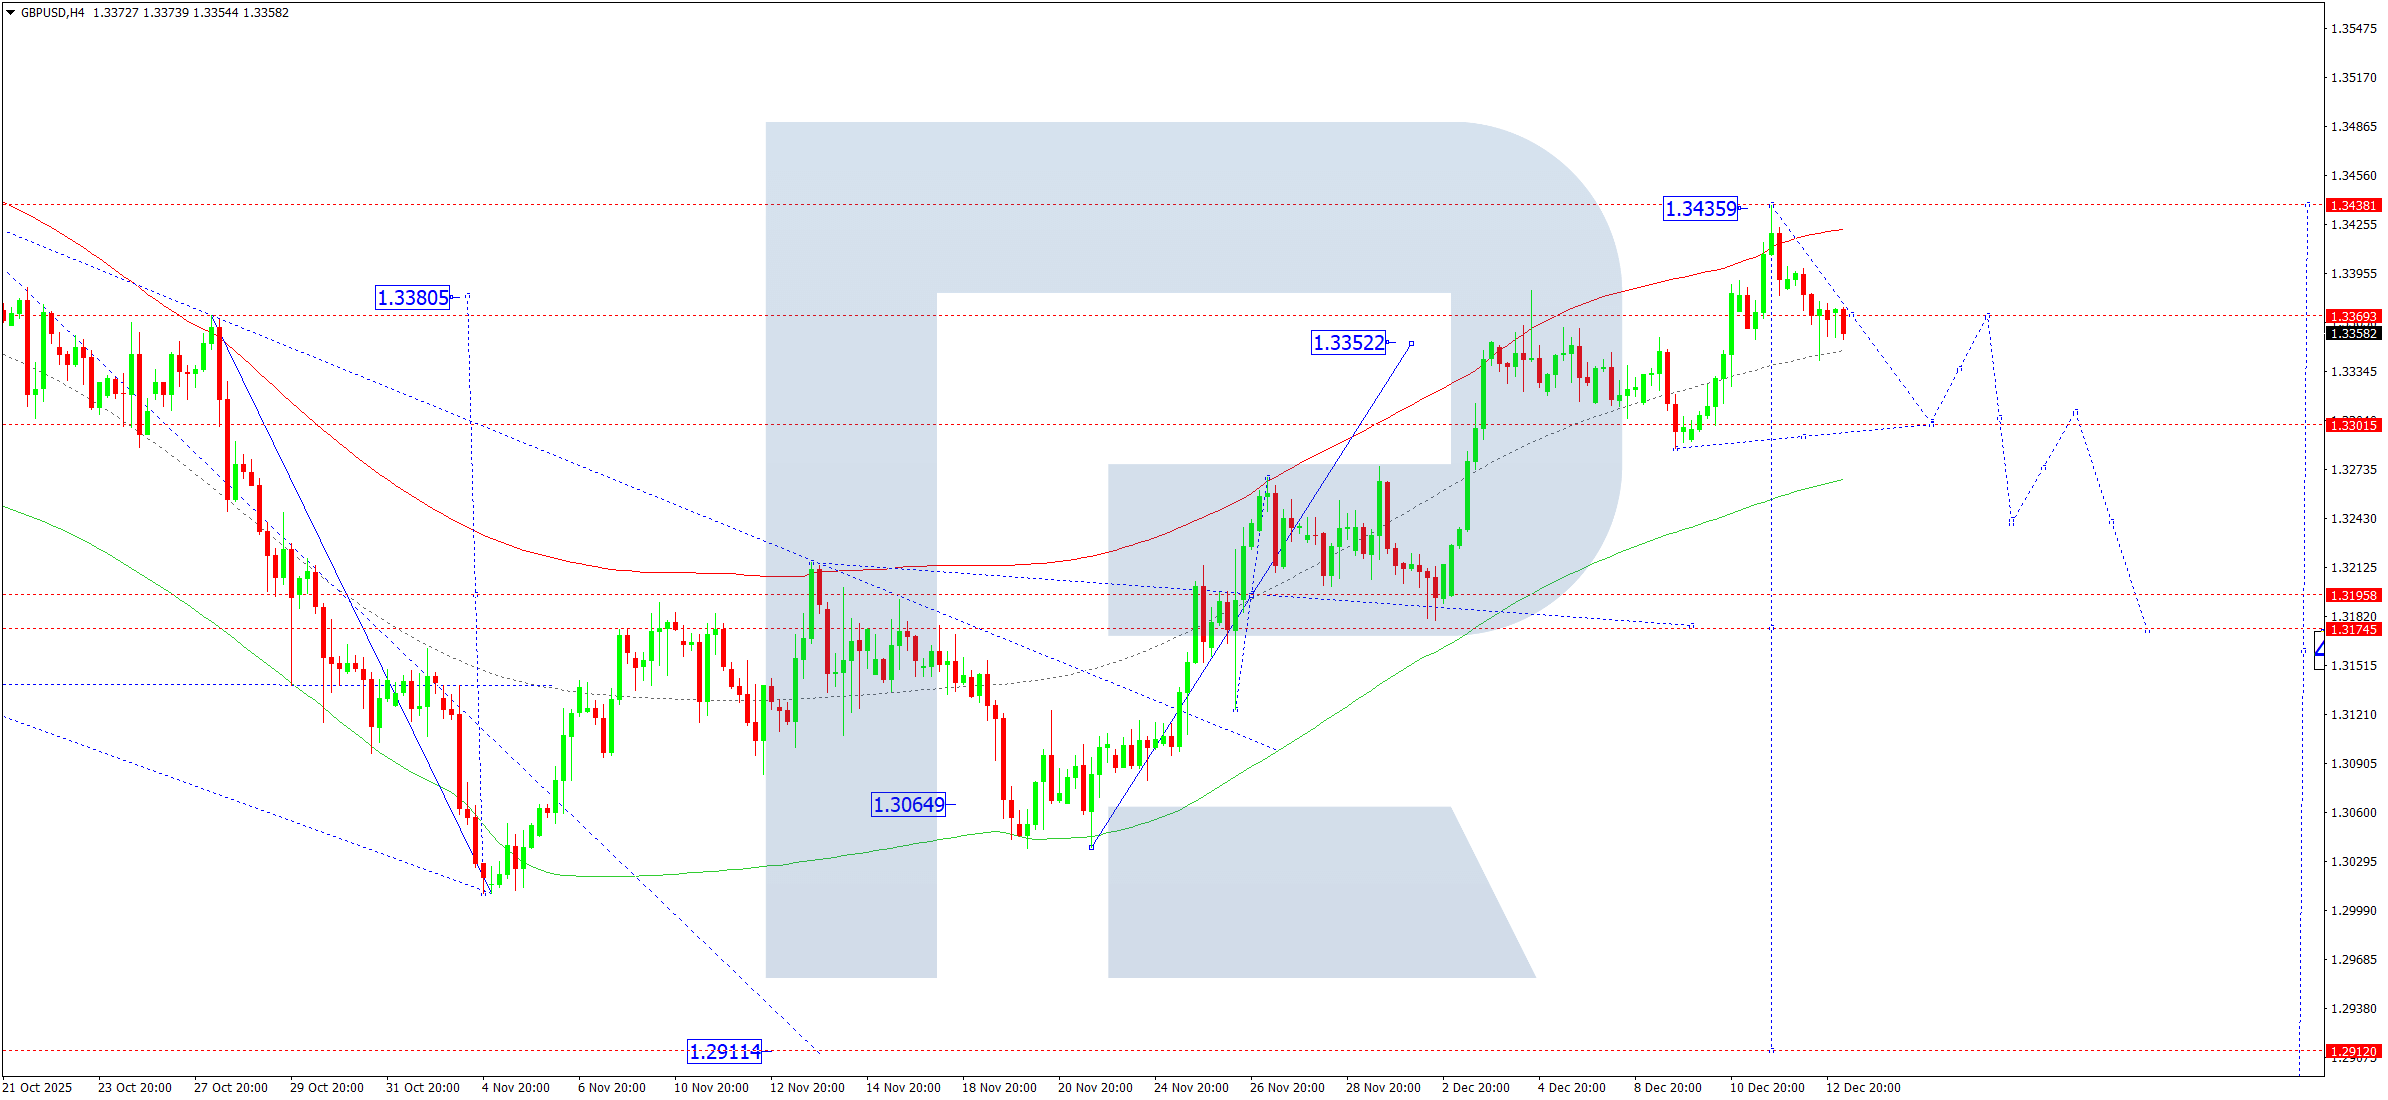
On the H4 timeframe, GBPUSD has completed an upward wave reaching 1.3437. For today, a downward move towards 1.3300 (a retest from above) is expected. Afterward, a short-term rebound towards 1.3370 may occur, completing the corrective phase.
Once the correction ends, the broader downtrend is likely to resume, with the next target at 1.3195, followed by a possible extension towards 1.2911.
The Elliott Wave structure and the Matrix of the downward wave, with a rotation center at 1.3188, validate this scenario. The corrective decline may continue towards the lower boundary of the Price Envelope at 1.3300, followed by a rebound towards the central line at 1.3370.
Technical indicators suggest further downside pressure towards 1.3300.
AUDUSD Forecast
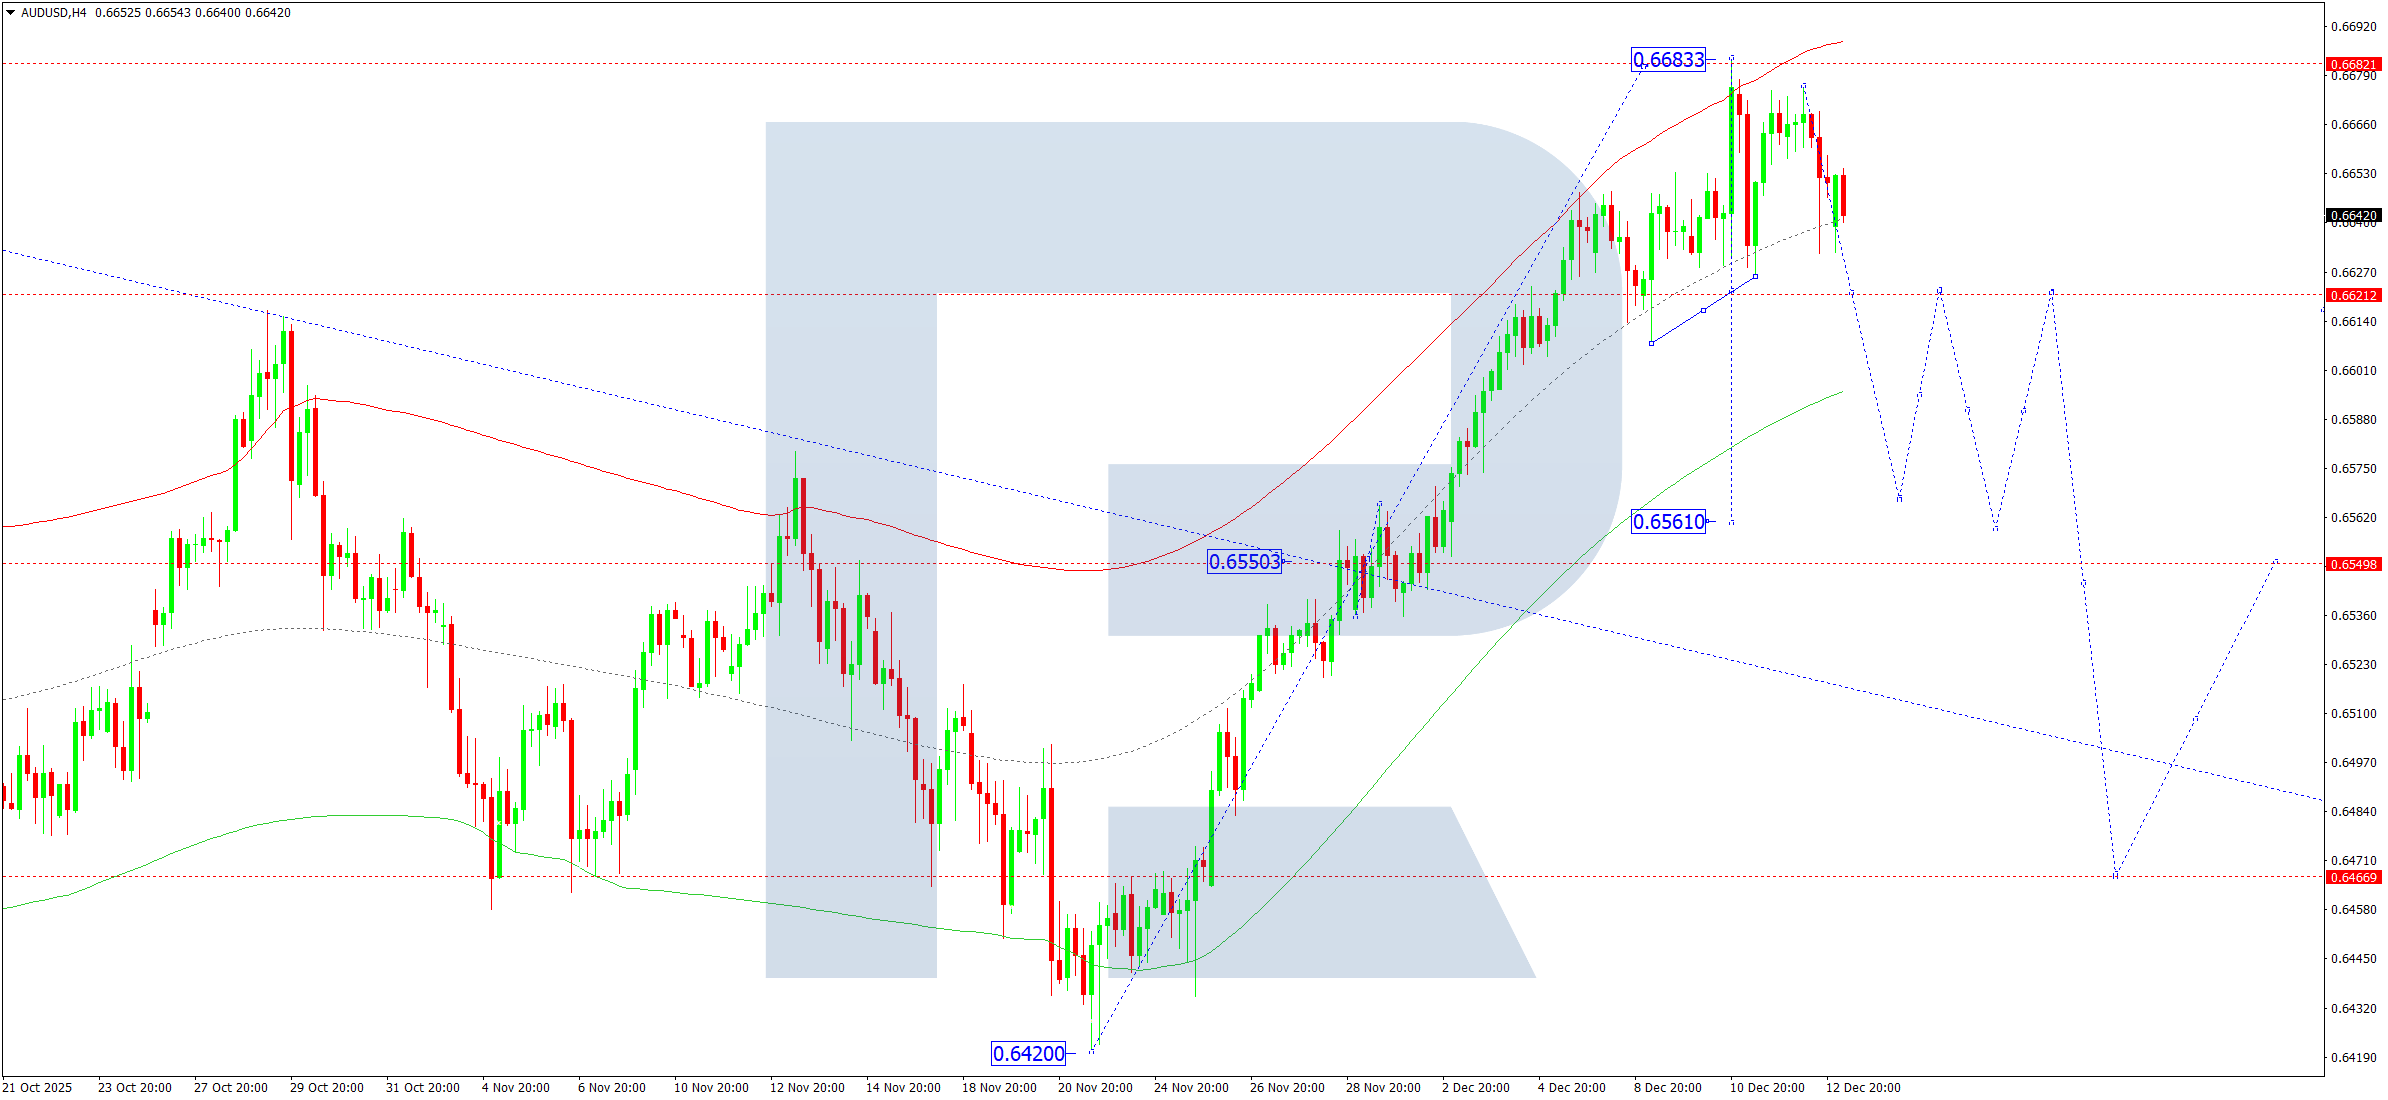
On the H4 chart, AUDUSD has завершed a rising wave reaching 0.6683. For 15 December 2025, the pair is expected to begin a corrective decline towards 0.6622. The correction may extend further towards 0.6555.
A confirmed break below 0.6555 would open the potential for continuation of the bearish movement.
The Elliott Wave structure and the Matrix of the upward wave, with a rotation center at 0.6555, define the current market setup. Price has reached the upper boundary of the Price Envelope at 0.6683, indicating a probable decline towards the lower boundary at 0.6622.
Technical indicators point to a corrective move towards 0.6622.
USDCAD Forecast
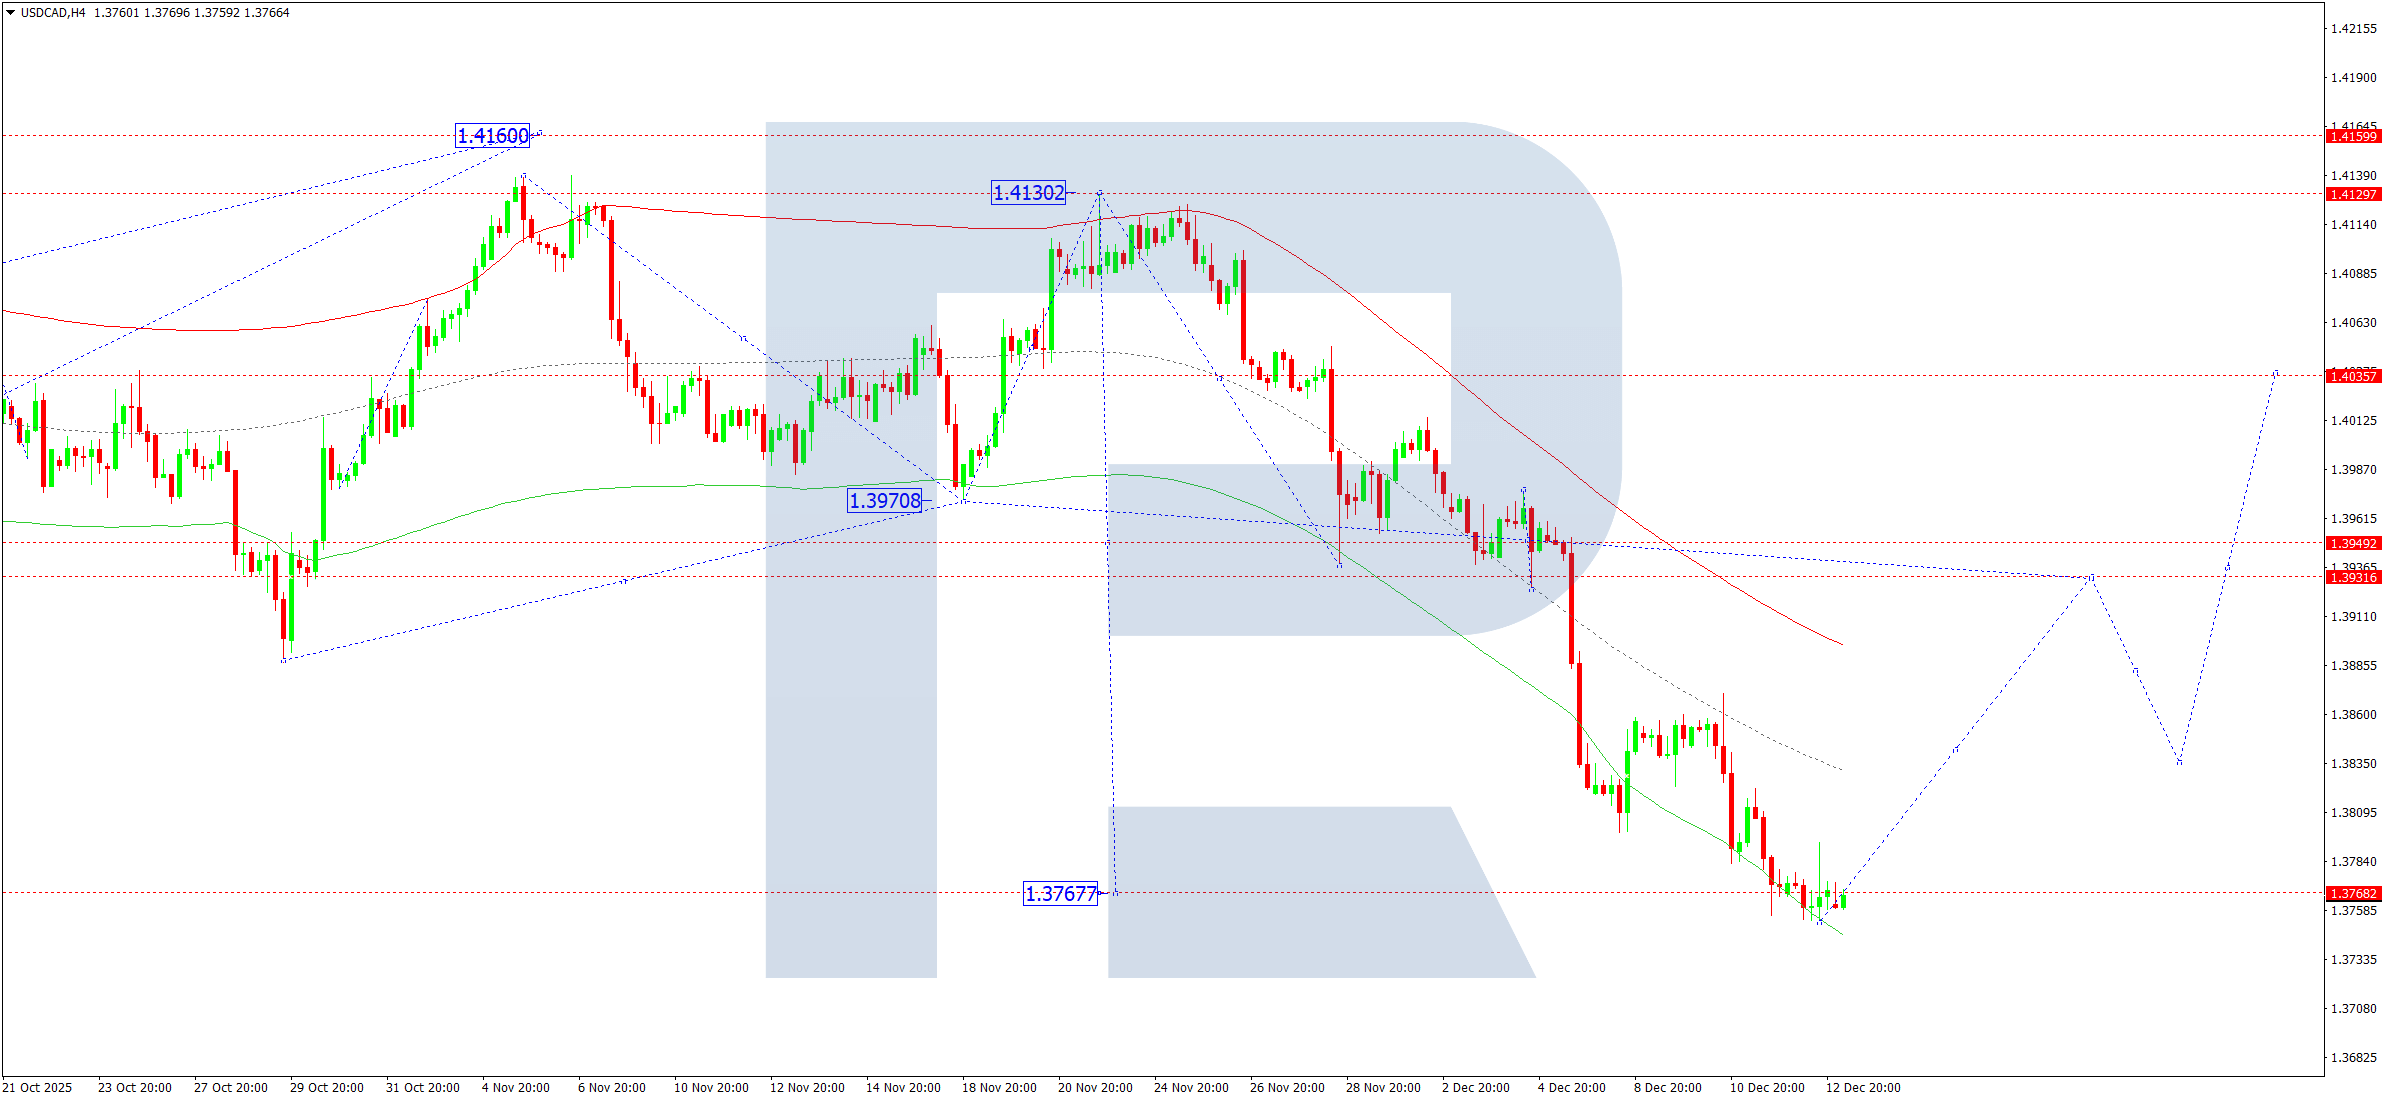
On the H4 chart, USDCAD has completed a downward wave at 1.3767, after which a tight consolidation range has formed above this level.
For today, an upward breakout towards 1.3939 is expected. A subsequent correction towards 1.3844 may follow before the start of a new upward wave targeting 1.4040.
The Elliott Wave structure and the Matrix of the upward wave, with a rotation center at 1.3939, confirm this outlook. The market is currently forming a corrective structure near the lower boundary of the Price Envelope at 1.3767, with upside potential towards 1.3939.
Technical indicators favor an upward correction towards 1.3939.
XAUUSD (Gold) Forecast
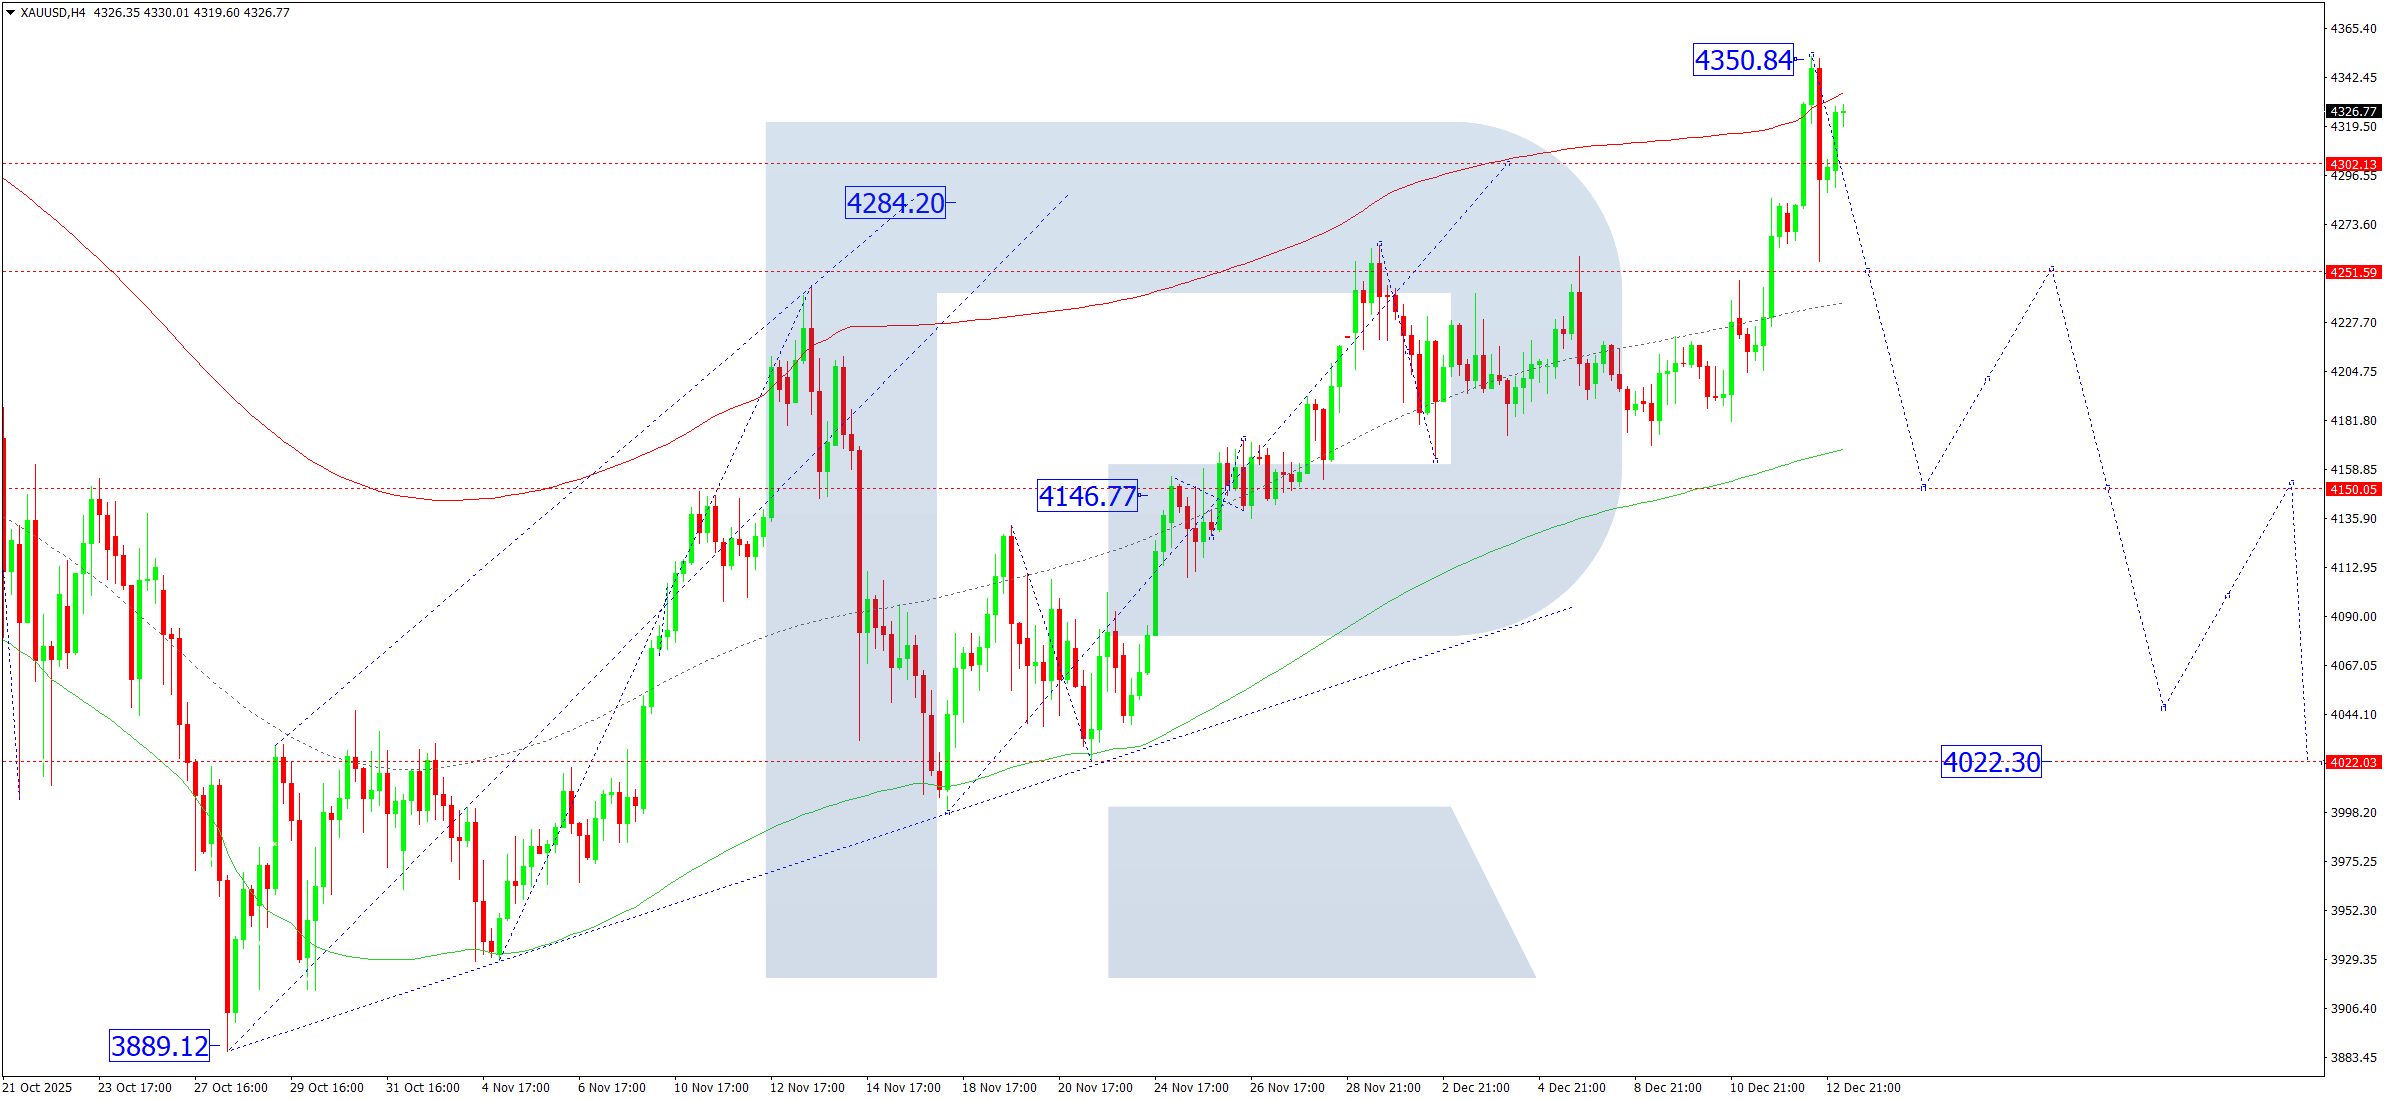
On the H4 chart, XAUUSD has completed an upward wave reaching 4,350. Today, a consolidation phase below this level is likely to develop.
A corrective pullback towards 4,146 is expected, followed by a possible resumption of the uptrend towards 4,410.
The Elliott Wave structure and the Matrix of the upward wave, with a rotation center at 4,146, support this scenario. The fifth upward wave remains in progress, with the upper boundary of the Price Envelope located near 4,410. A correction towards the central line at 4,146 may follow once this level is reached.
Technical indicators signal a possible decline towards 4,146, followed by renewed growth towards 4,390–4,410.
Brent Crude Oil Forecast
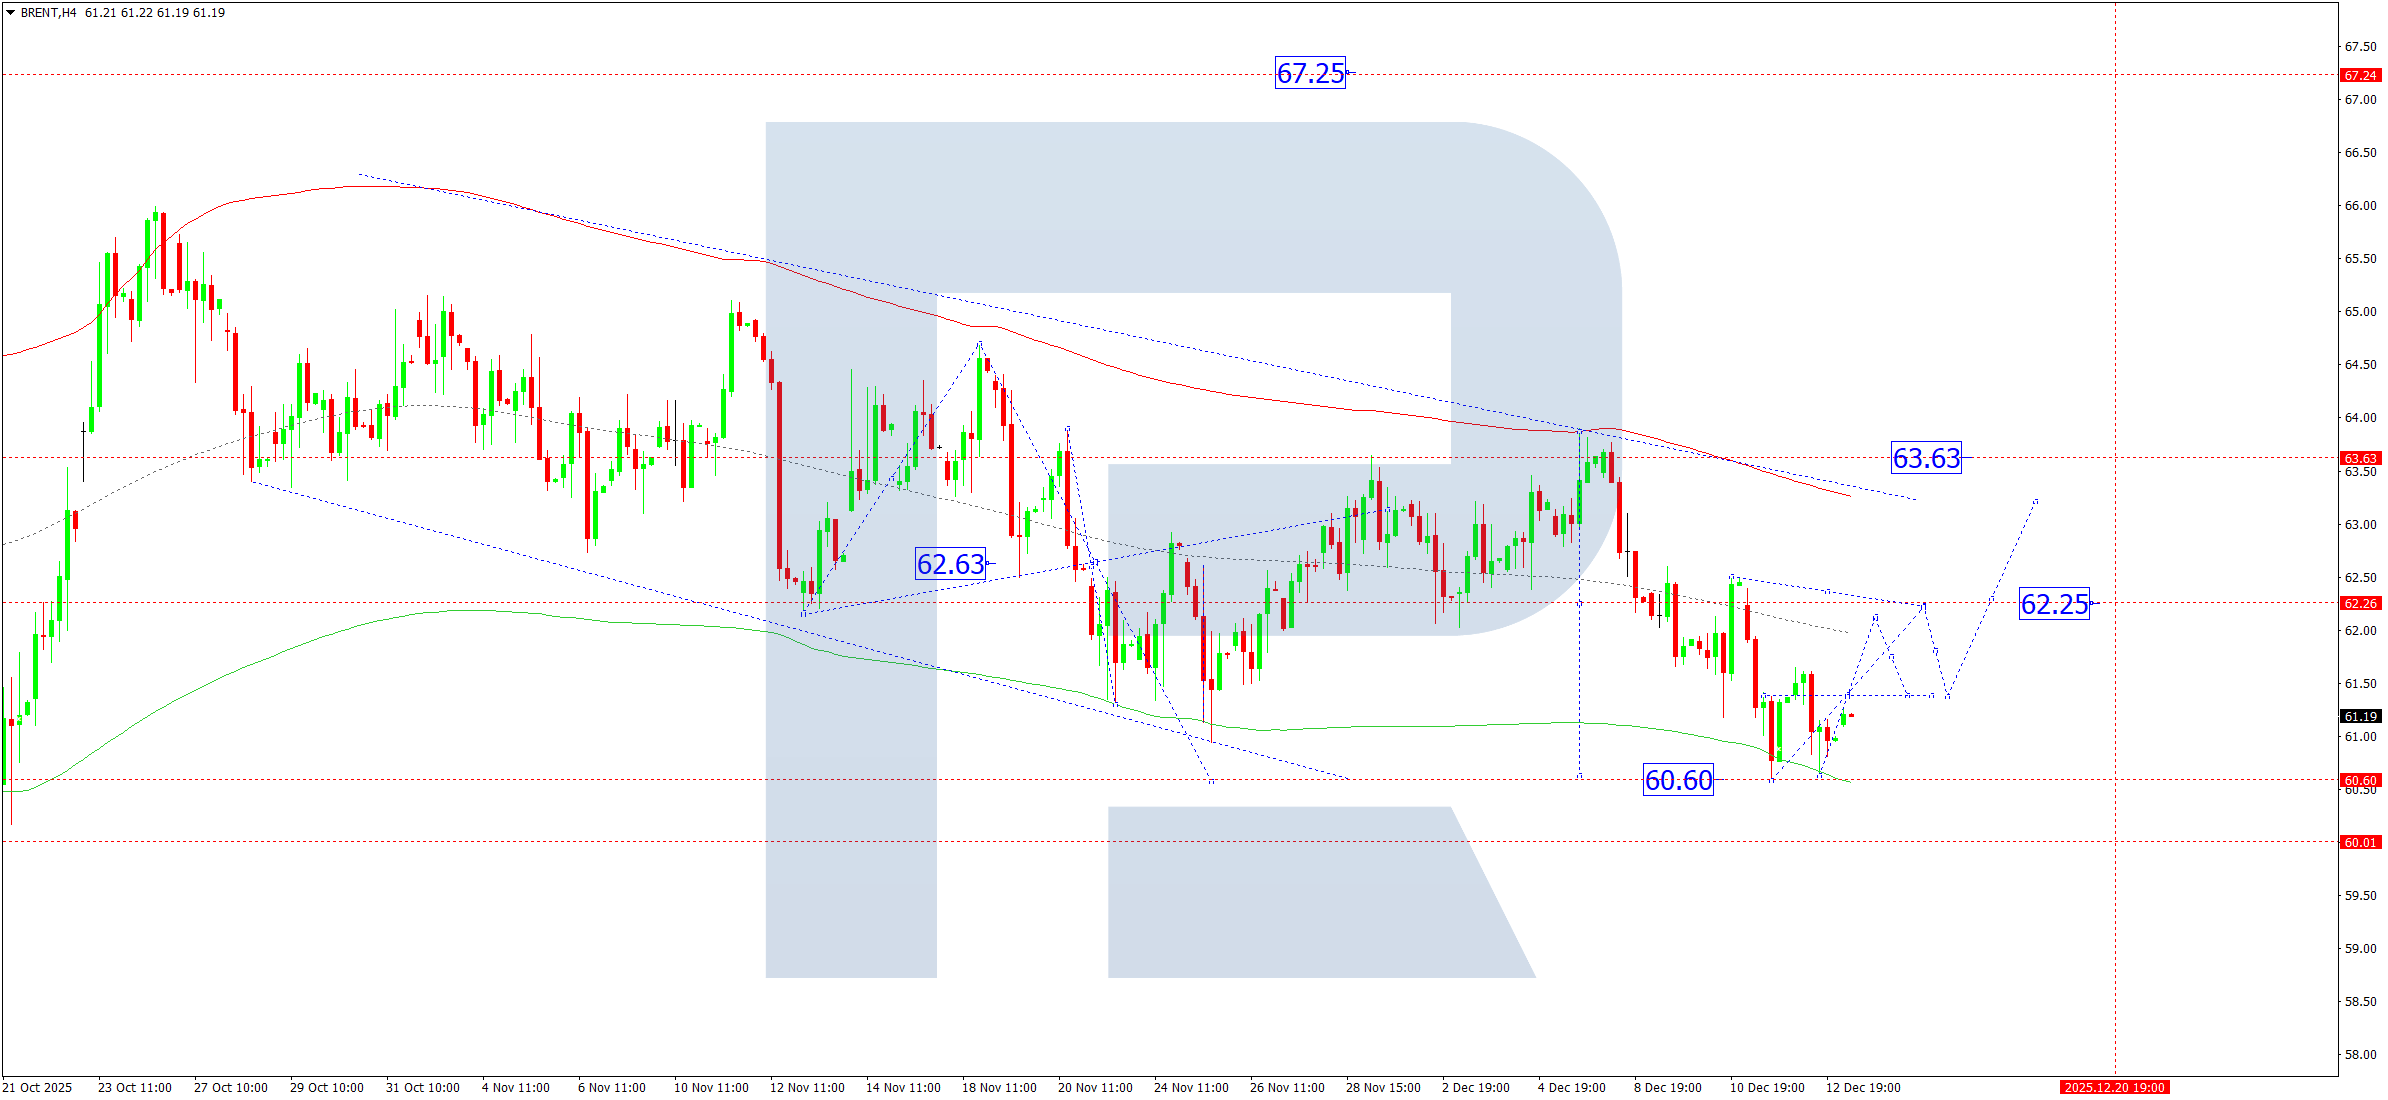
On the H4 chart, Brent crude has completed a downward wave to 60.60. For today, the formation of a consolidation range above this support level is expected.
An upside breakout would open the path for a recovery towards 62.62. A sustained move above this level could extend gains towards 63.63.
The Elliott Wave structure and the Matrix of the upward wave, with a rotation center at 64.00, confirm this outlook. Brent is currently consolidating above the lower boundary of the Price Envelope at 60.60, with upside potential towards the upper boundary at 63.63.
Technical indicators support a bullish move towards 62.62 and 63.63.
Risk Warning:
Past trading performance does not guarantee future results.
Leave a Reply