
Daily technical analysis and forecast for 17 December 2025
EURUSD Forecast
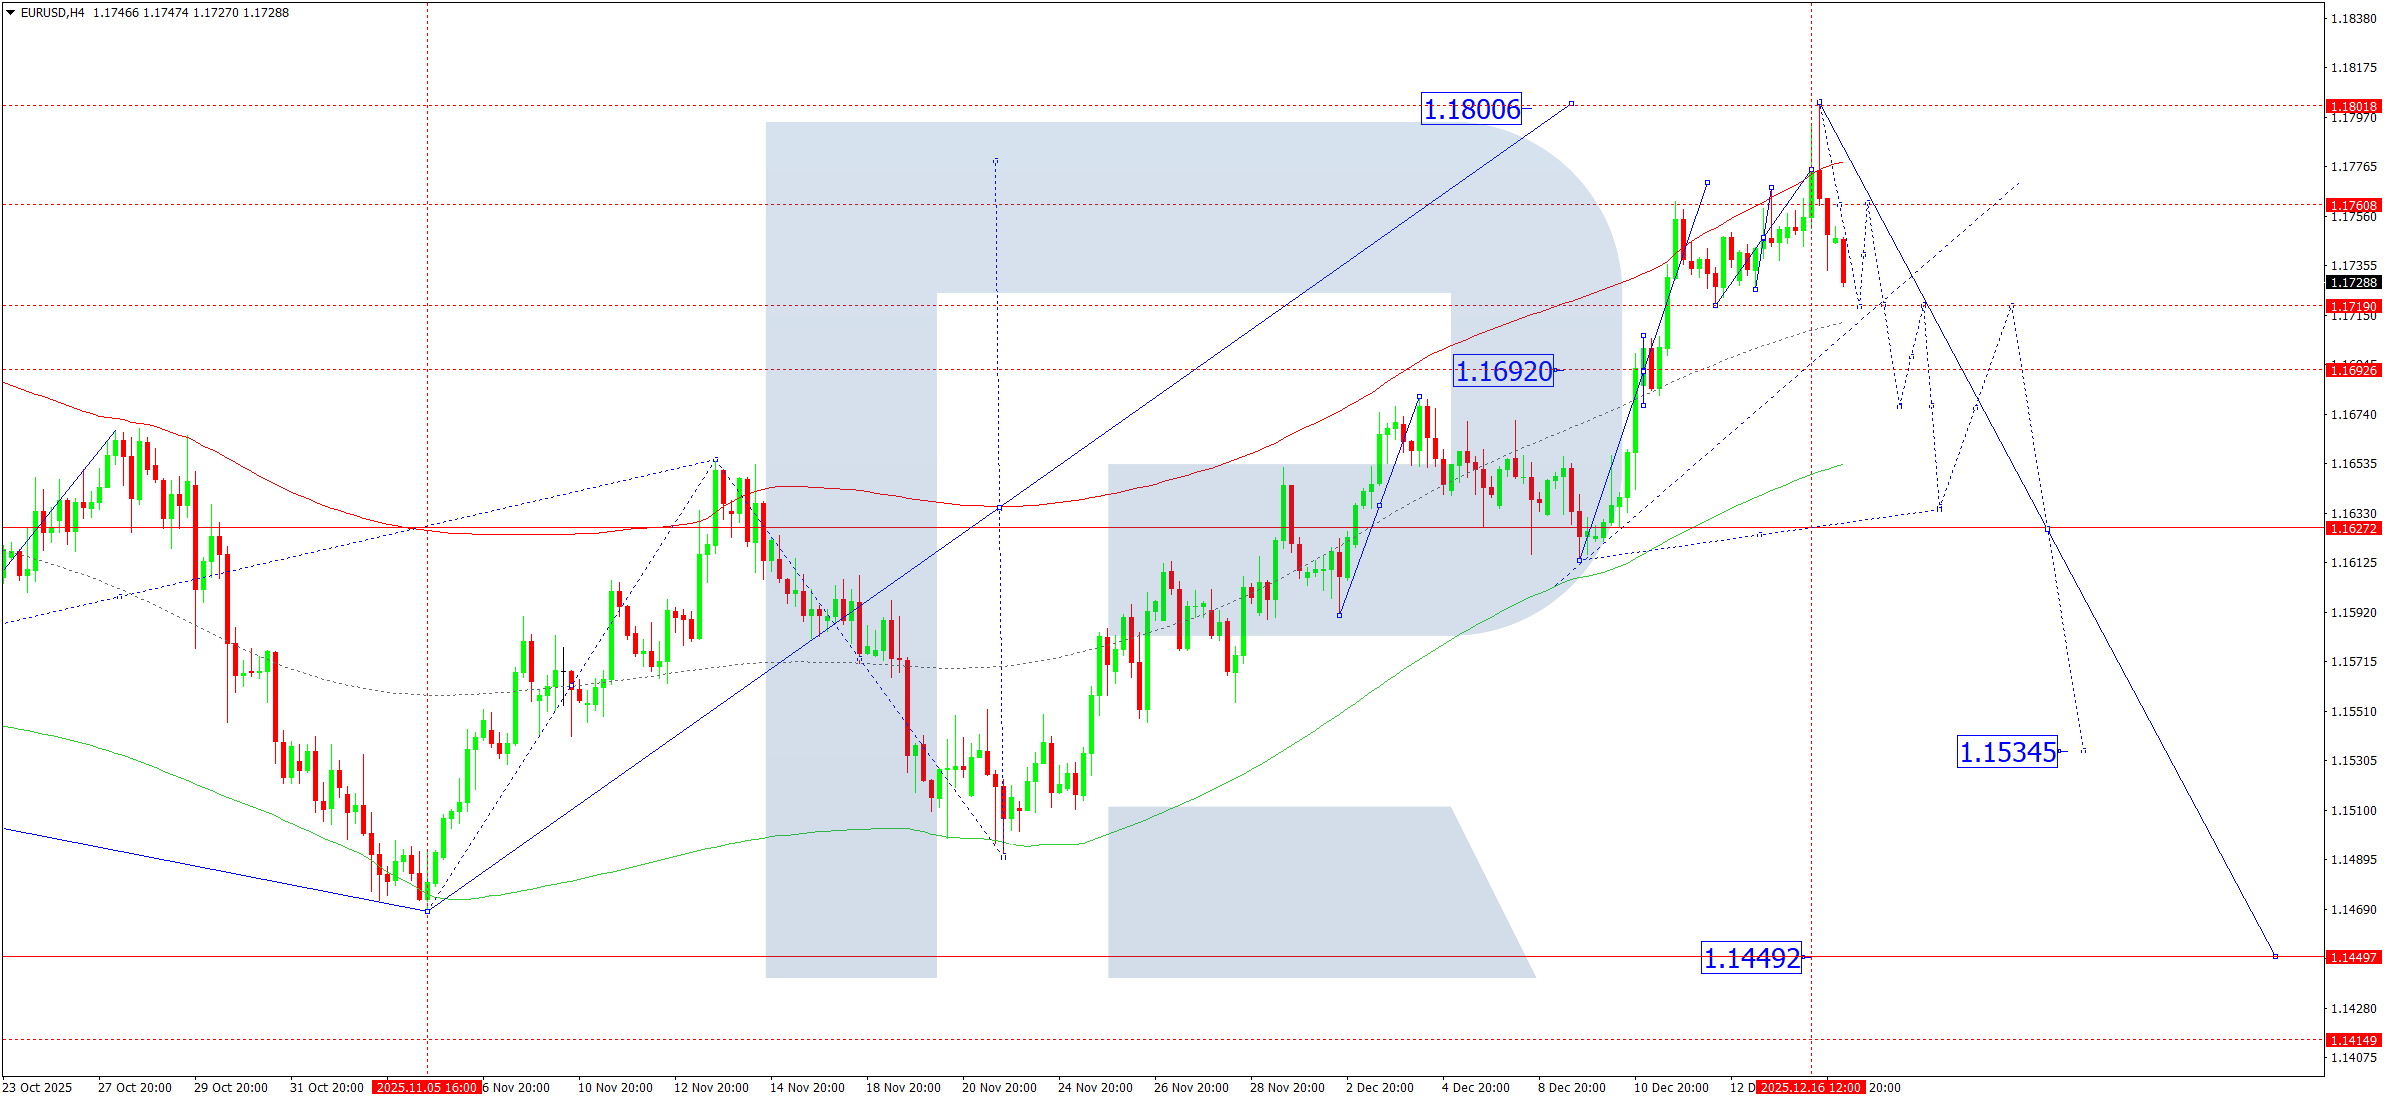
On the H4 chart, EURUSD has extended its consolidation range upward toward the 1.1800 area. On 17 December 2025, a decline toward the lower boundary of the range at 1.1717 is expected. A break below this level may allow the movement to continue toward 1.1636, which serves as the first downside target. Afterward, a corrective pullback toward 1.1717 remains possible.
From a technical perspective, this scenario is supported by the Elliott Wave structure and the Matrix of the upward wave, with a key rotation level at 1.1636. The market has completed an upward leg toward the upper boundary of the Price Envelope near 1.1800. Today, attention is focused on the formation of a downward wave toward the central line at 1.1717, with potential extension to the lower boundary at 1.1636.
EURUSD indicators favor a decline toward 1.1717 and 1.1636.
USDJPY Forecast
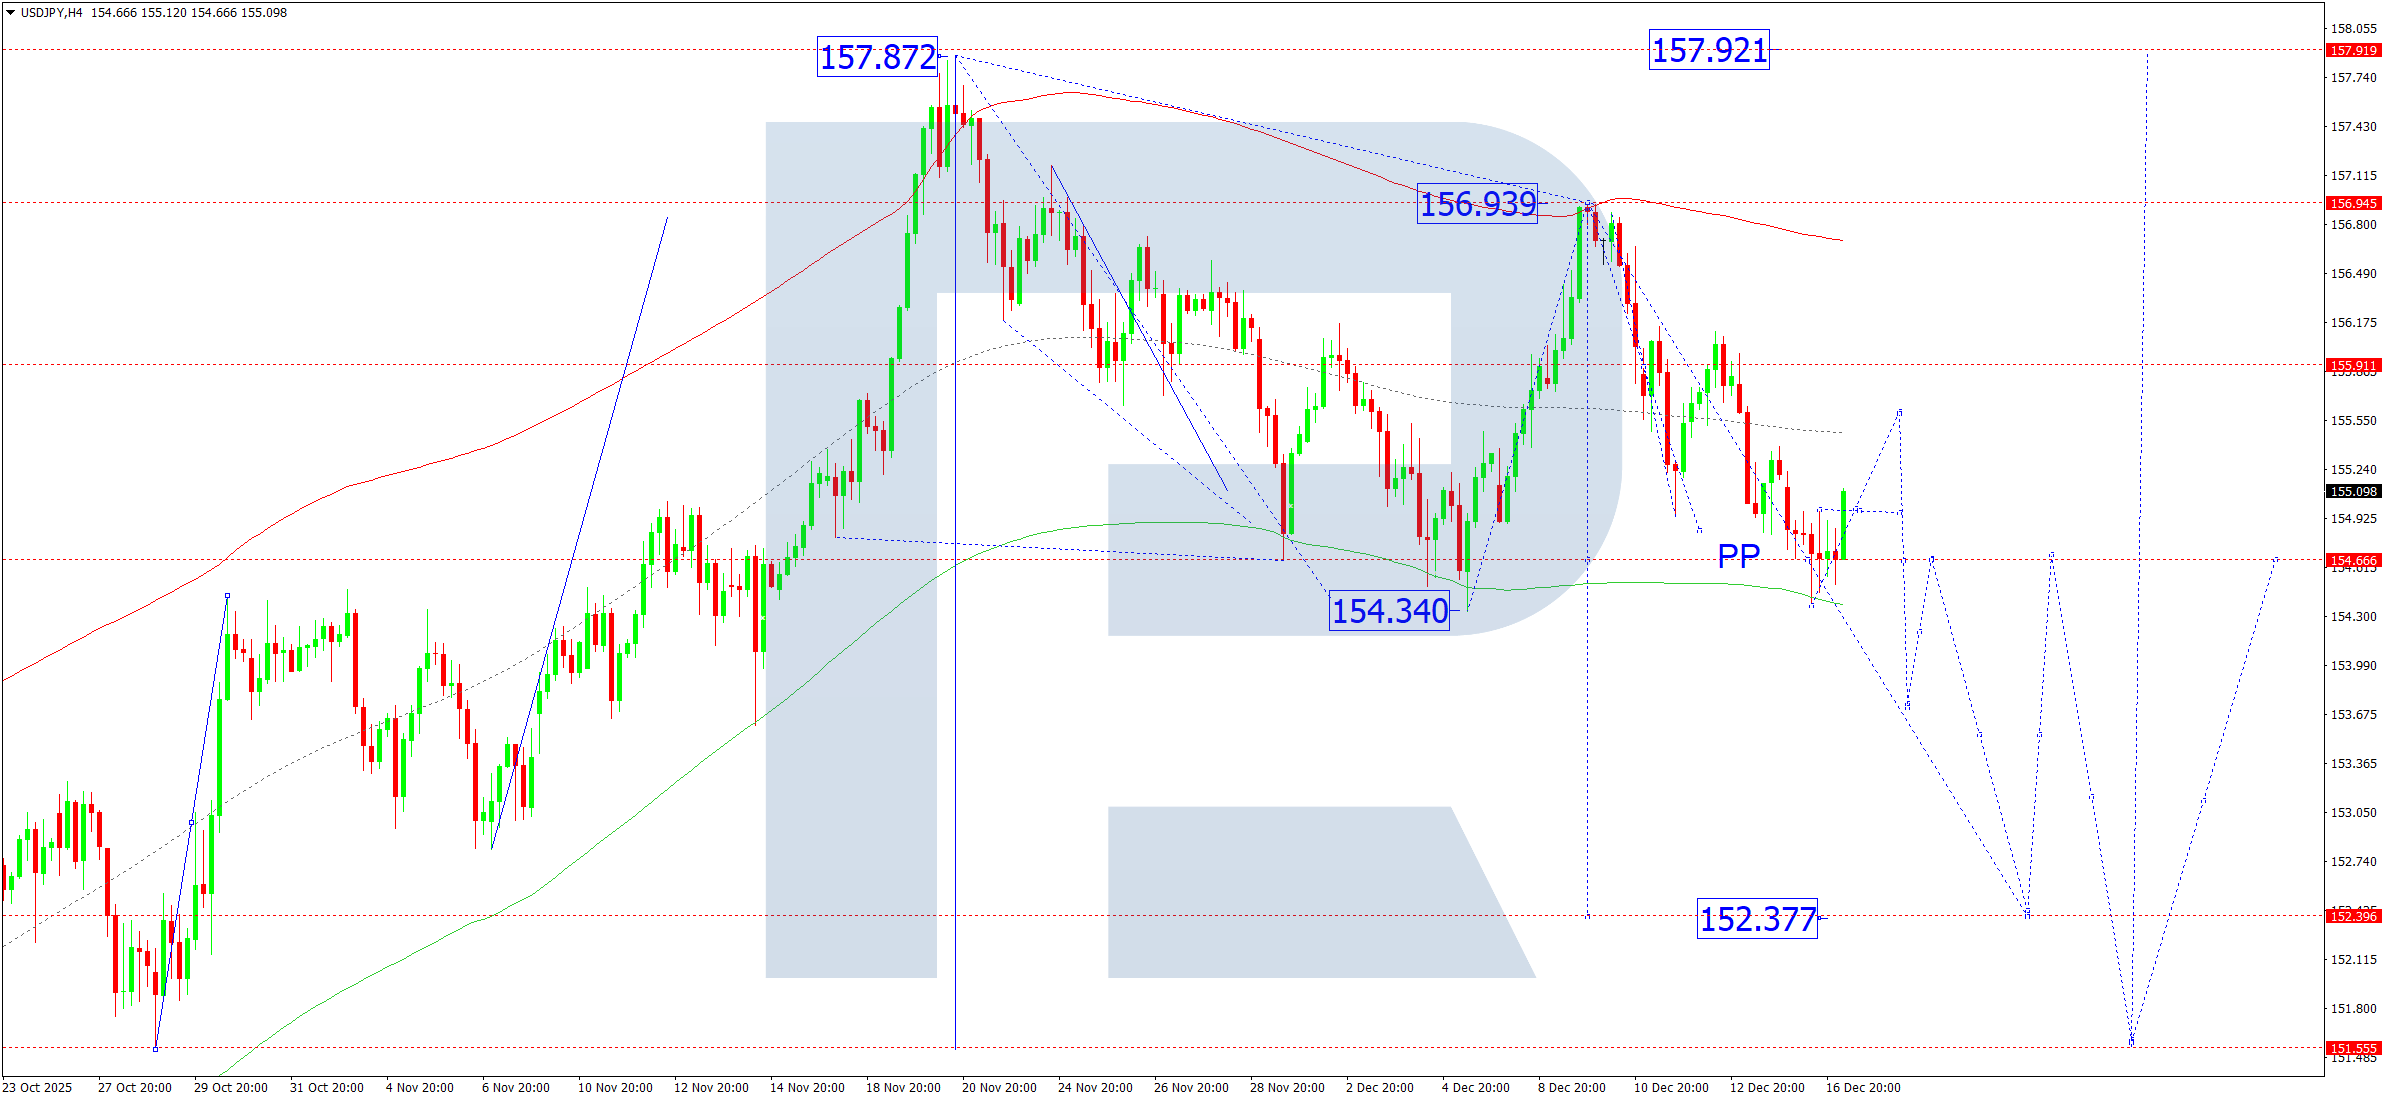
On the H4 timeframe, USDJPY continues to consolidate near 154.66. Today, 17 December 2025, an upside breakout toward 155.55 is possible. Subsequently, a pullback toward 153.53 may occur, which remains a local downside target.
This outlook is reinforced by the Elliott Wave model and the Matrix of the upward wave, with a rotation center at 152.90. The pair has recently completed a corrective move to the lower boundary of the Price Envelope at 154.40. From here, the probability of renewed growth toward the central line at 155.55 increases.
USDJPY indicators suggest potential upside toward 155.55, followed by a possible decline toward 153.53.
GBPUSD Forecast
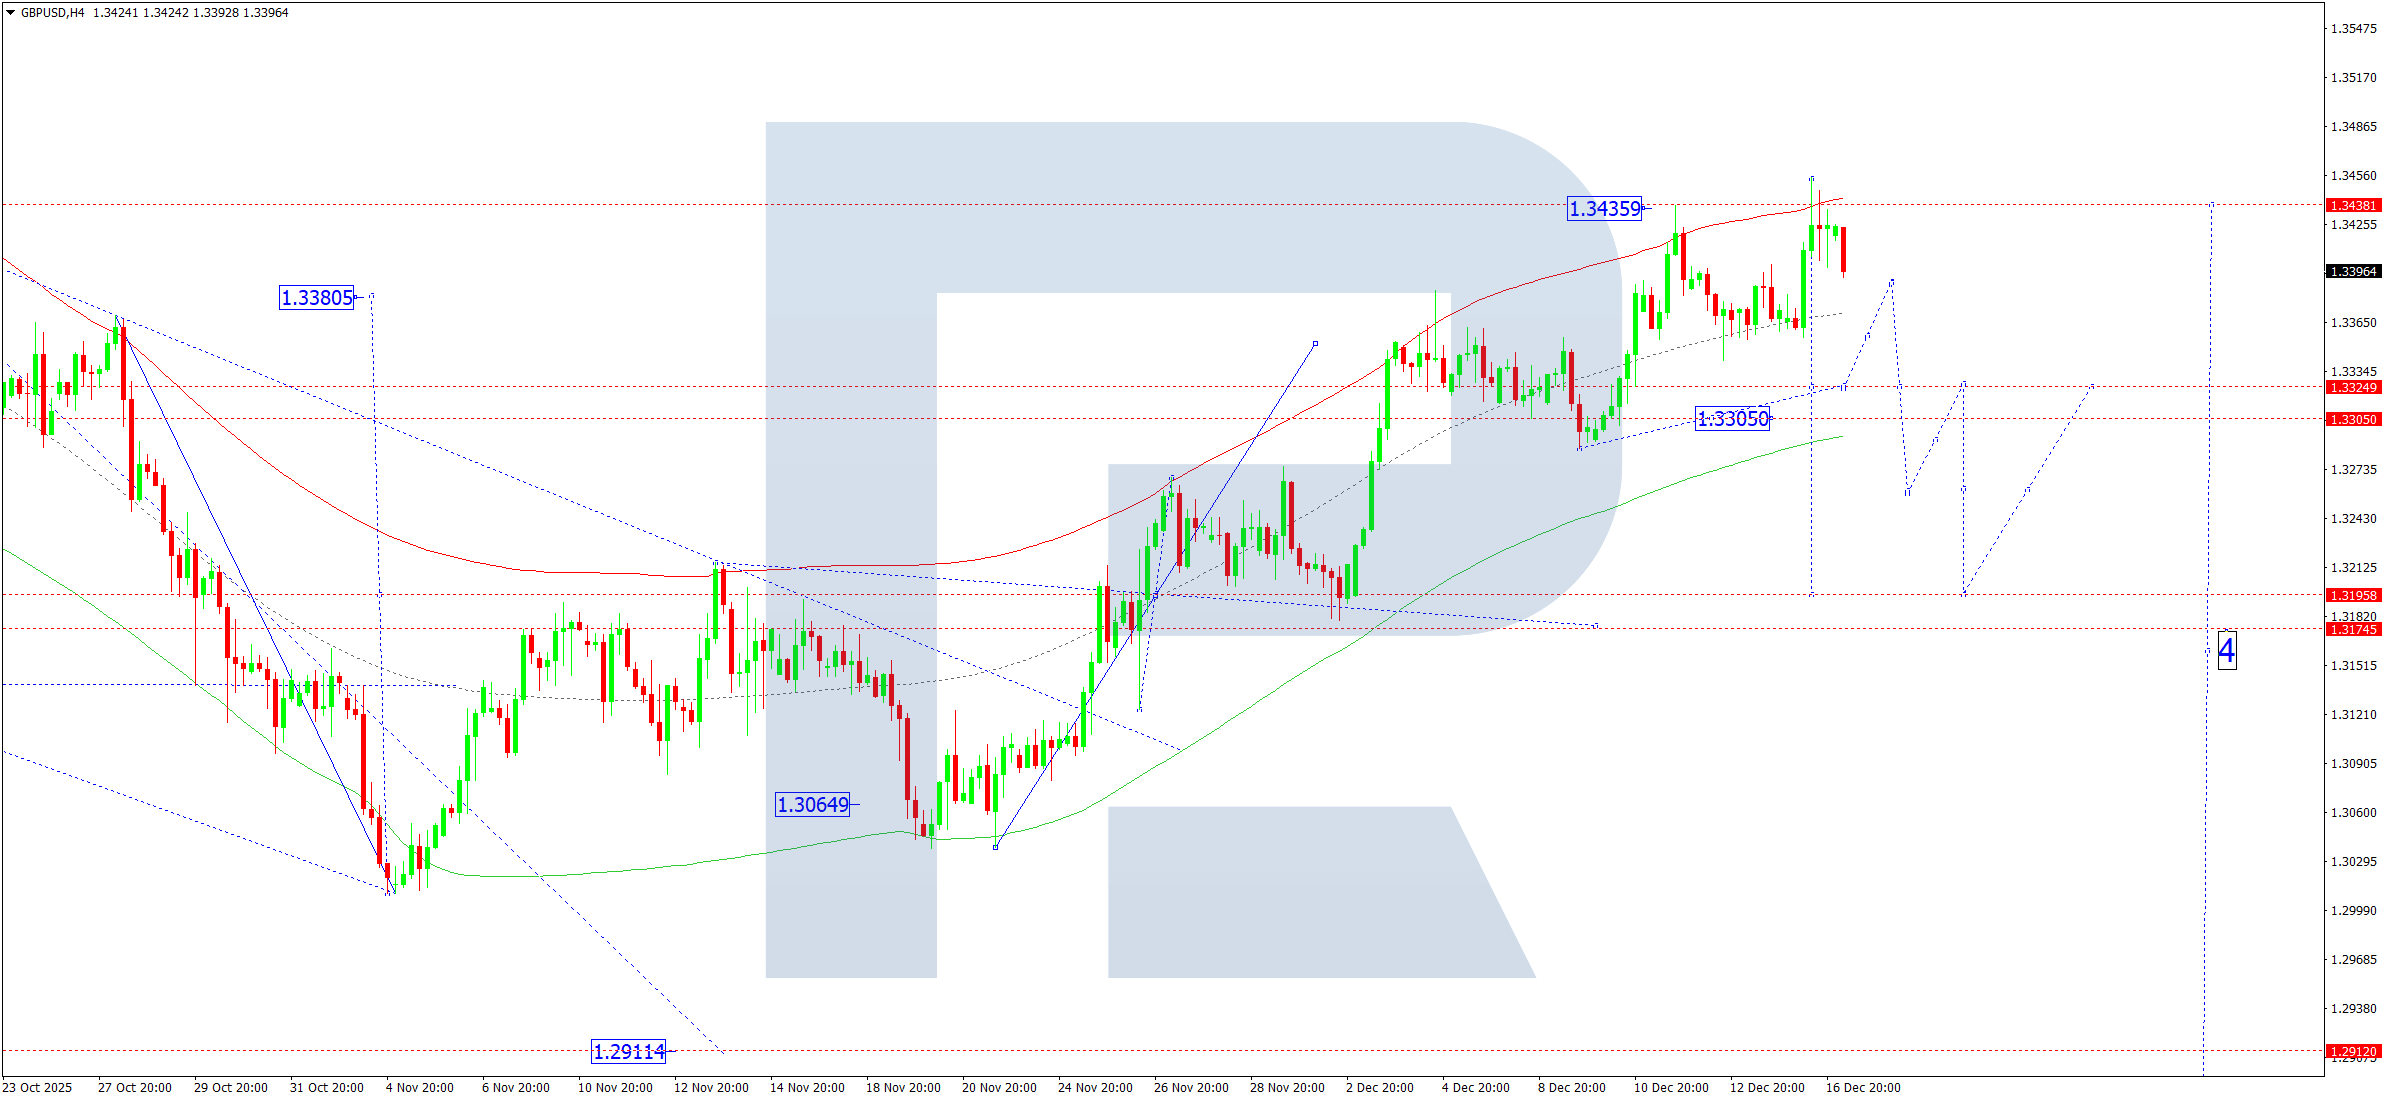
On the H4 chart, GBPUSD has expanded its consolidation range upward to 1.3454. Today, 17 December 2025, a downward move toward the lower boundary at 1.3333 is anticipated. A breakdown below this level could open the way toward 1.3190, which represents the first downside objective.
Technically, this scenario is confirmed by the Elliott Wave structure and the Matrix of the downward wave, with a key rotation level at 1.3190. The market is likely to continue its corrective decline toward the lower boundary of the Price Envelope at 1.3333. Once this move completes, a rebound toward the central line at 1.3390 cannot be ruled out.
GBPUSD indicators point to continued downside pressure toward 1.3333.
AUDUSD Forecast
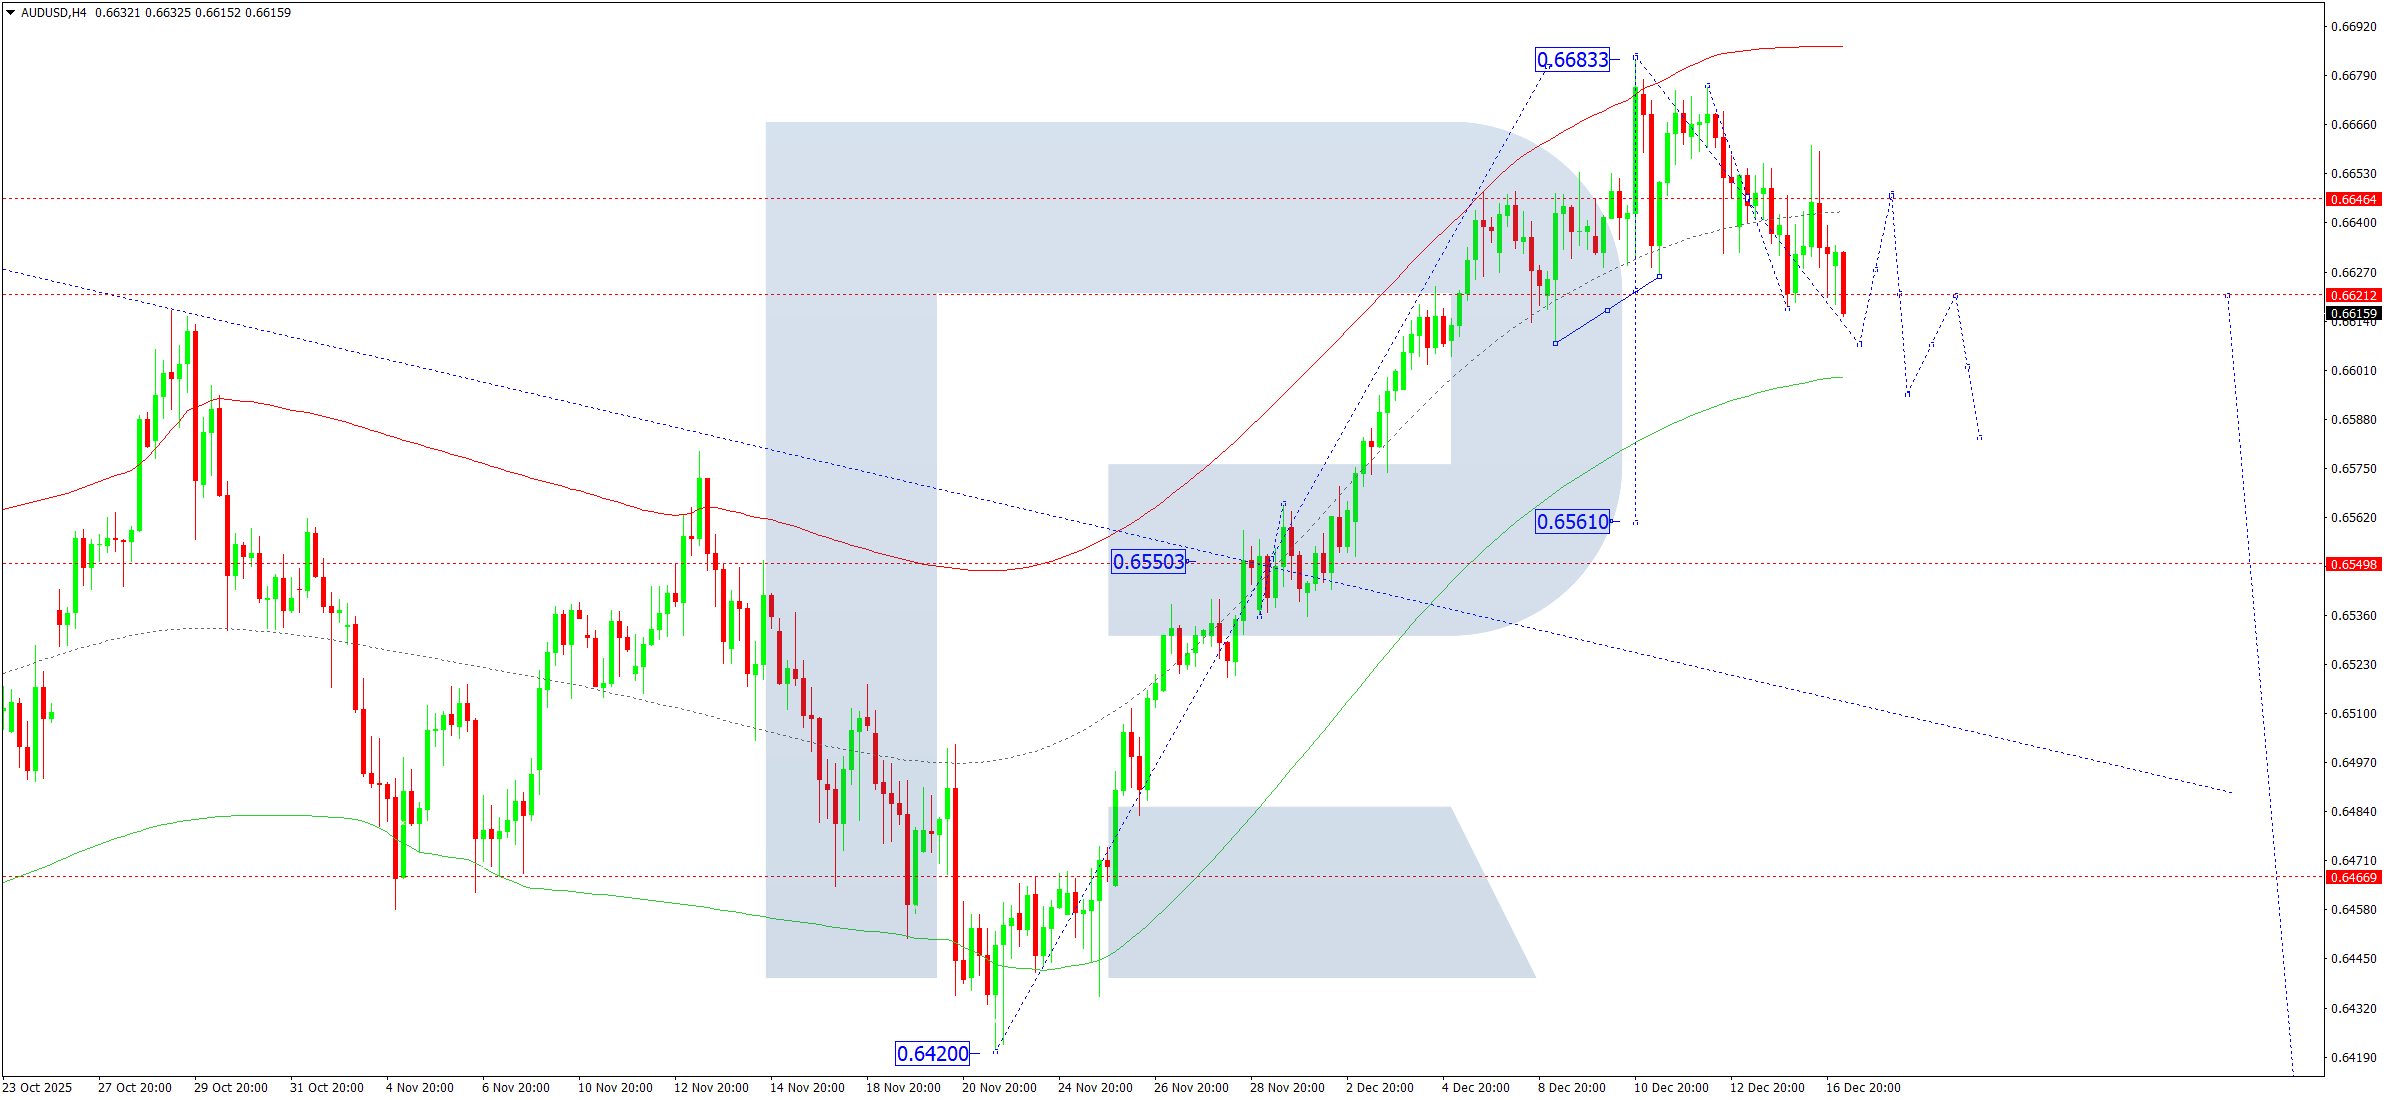
On the H4 timeframe, AUDUSD has завершed an upward leg reaching 0.6656. On 17 December 2025, a corrective decline toward 0.6600 is expected. If this support is broken, the movement may extend toward 0.6561, which is the first downside target.
This outlook is supported by the Elliott Wave structure and the Matrix of the upward wave, with a rotation center at 0.6555. The price has recently reached the upper boundary of the Price Envelope at 0.6683, from where a decline toward the lower boundary at 0.6600 is anticipated.
AUDUSD indicators favor a decline toward 0.6600.
USDCAD Forecast
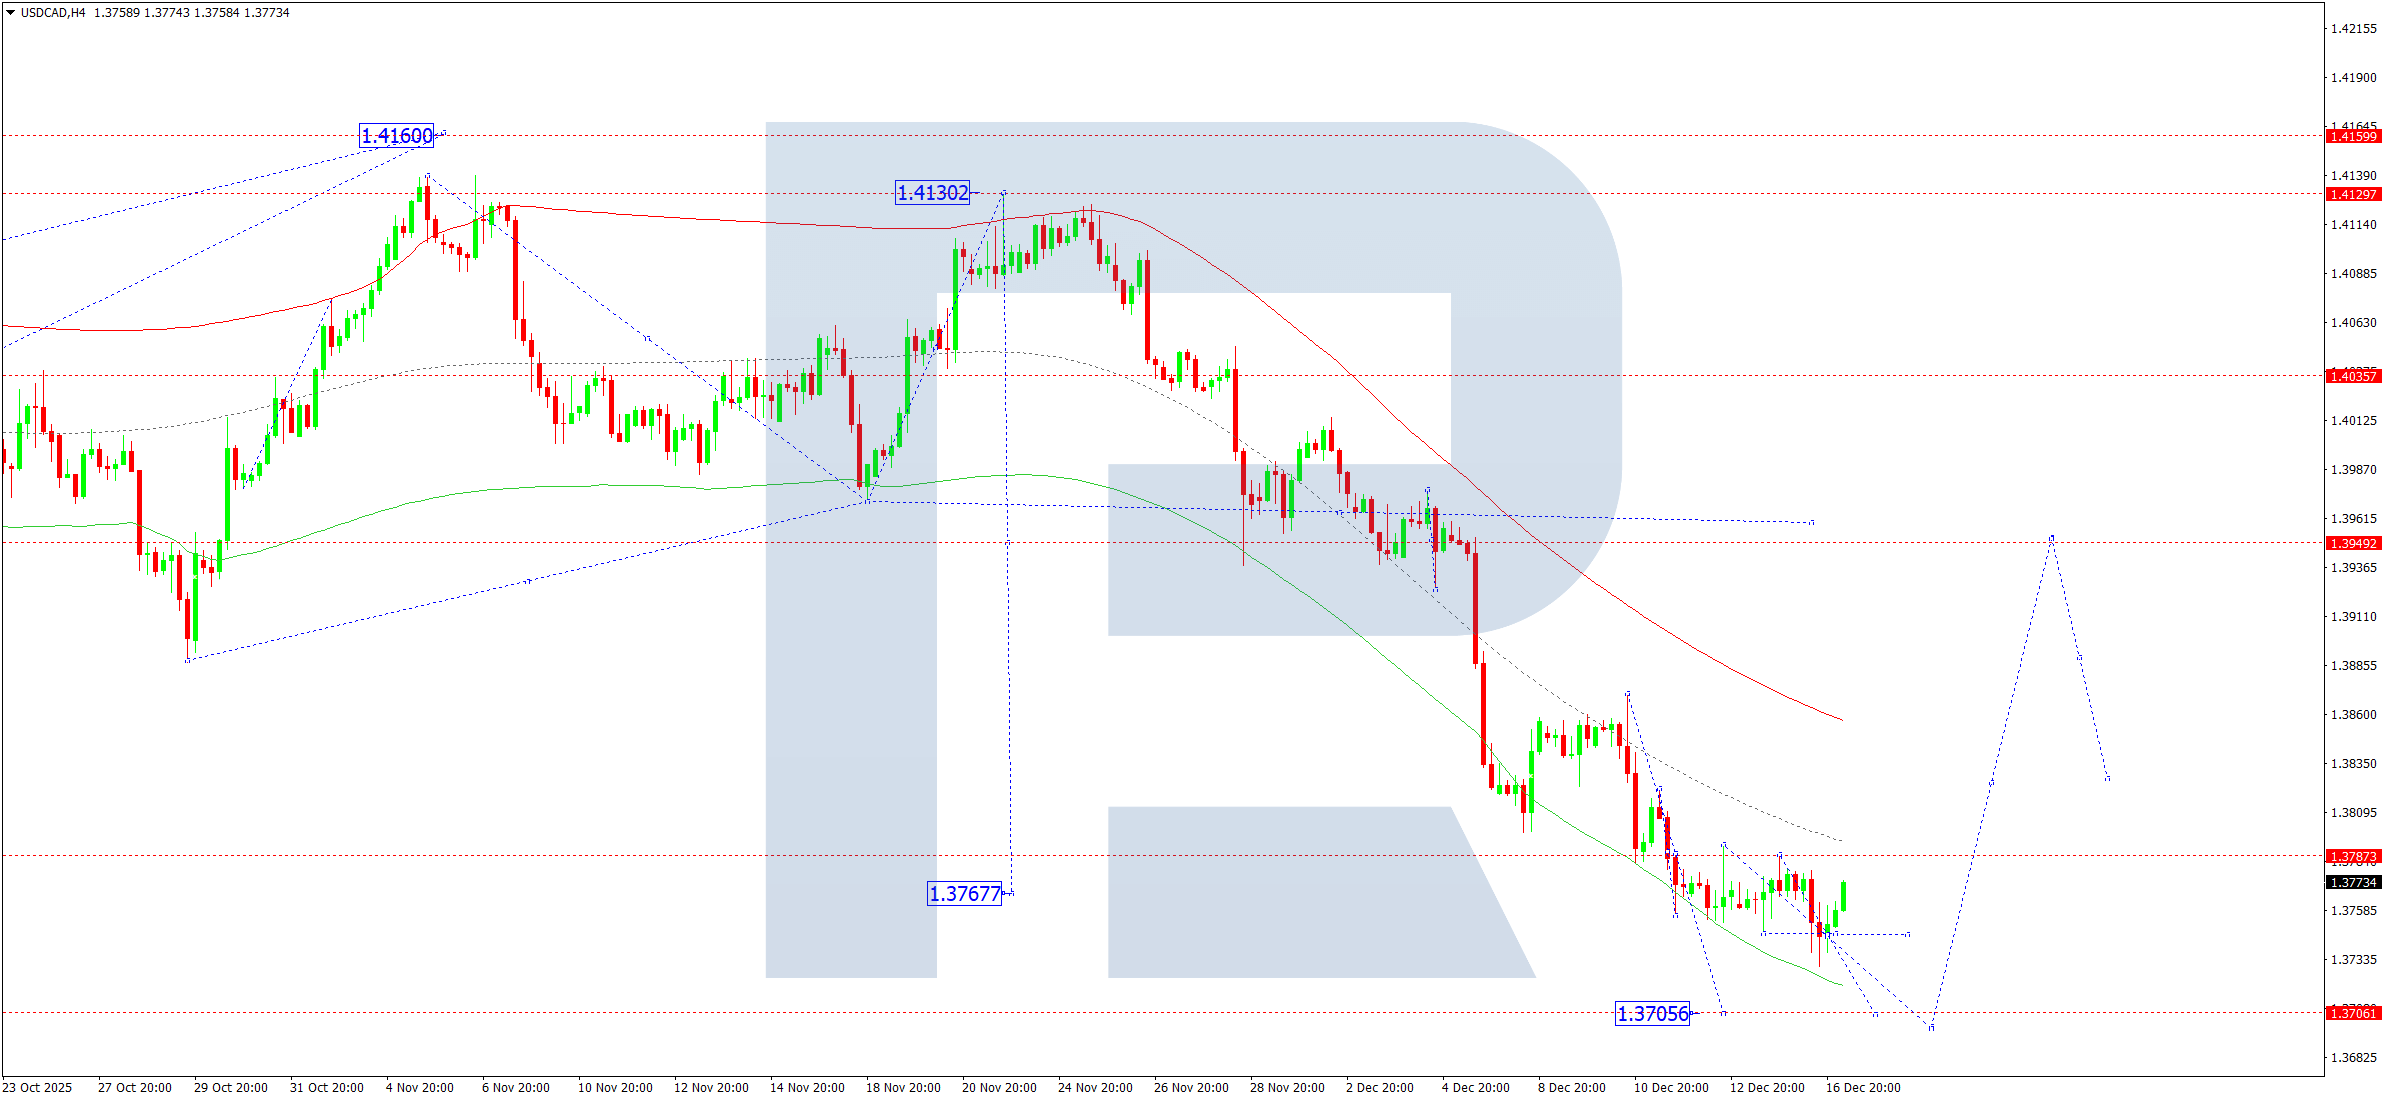
On the H4 chart, USDCAD is forming a tight consolidation range around 1.3787, which has now expanded downward to 1.3737. Today, 17 December 2025, a rebound toward 1.3787 is expected. A break below the range could extend the decline toward 1.3700, while an upside breakout would increase the likelihood of growth toward 1.3939.
This scenario aligns with the Elliott Wave analysis and the Matrix of the downward wave, with a key rotation level at 1.3939. The market is currently developing a corrective move toward the lower boundary of the Price Envelope at 1.3767. After the correction completes, the probability of a new upward wave toward 1.3939 increases.
USDCAD indicators suggest monitoring a potential move toward 1.3939 after the correction.
XAUUSD Forecast
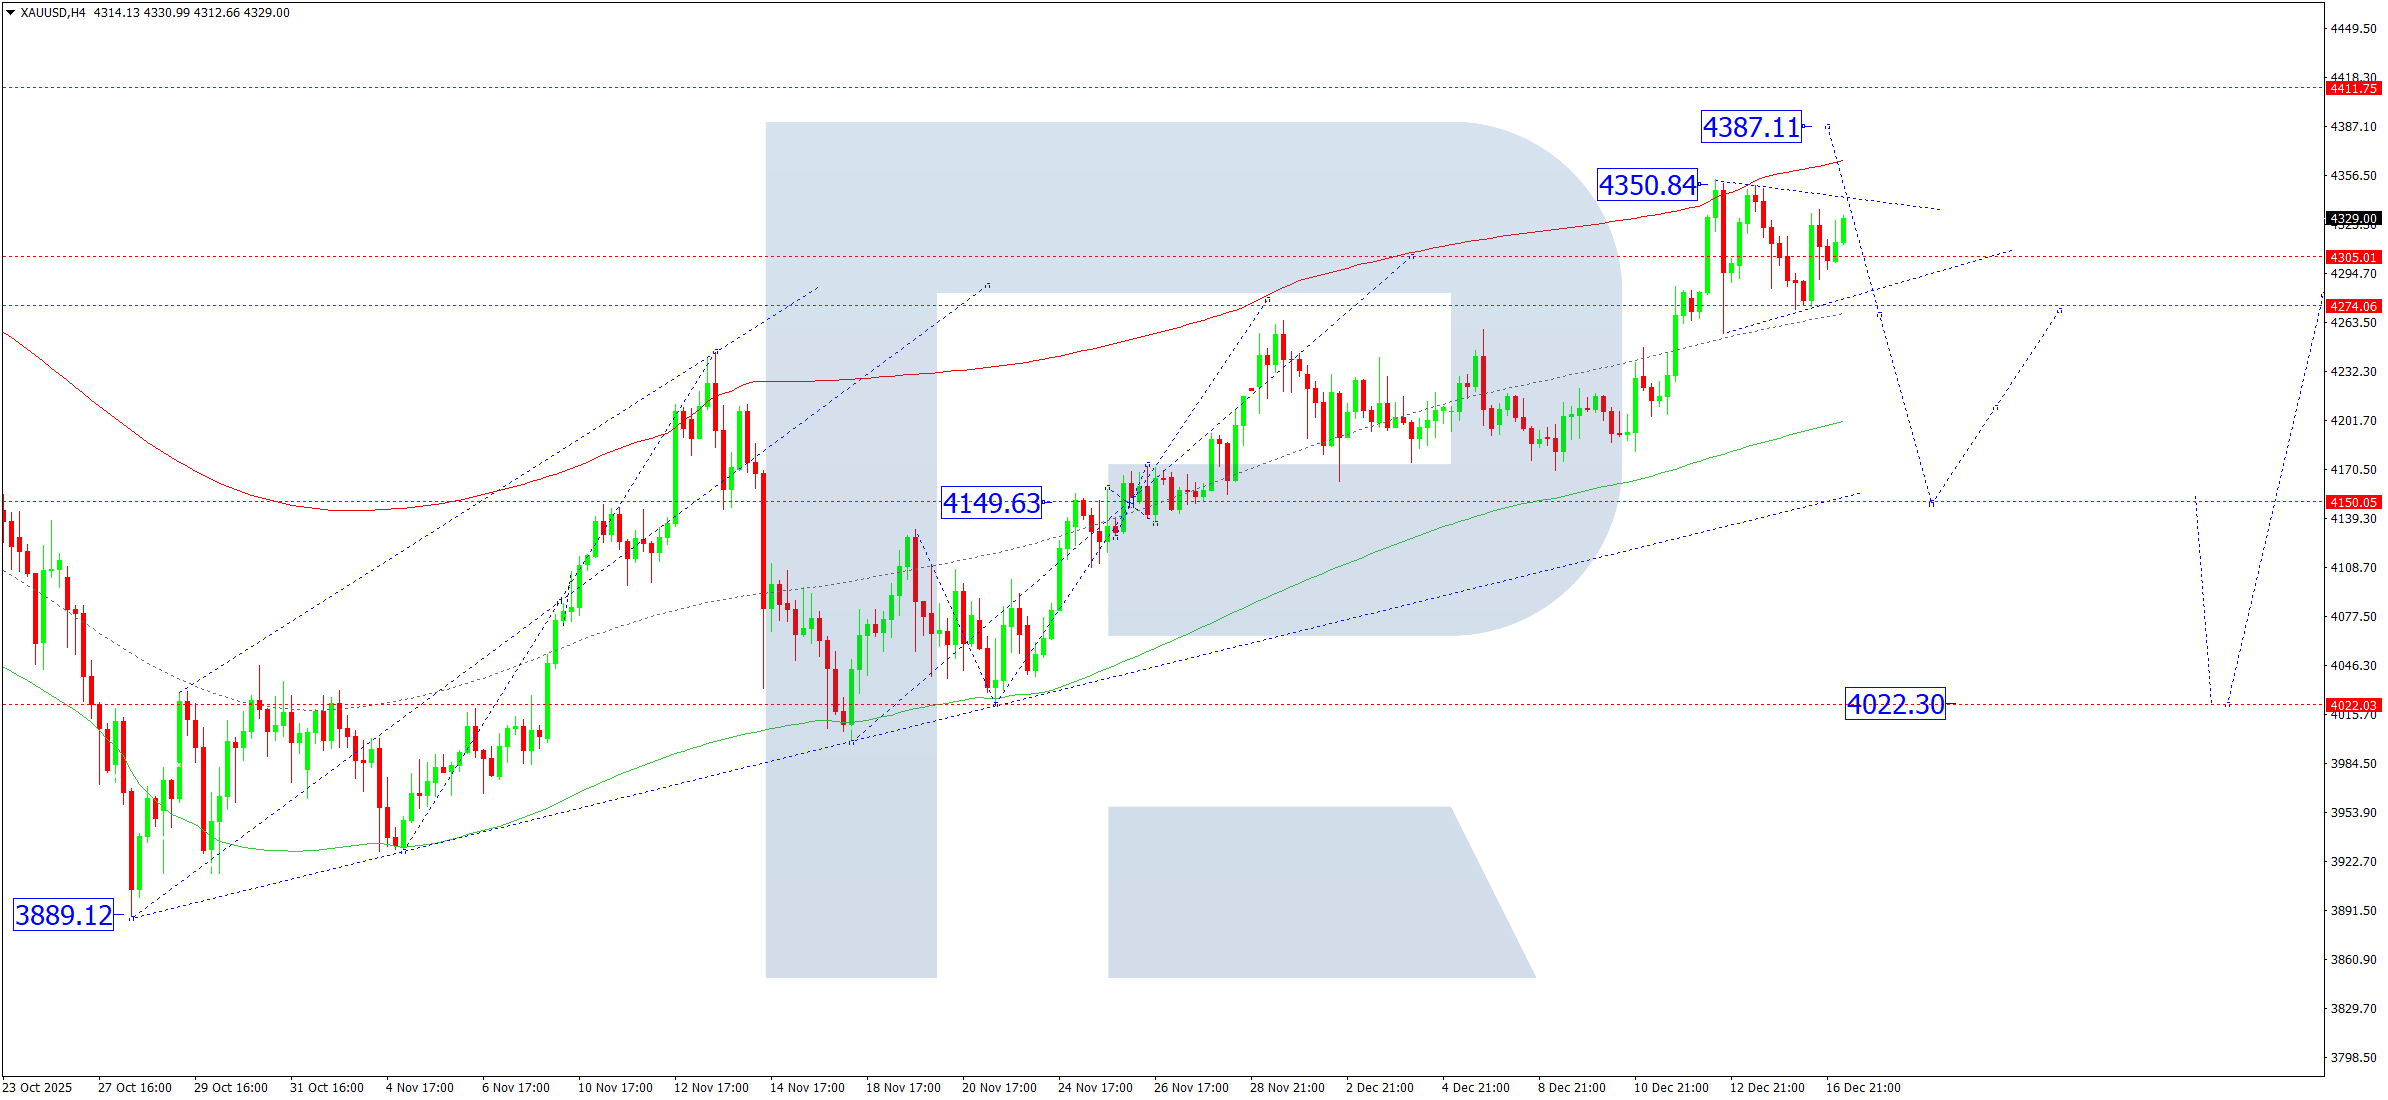
On the H4 timeframe, XAUUSD remains in a consolidation phase around the 4,300 level. On 17 December 2025, an upside breakout could trigger a rally toward 4,400, while a downside breakout would open the way for a correction toward 4,150.
Technically, this outlook is confirmed by the Elliott Wave structure and the Matrix of the upward wave, with a rotation center at 4,150. The market continues to develop a fifth upward wave toward the upper boundary of the Price Envelope near 4,400. After reaching this area, a corrective move toward the central line at 4,150 is likely.
XAUUSD indicators point to both a possible advance toward 4,400 and a corrective decline toward 4,150.
Brent Forecast
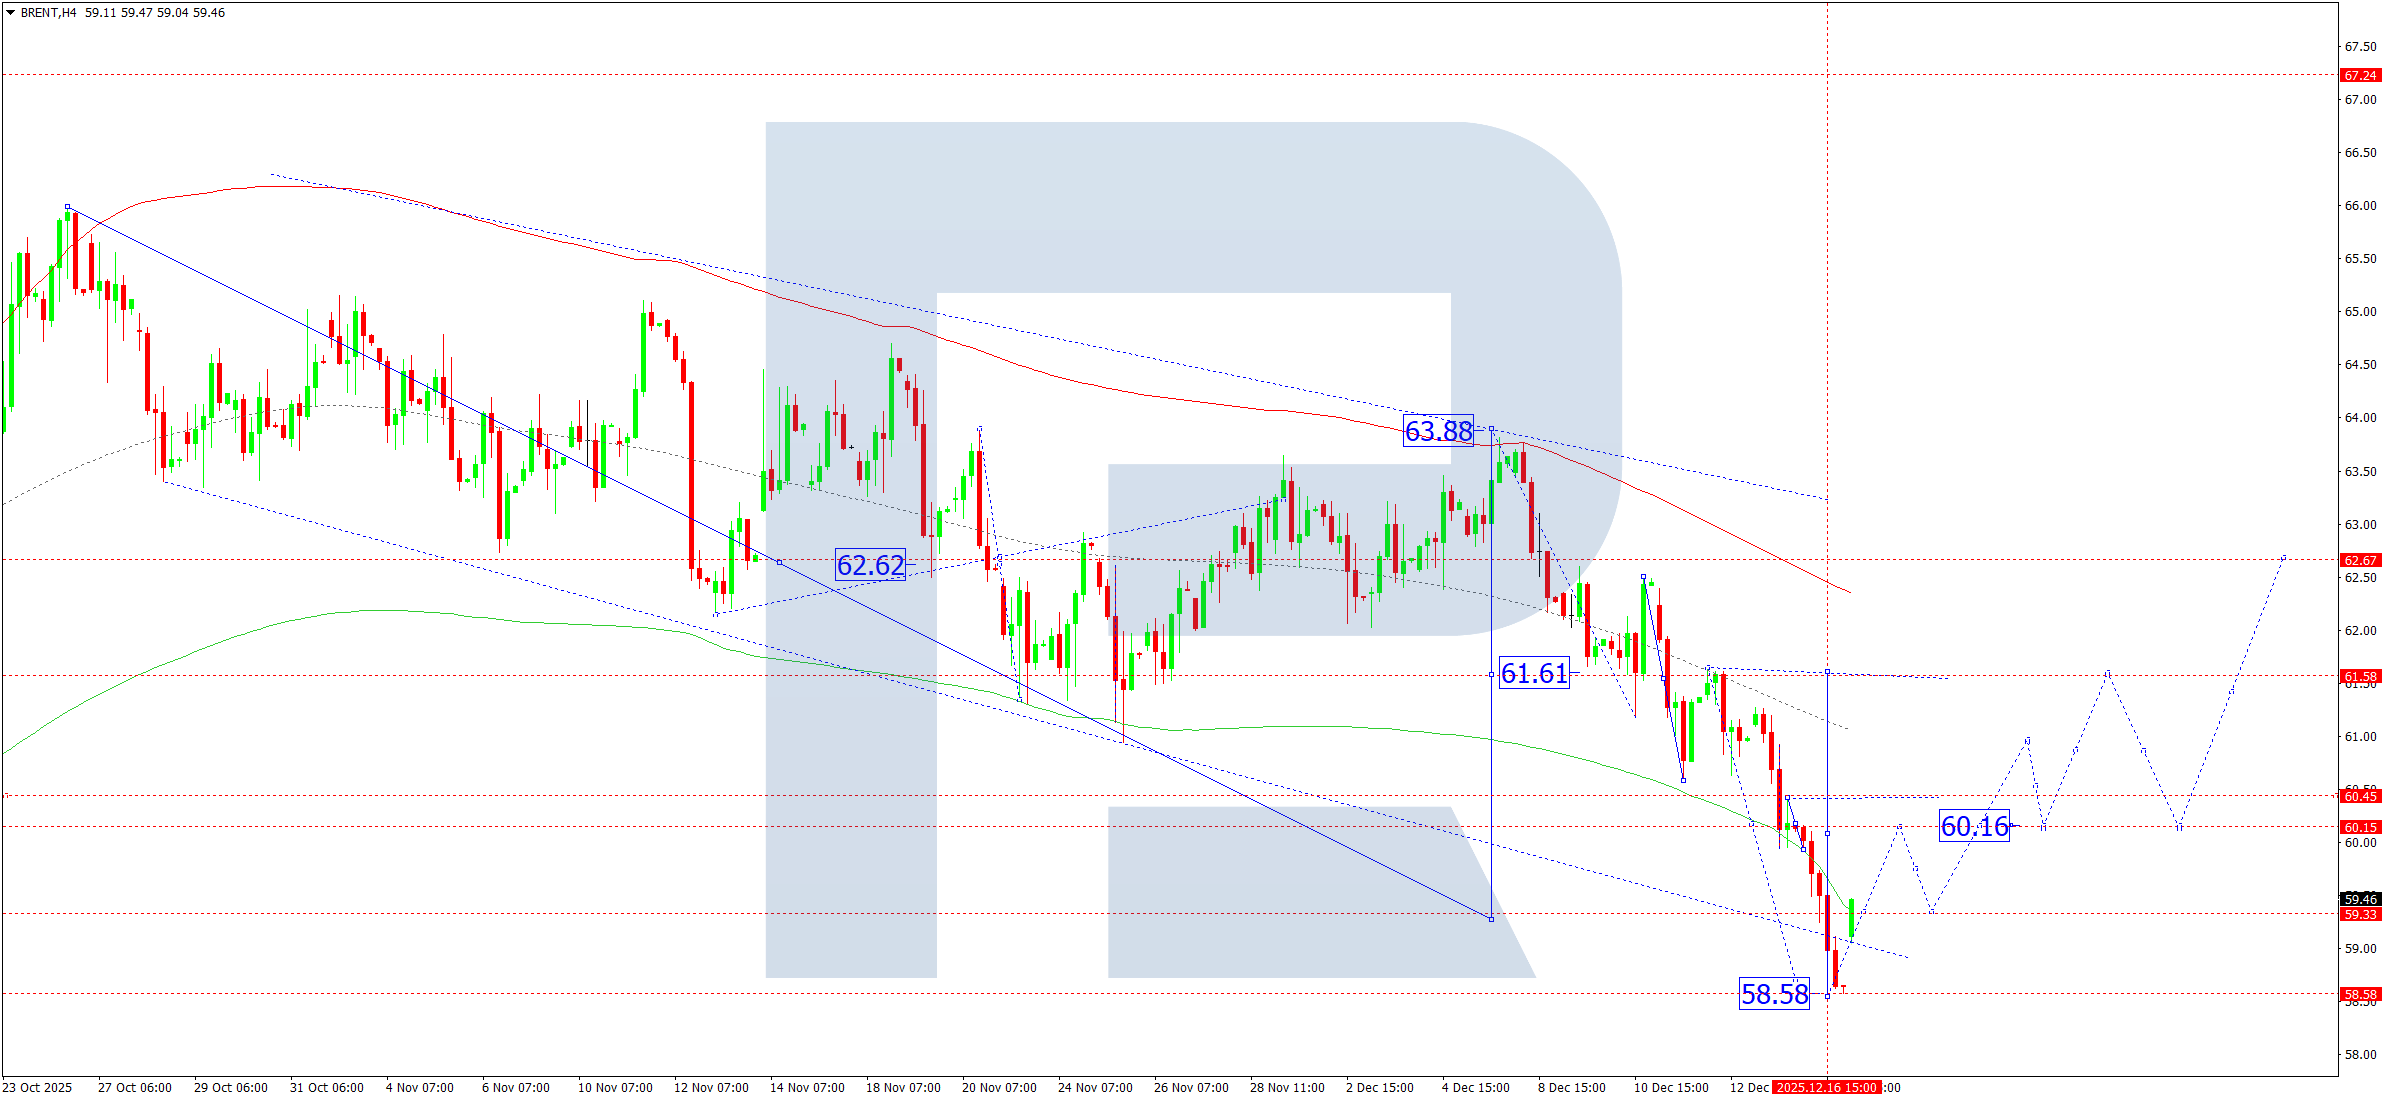
On the H4 chart, Brent crude has completed a downward move to 58.58. Today, 17 December 2025, an upward impulse is developing toward 60.16. After that, a pullback toward 59.40 may occur, followed by renewed growth toward 61.00, with potential continuation to 61.61 as the first major upside target.
This scenario is supported by the Elliott Wave structure and the Matrix of the downward wave, with a rotation center at 62.62. The market is currently forming an upward impulse toward the central line of the Price Envelope at 60.16. A breakout above this level would increase the probability of further growth toward the upper boundary at 61.61.
Brent indicators suggest upside potential toward 60.16 and 61.61.
Risk Warning
Past trading performance does not guarantee future results. Trading involves risk, and market conditions may change rapidly.
Leave a Reply