
Daily technical analysis and forecast for 18 December 2025
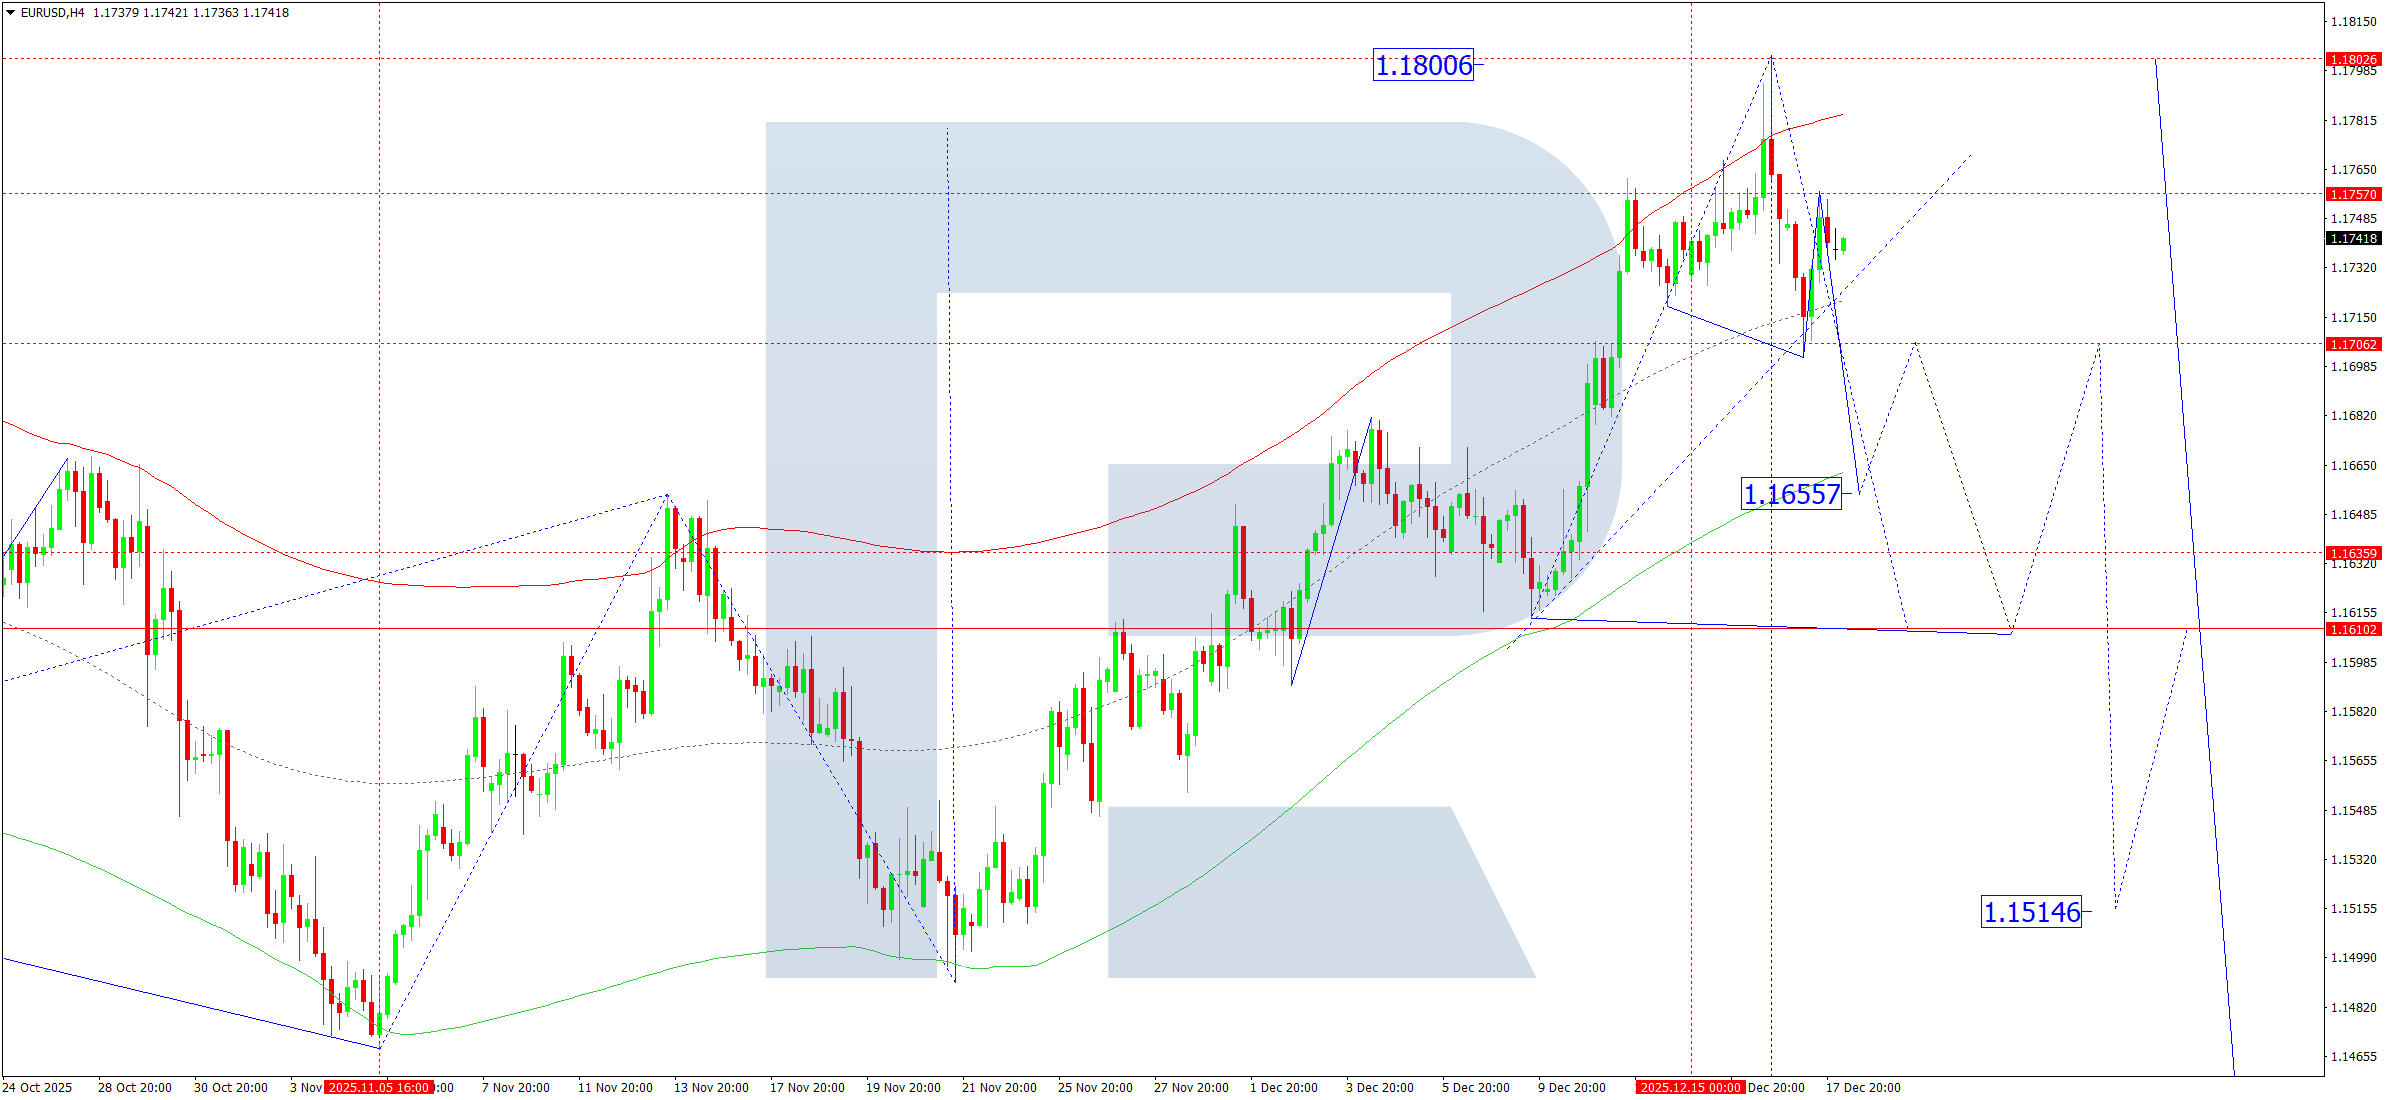
EURUSD Forecast
On the H4 chart, EURUSD has completed a bearish impulse down to 1.1702, followed by a corrective rebound towards 1.1757. Today, 18 December 2025, the primary scenario suggests a renewed decline towards 1.1707. A confirmed break below this level would open the way for further downside movement towards 1.1655, which stands as a near-term target.
Subsequently, the market may attempt a corrective pullback to 1.1707 (a potential retest from below), after which the bearish movement could resume towards 1.1610.
From a technical standpoint, this outlook is supported by the Elliott Wave structure and the downward wave Matrix with a key rotation level at 1.1707. The recent decline reached the central line of the Price Envelope at 1.1702, and the current correction appears to be nearing completion. A new bearish wave is expected to develop towards the lower boundary of the Price Envelope at 1.1655.
Technical indicators favor a continuation of the decline towards 1.1655.
Risk Warning: Past trading performance does not guarantee future results.
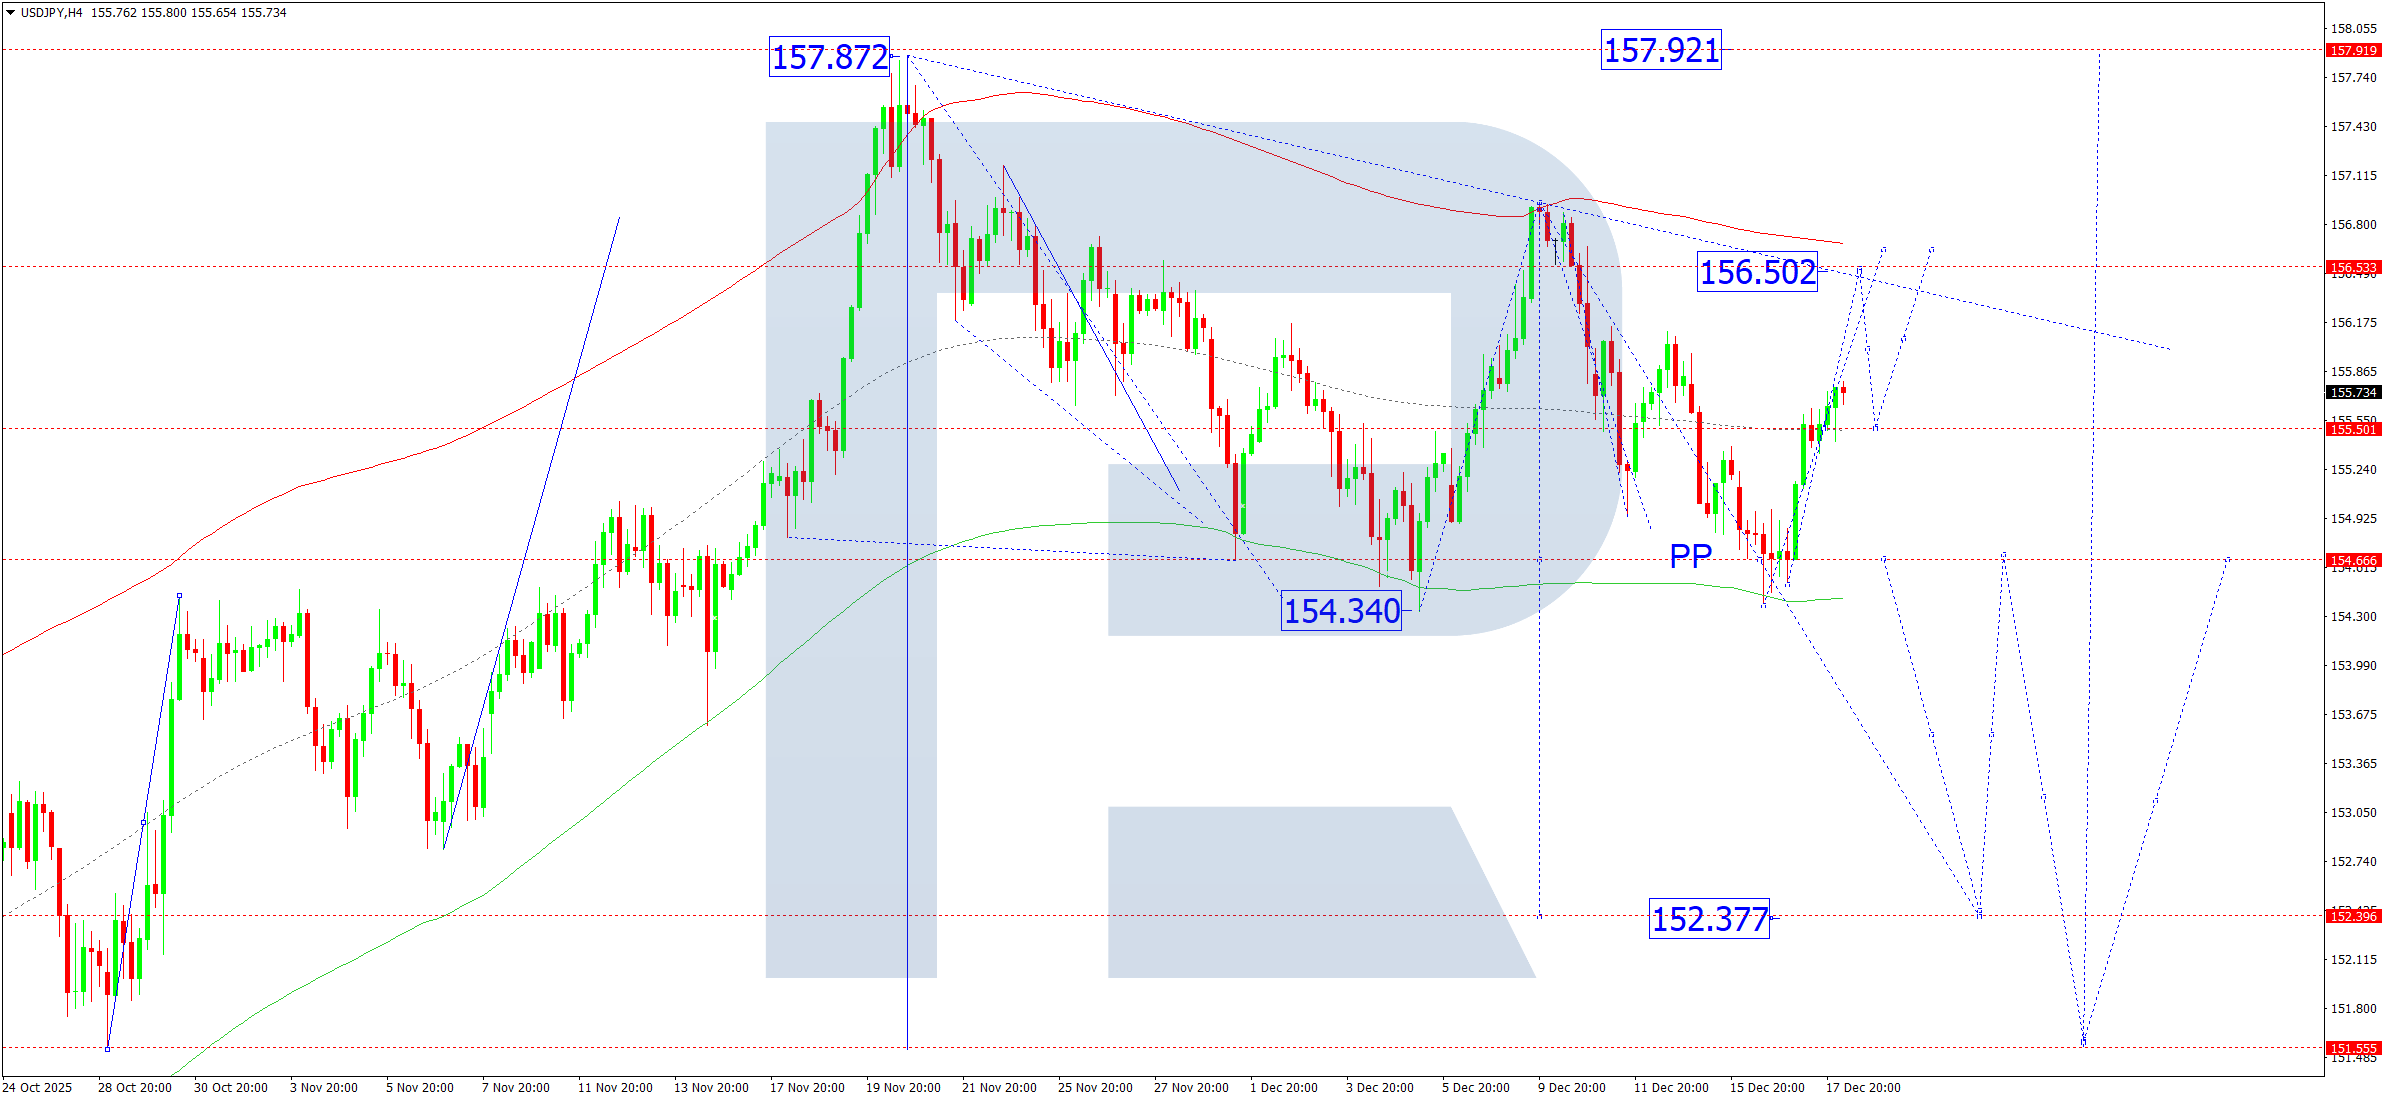
USDJPY Forecast
On the H4 timeframe, USDJPY has завершed an upward wave reaching 155.55, followed by the formation of a consolidation range near this level. For today, 18 December 2025, the market is expected to break higher from this range, targeting 156.50.
After reaching this level, a corrective decline towards 155.50 remains possible.
This scenario is confirmed by the Elliott Wave structure and the upward wave Matrix with a rotation centre at 155.50, which remains a key technical level. Currently, price action is developing towards the upper boundary of the Price Envelope at 156.50, after which a correction towards its central line at 155.50 may occur.
Technical indicators point to potential growth towards 156.50, followed by a pullback to 155.50.
Risk Warning: Past trading performance does not guarantee future results.
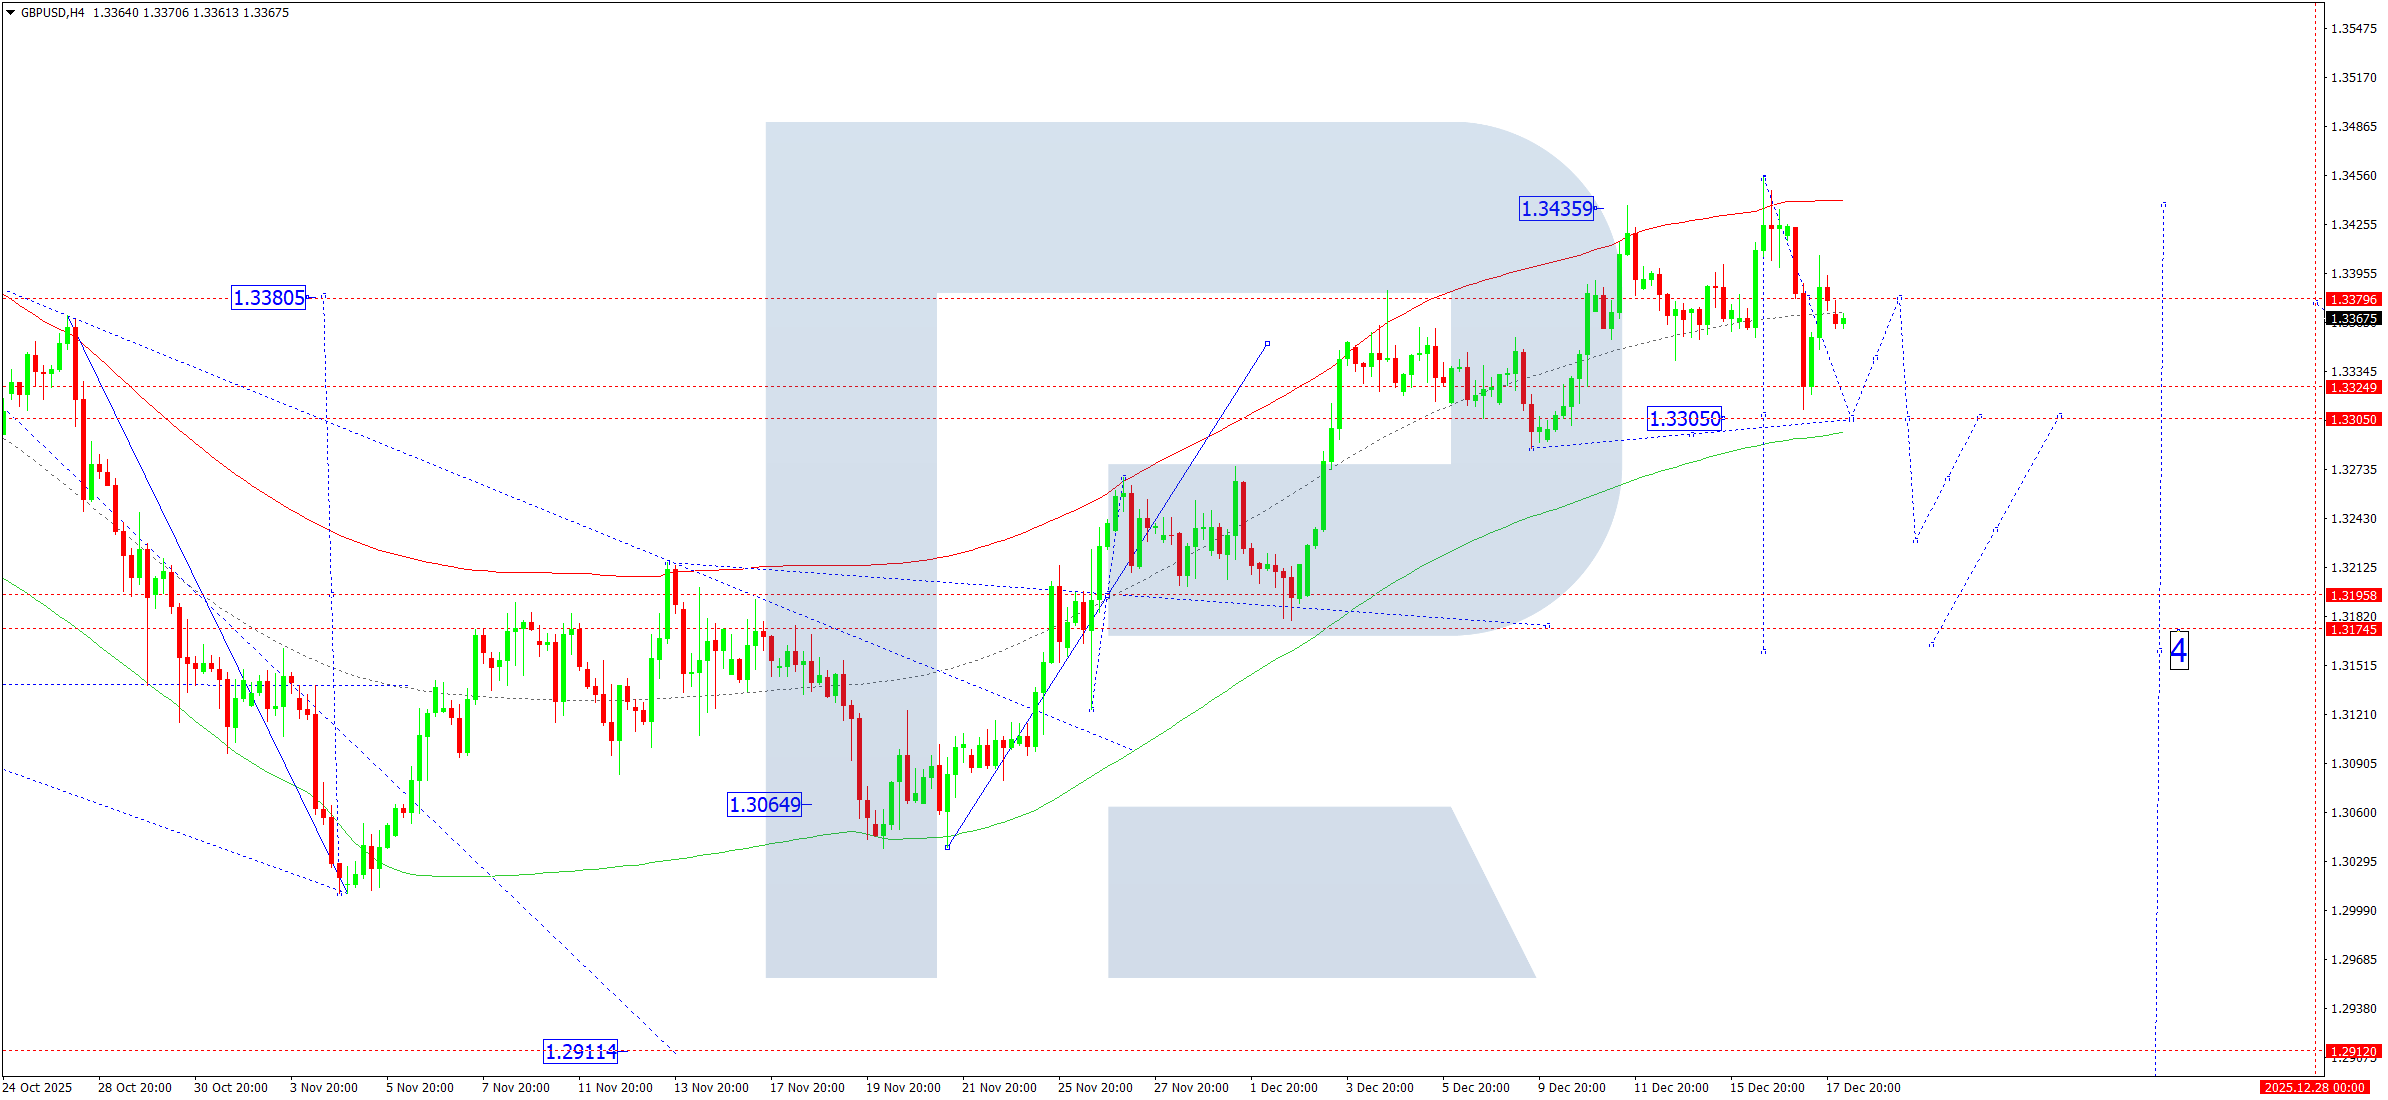
GBPUSD Forecast
On the H4 chart, GBPUSD continues to develop a bearish wave structure targeting 1.3305. Today, 18 December 2025, this level is expected to be tested.
Once reached, a corrective rebound towards 1.3370 is possible, after which the pair may resume its decline towards 1.3245, with a further extension towards 1.3170 if bearish momentum persists.
This outlook is supported by the Elliott Wave model and the downward wave Matrix, with a key rotation level at 1.3379. The market is currently moving towards the lower boundary of the Price Envelope at 1.3305. Upon completion of this wave, a corrective move towards the central line near 1.3379 cannot be ruled out.
Technical indicators support continued downside pressure towards 1.3305.
Risk Warning: Past trading performance does not guarantee future results.
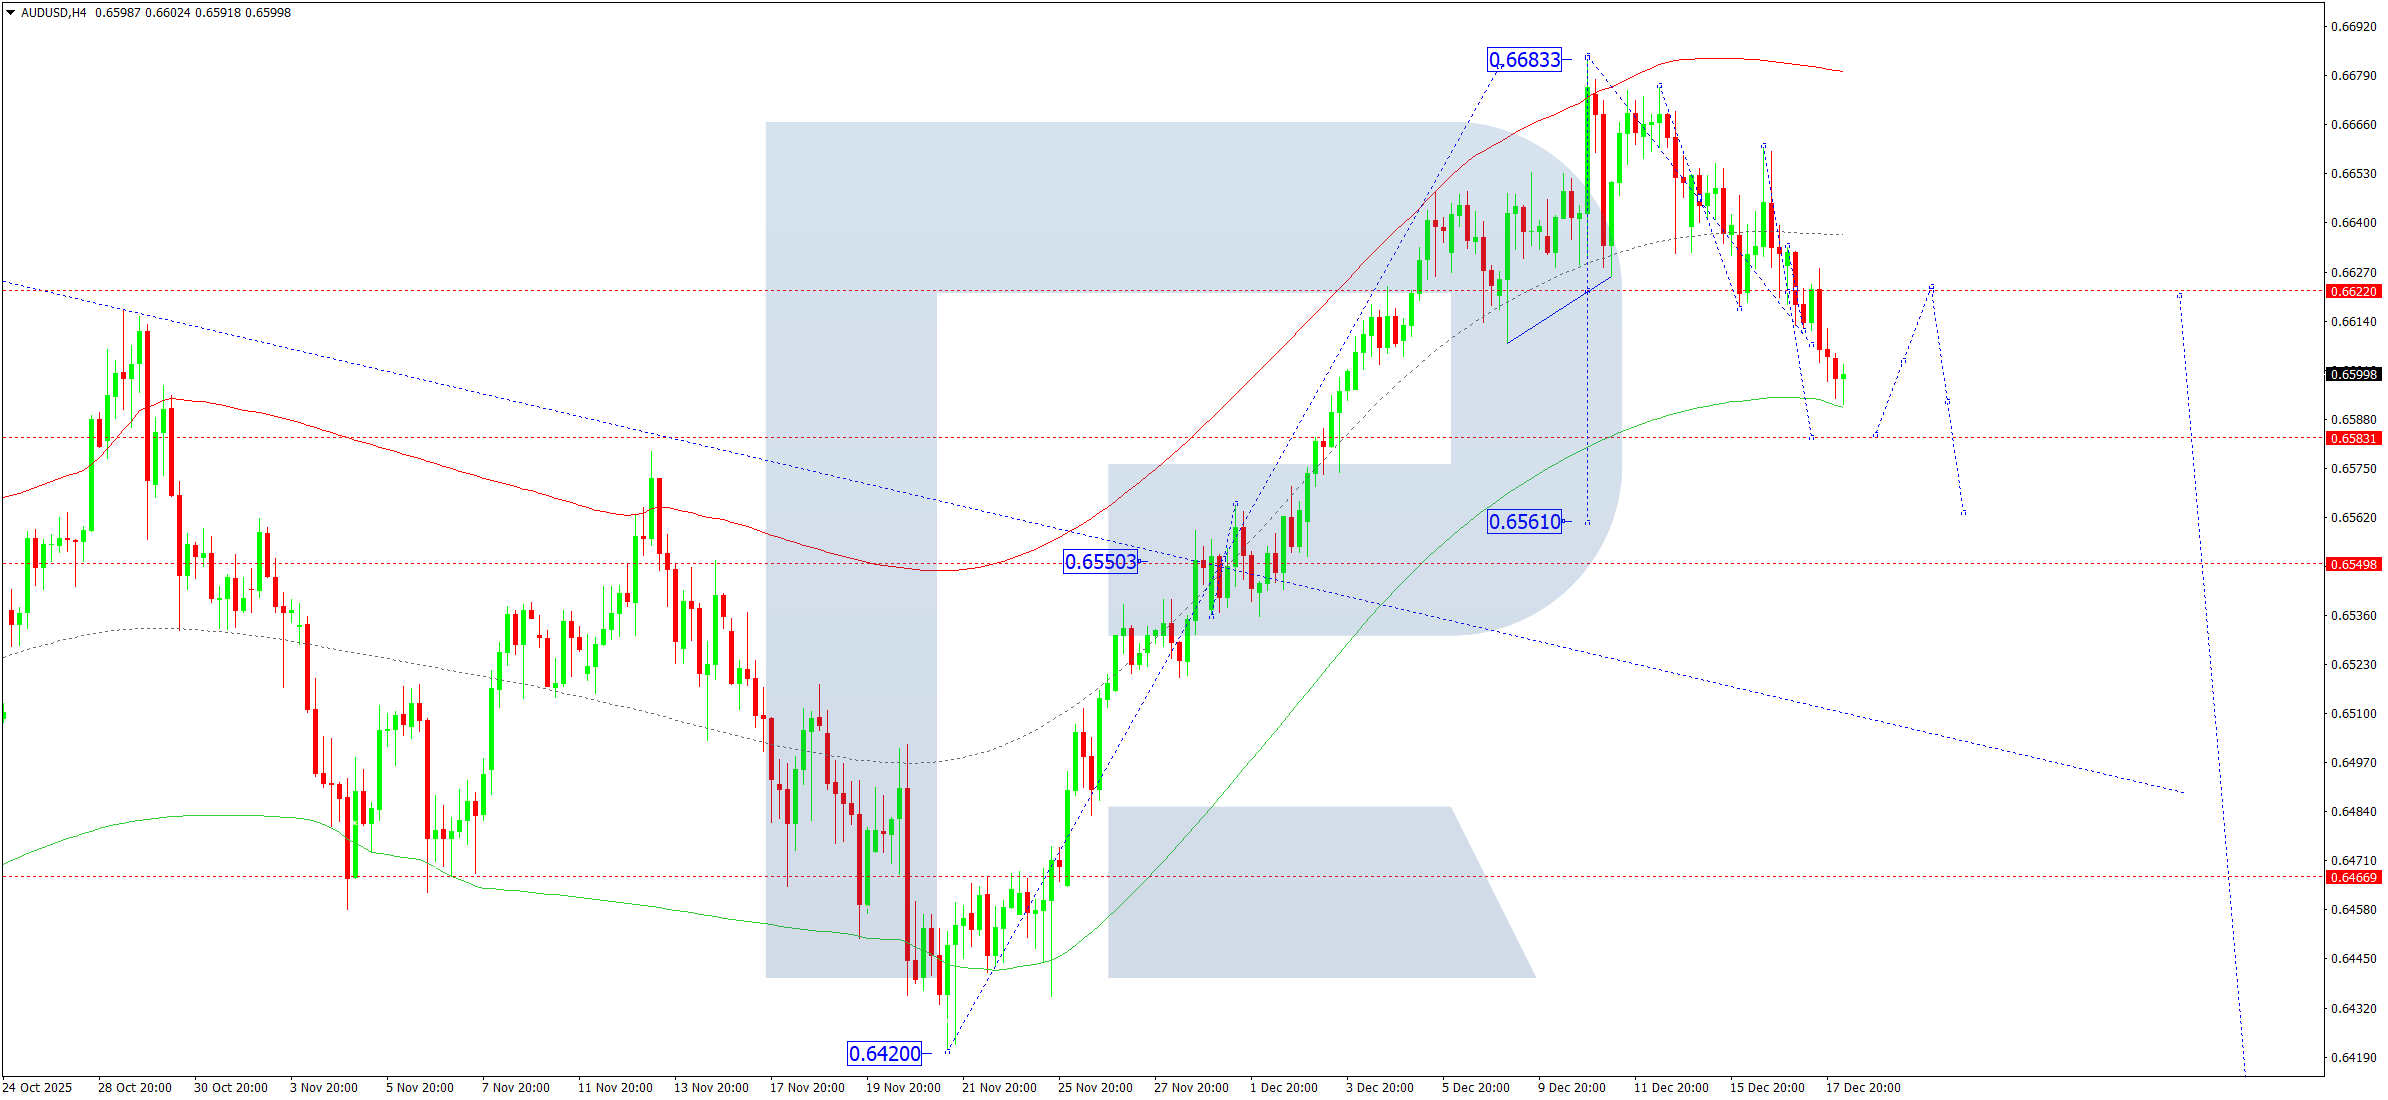
AUDUSD Forecast
On the H4 chart, AUDUSD has formed a consolidation zone around 0.6622. Following a downside breakout, the pair is now developing the third bearish wave. Today, 18 December 2025, a decline towards 0.6580 is expected.
A break below this level would expose the next downside target at 0.6561.
This scenario aligns with the Elliott Wave structure and the downward wave Matrix, with 0.6622 acting as the key rotation level. Currently, price action is directed towards the lower boundary of the Price Envelope at 0.6580.
Technical indicators suggest a high probability of further decline towards 0.6580.
Risk Warning: Past trading performance does not guarantee future results.
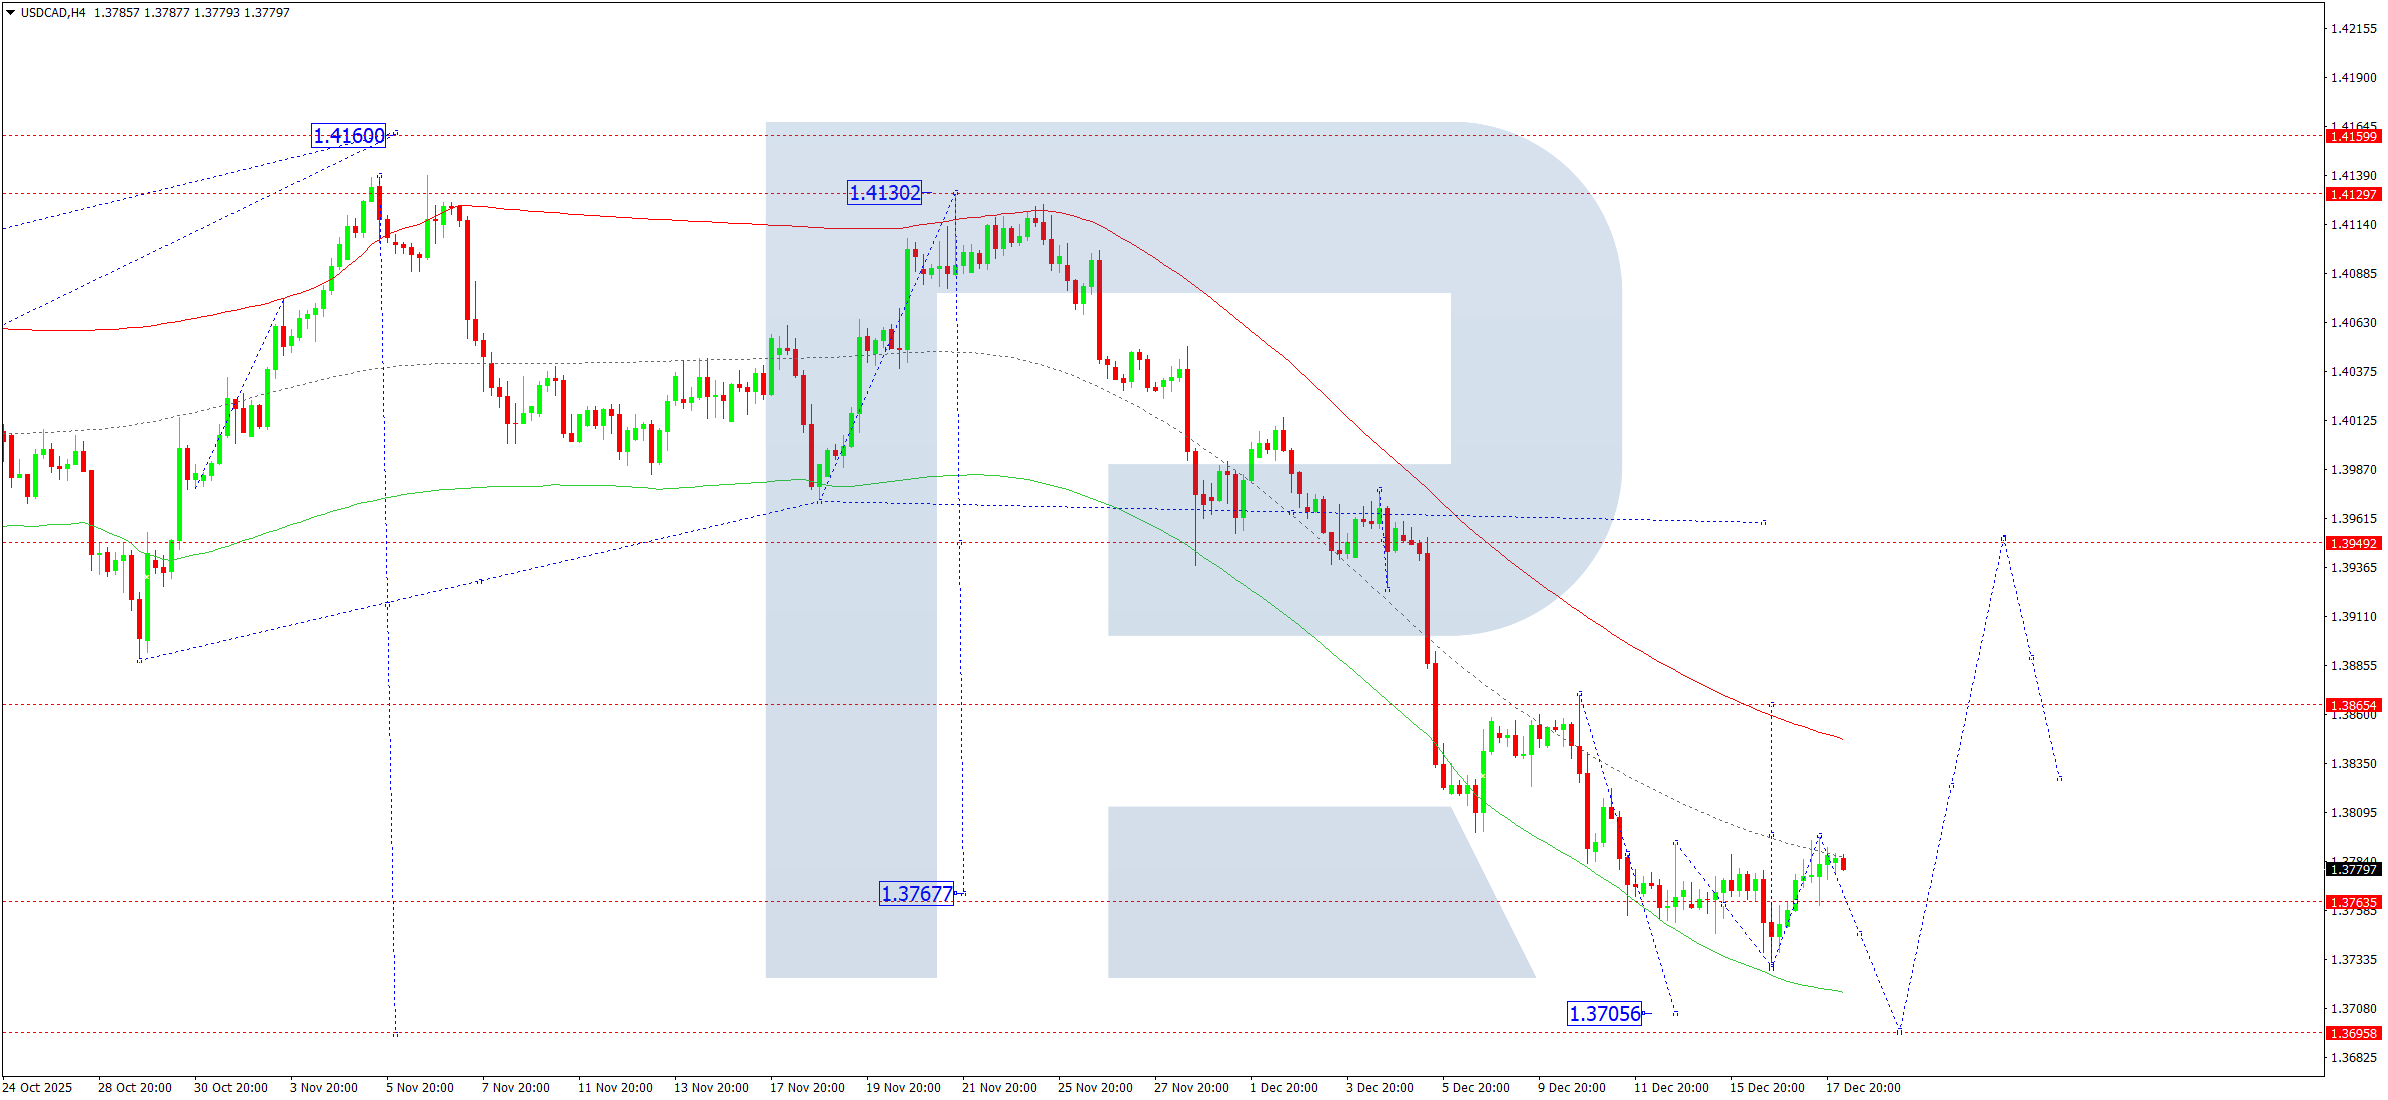
USDCAD Forecast
On the H4 chart, USDCAD is trading within a tight consolidation range near 1.3763. Today, 18 December 2025, a downside breakout could extend the move towards 1.3700.
Alternatively, an upside breakout would shift focus to a bullish wave targeting 1.3939.
Technically, this scenario is supported by the Elliott Wave structure and the Matrix of the broader wave, with 1.3939 serving as a key rotation level. The market is currently forming a corrective move towards the lower boundary of the Price Envelope at 1.3767. Once this correction is complete, a new upward wave towards 1.3939 may begin.
Technical indicators suggest the potential for a corrective phase before a renewed move higher towards 1.3939.
Risk Warning: Past trading performance does not guarantee future results.
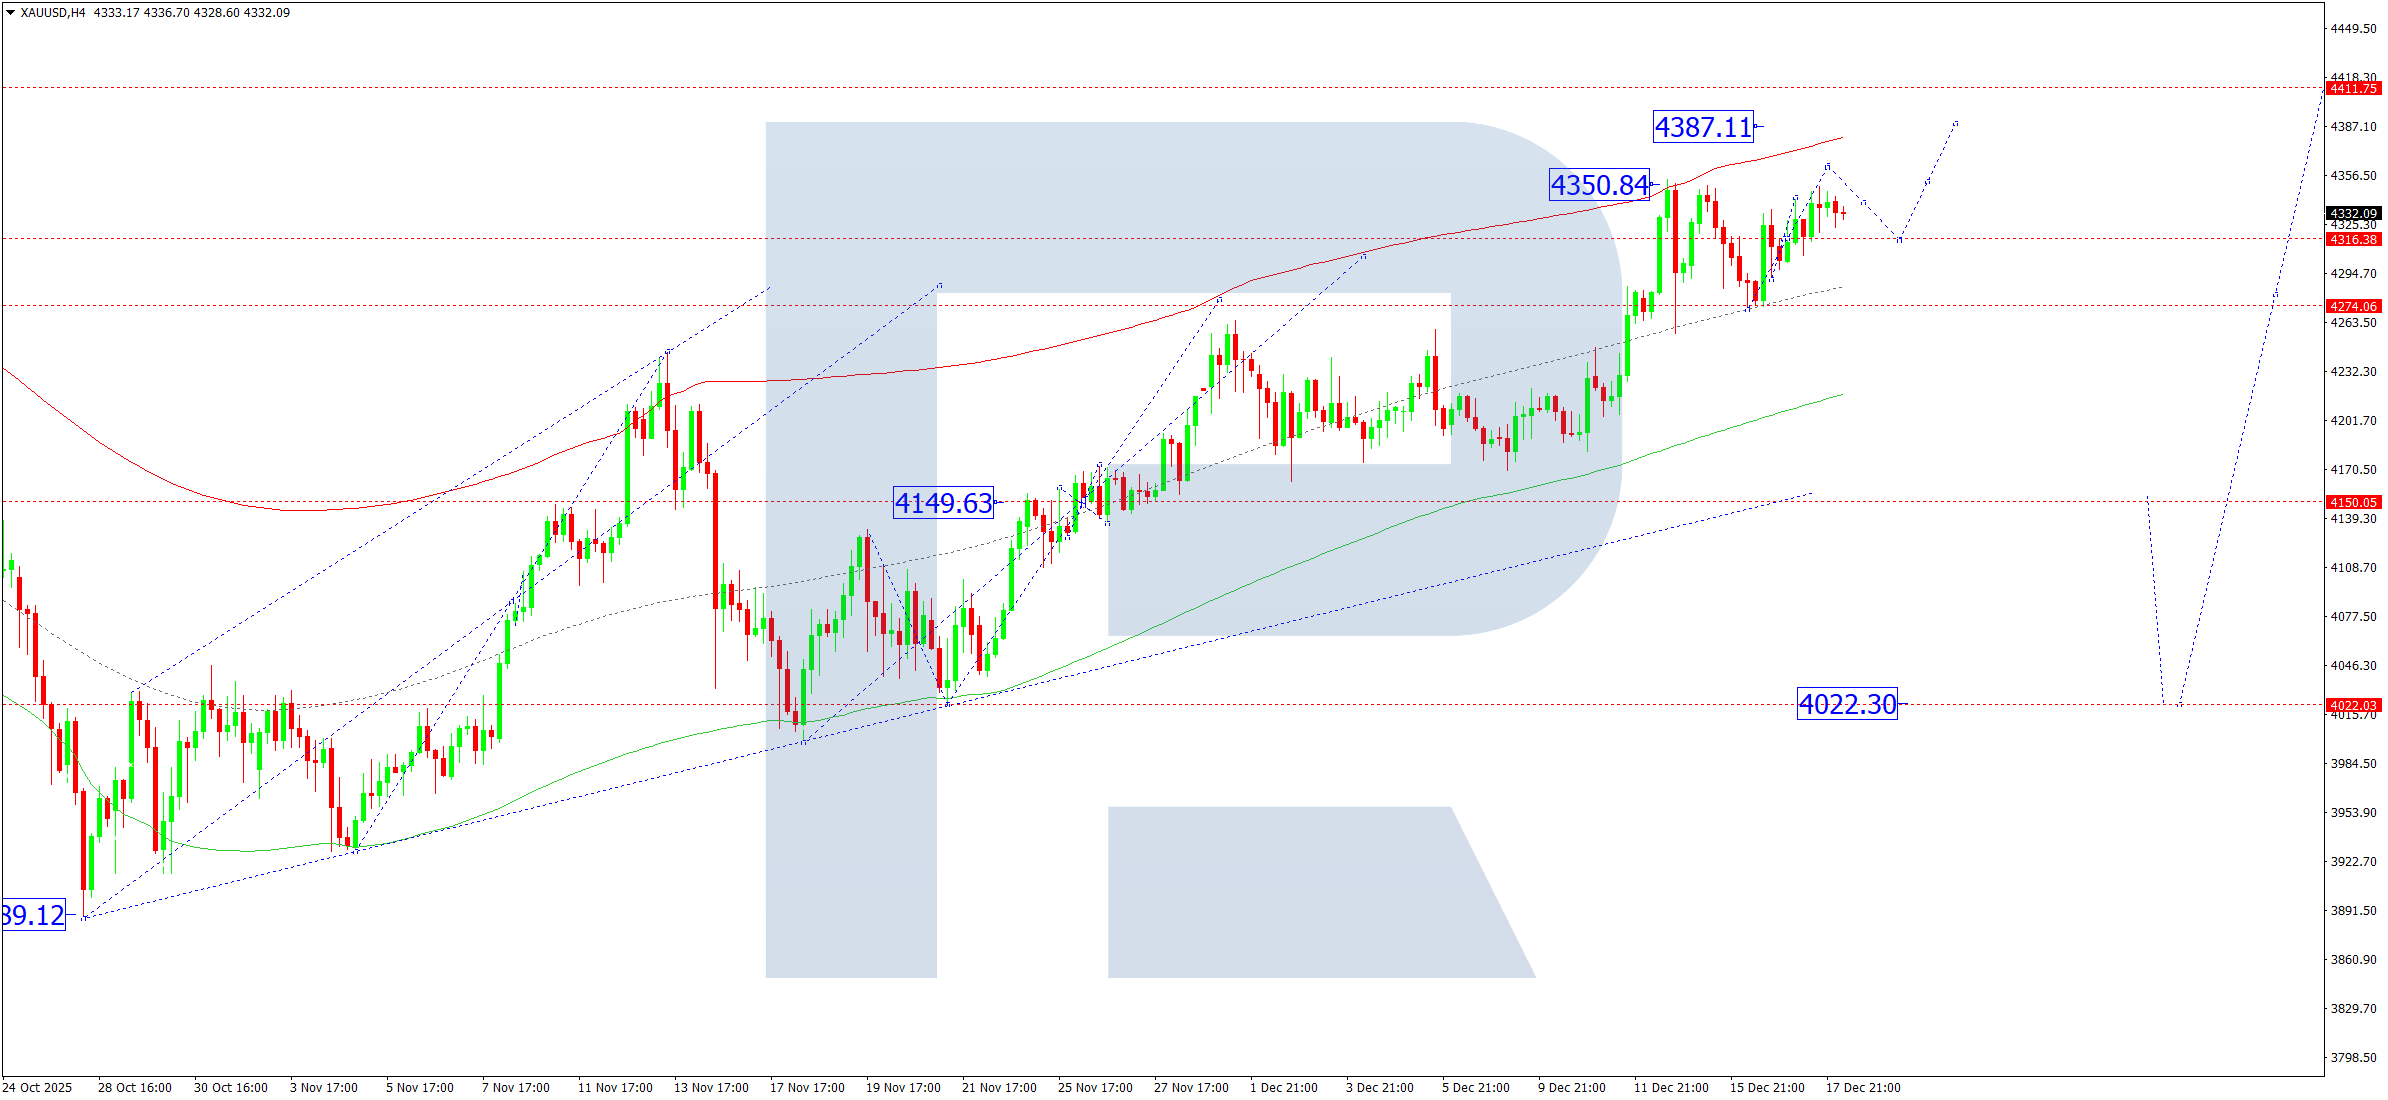
XAUUSD Forecast
On the H4 chart, gold (XAUUSD) continues to trade within a consolidation range around 4,316. Today, 18 December 2025, an upside breakout would open the way for growth towards 4,362.
A downside breakout, however, could trigger a corrective move towards 4,150, after which the broader bullish trend may resume, targeting 4,400.
This outlook is supported by the Elliott Wave structure and the upward wave Matrix, with 4,150 acting as the key rotation level. The market is currently developing the fifth bullish wave towards the upper boundary of the Price Envelope at 4,400. Upon reaching this zone, a corrective pullback towards the central line near 4,150 is possible.
Technical indicators favor continued upside movement towards 4,362.
Risk Warning: Past trading performance does not guarantee future results.
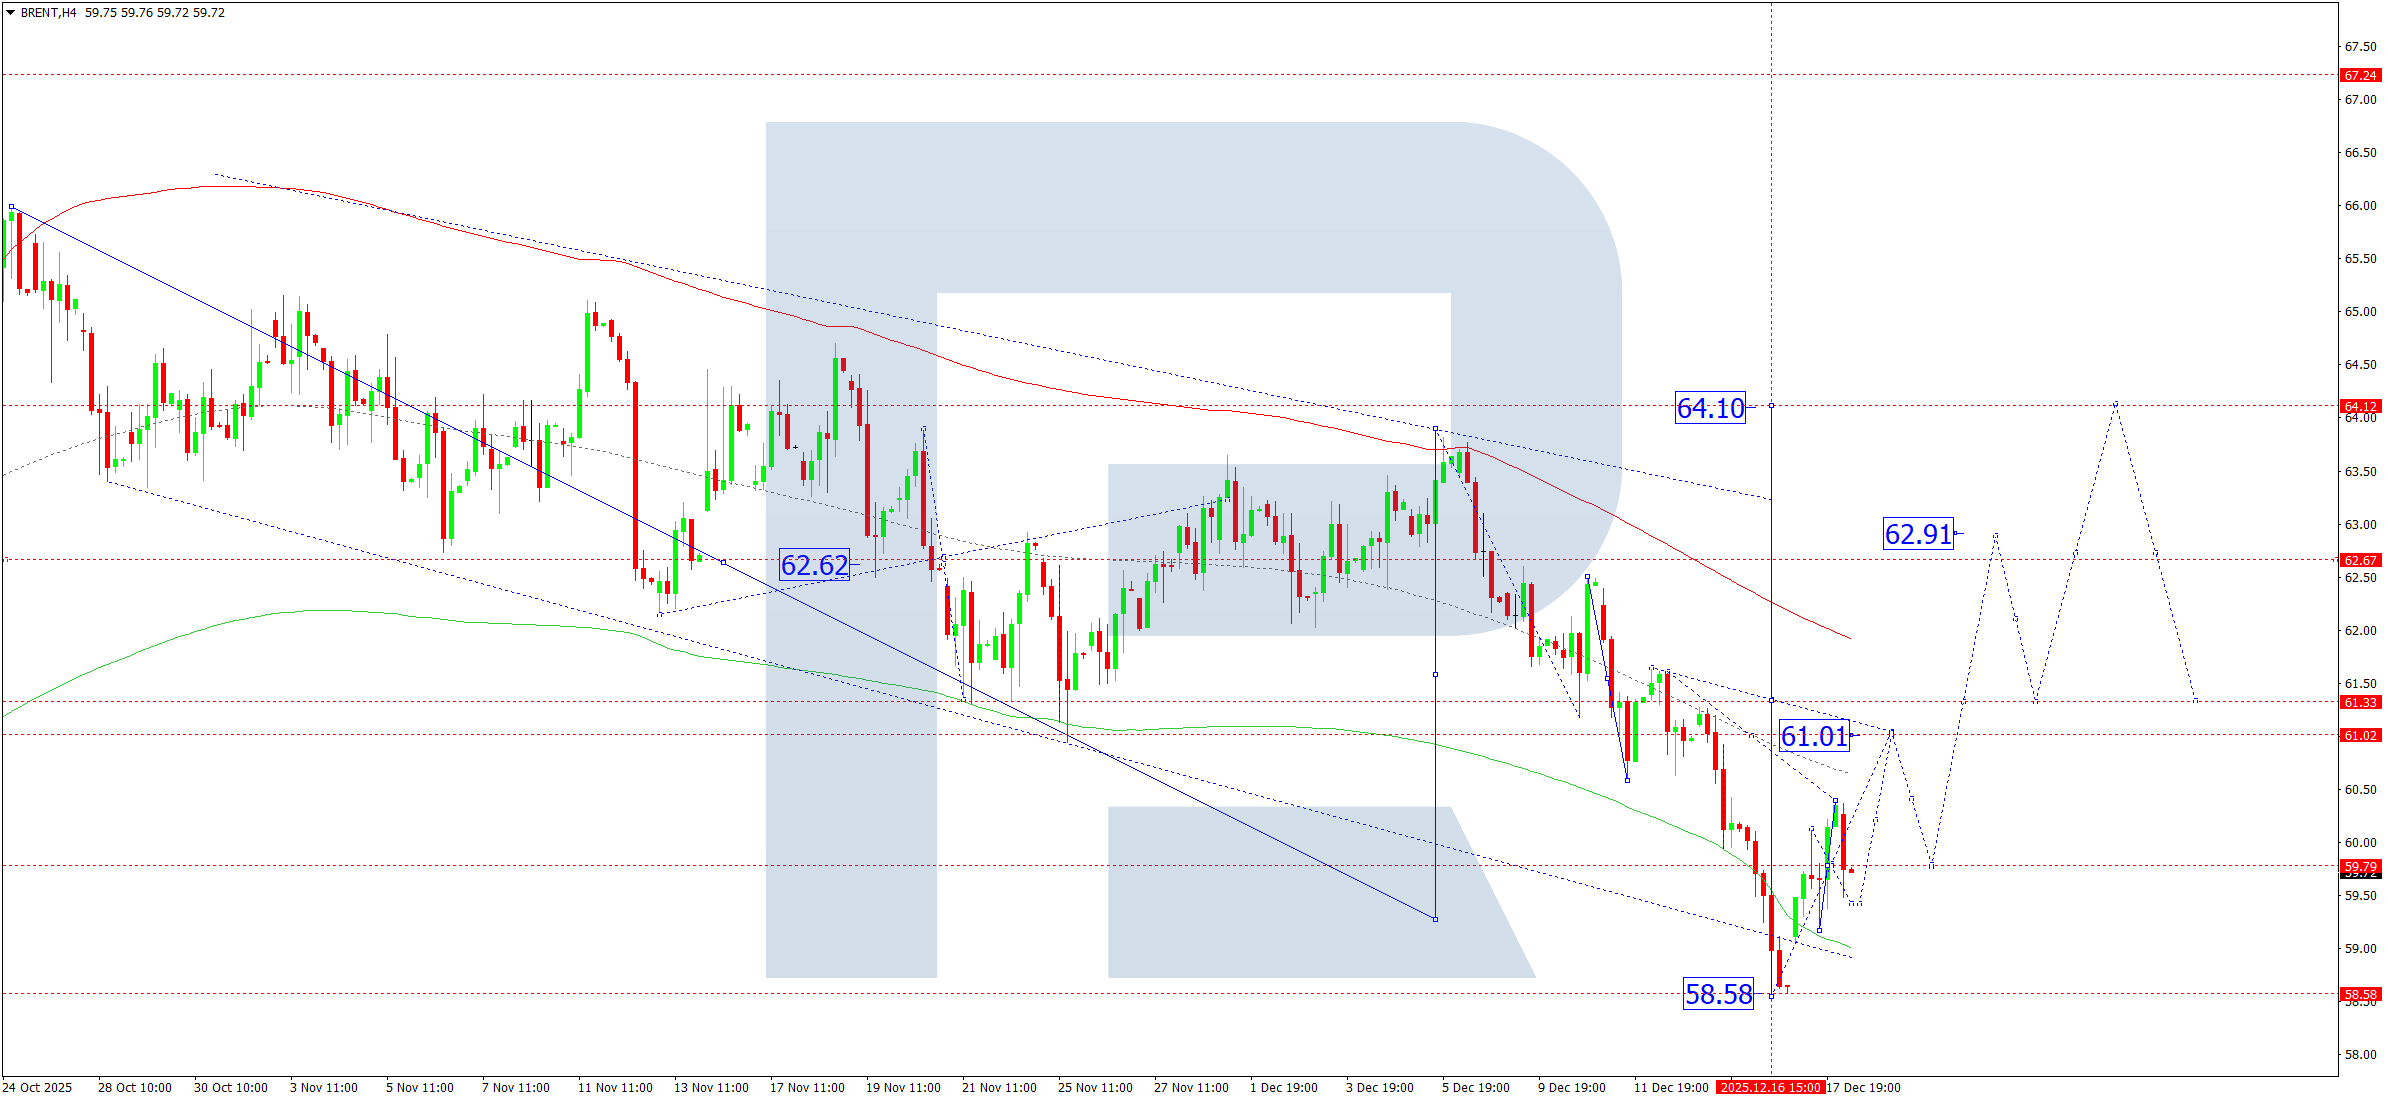
Brent Crude Oil Forecast
On the H4 chart, Brent crude oil remains in a consolidation phase near 59.79. Today, 18 December 2025, an upward impulse is expected to drive prices towards 61.00.
After this move, a corrective decline towards 59.80 is possible, followed by renewed growth towards 62.90, with the potential for further upside towards 64.10 as the next major target.
This scenario is confirmed by the Elliott Wave structure and the Matrix of the current wave, with a key rotation level at 62.62. At present, price action is advancing towards the central line of the Price Envelope at 61.00. A confirmed breakout above this level would increase the likelihood of growth towards the upper boundary at 62.90.
Technical indicators support bullish momentum towards 61.00 and 62.90.
Risk Warning: Past trading performance does not guarantee future results.
Leave a Reply