
Daily Technical Analysis and Forecast – 19 December 2025
EURUSD Forecast
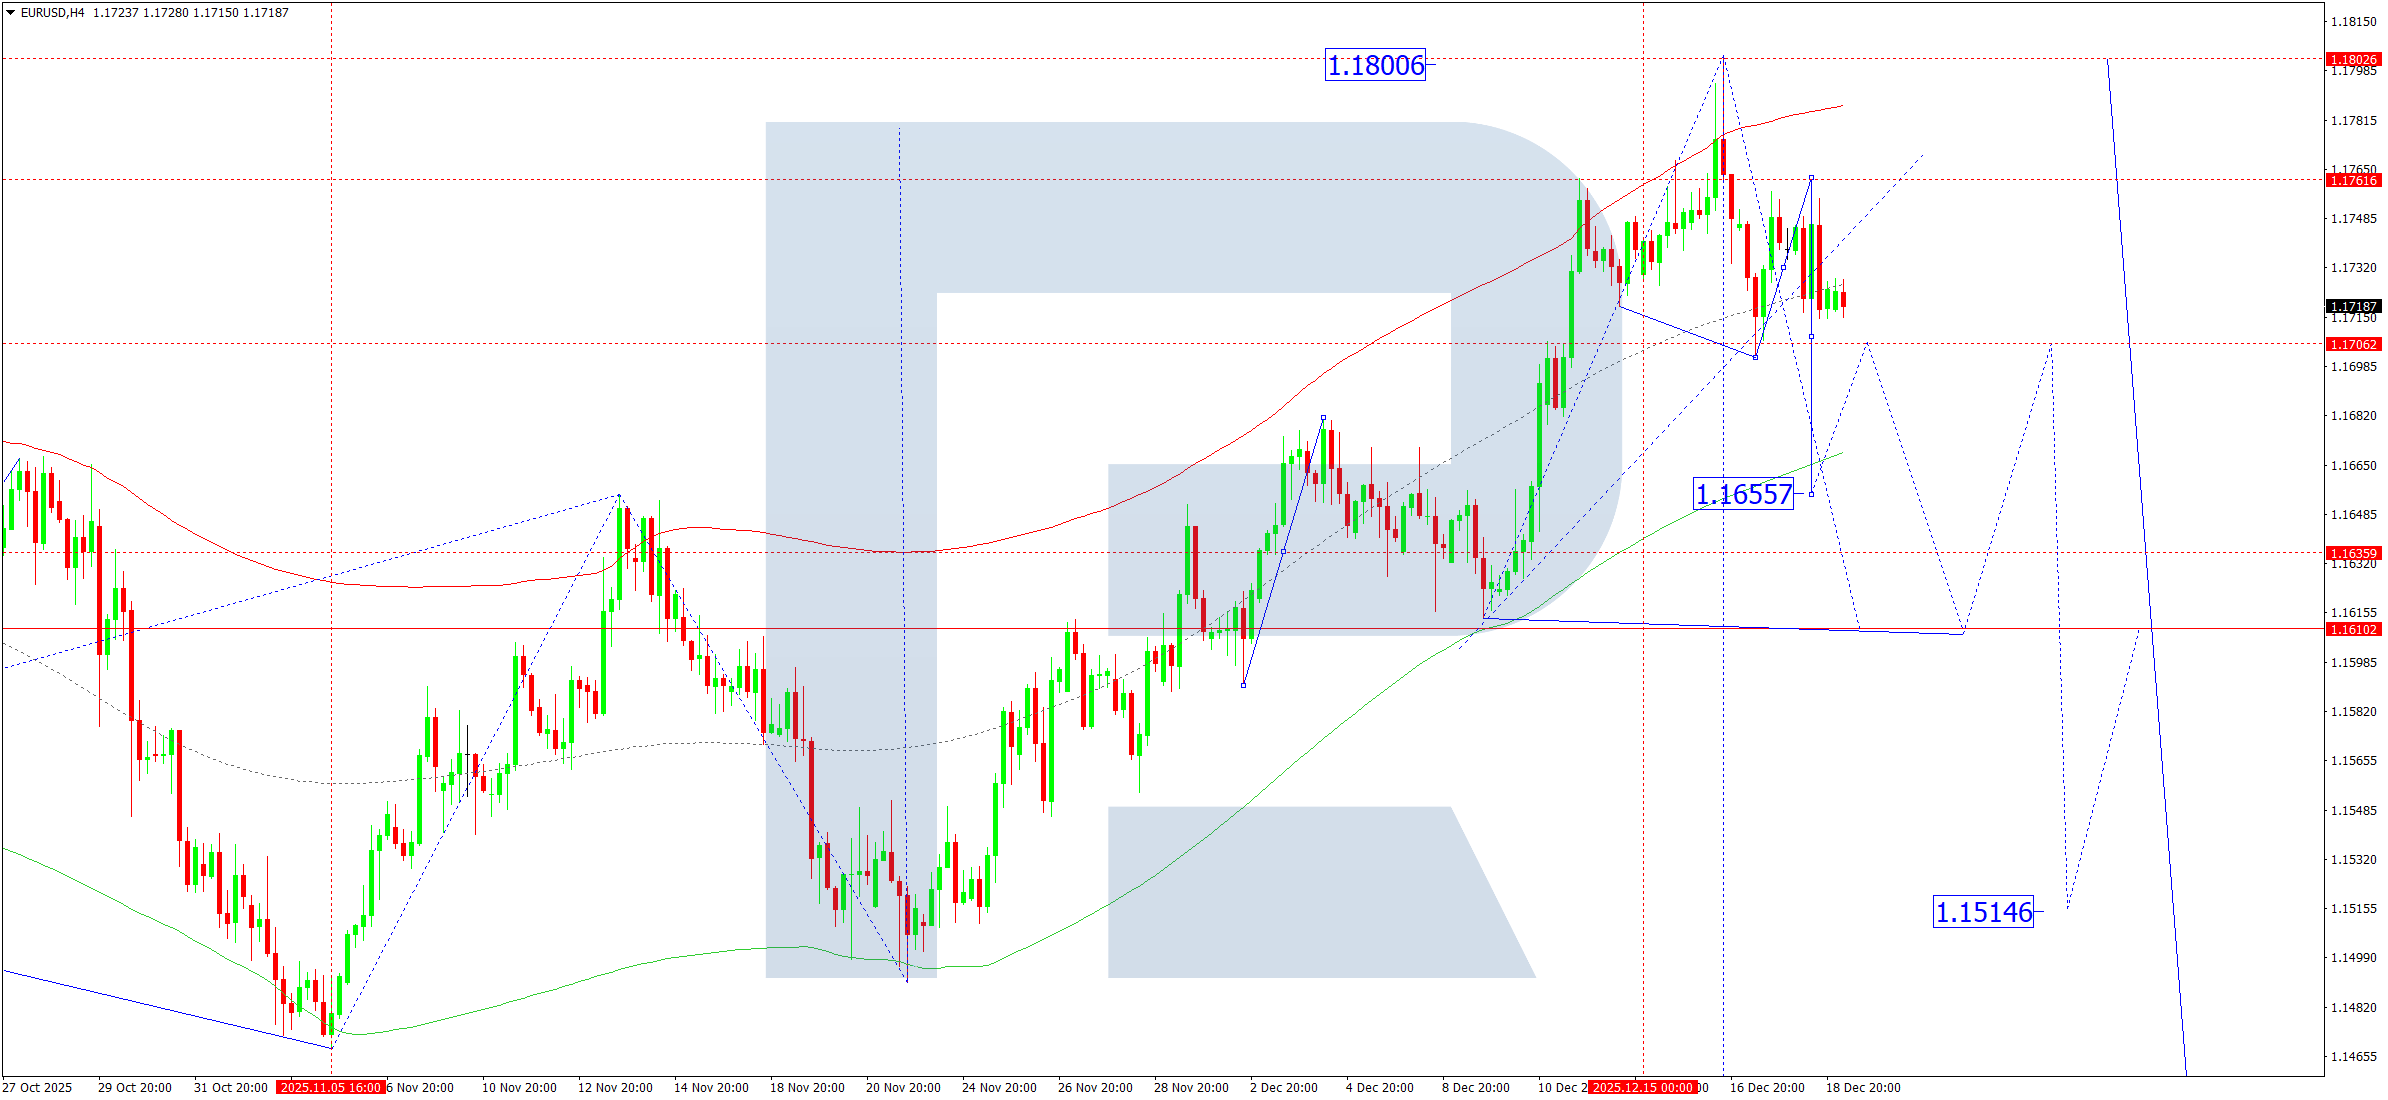
On the H4 chart, EURUSD has completed a bearish impulse down to the 1.1715 area. Today, 19 December 2025, the pair is consolidating in a narrow range around 1.1720. A downside breakout from this consolidation is expected, targeting 1.1700. A successful break below this level could extend the decline towards 1.1650, which acts as a local target.
After reaching this zone, a corrective rebound towards 1.1706 (a retest from below) is possible, followed by another downward move towards 1.1610.
This scenario is supported by the Elliott Wave structure and the Matrix of the bearish wave, with a rotation centre at 1.1706, which remains a key reference point. The price has already reached the central line of the Price Envelope at 1.1714, suggesting potential continuation of the decline towards the lower boundary near 1.1650.
Technical indicators favor a continuation of the bearish move towards 1.1650.
EURUSD Technical Analysis – 19 December 2025
Risk Warning: Past trading performance does not guarantee future results.
USDJPY Forecast
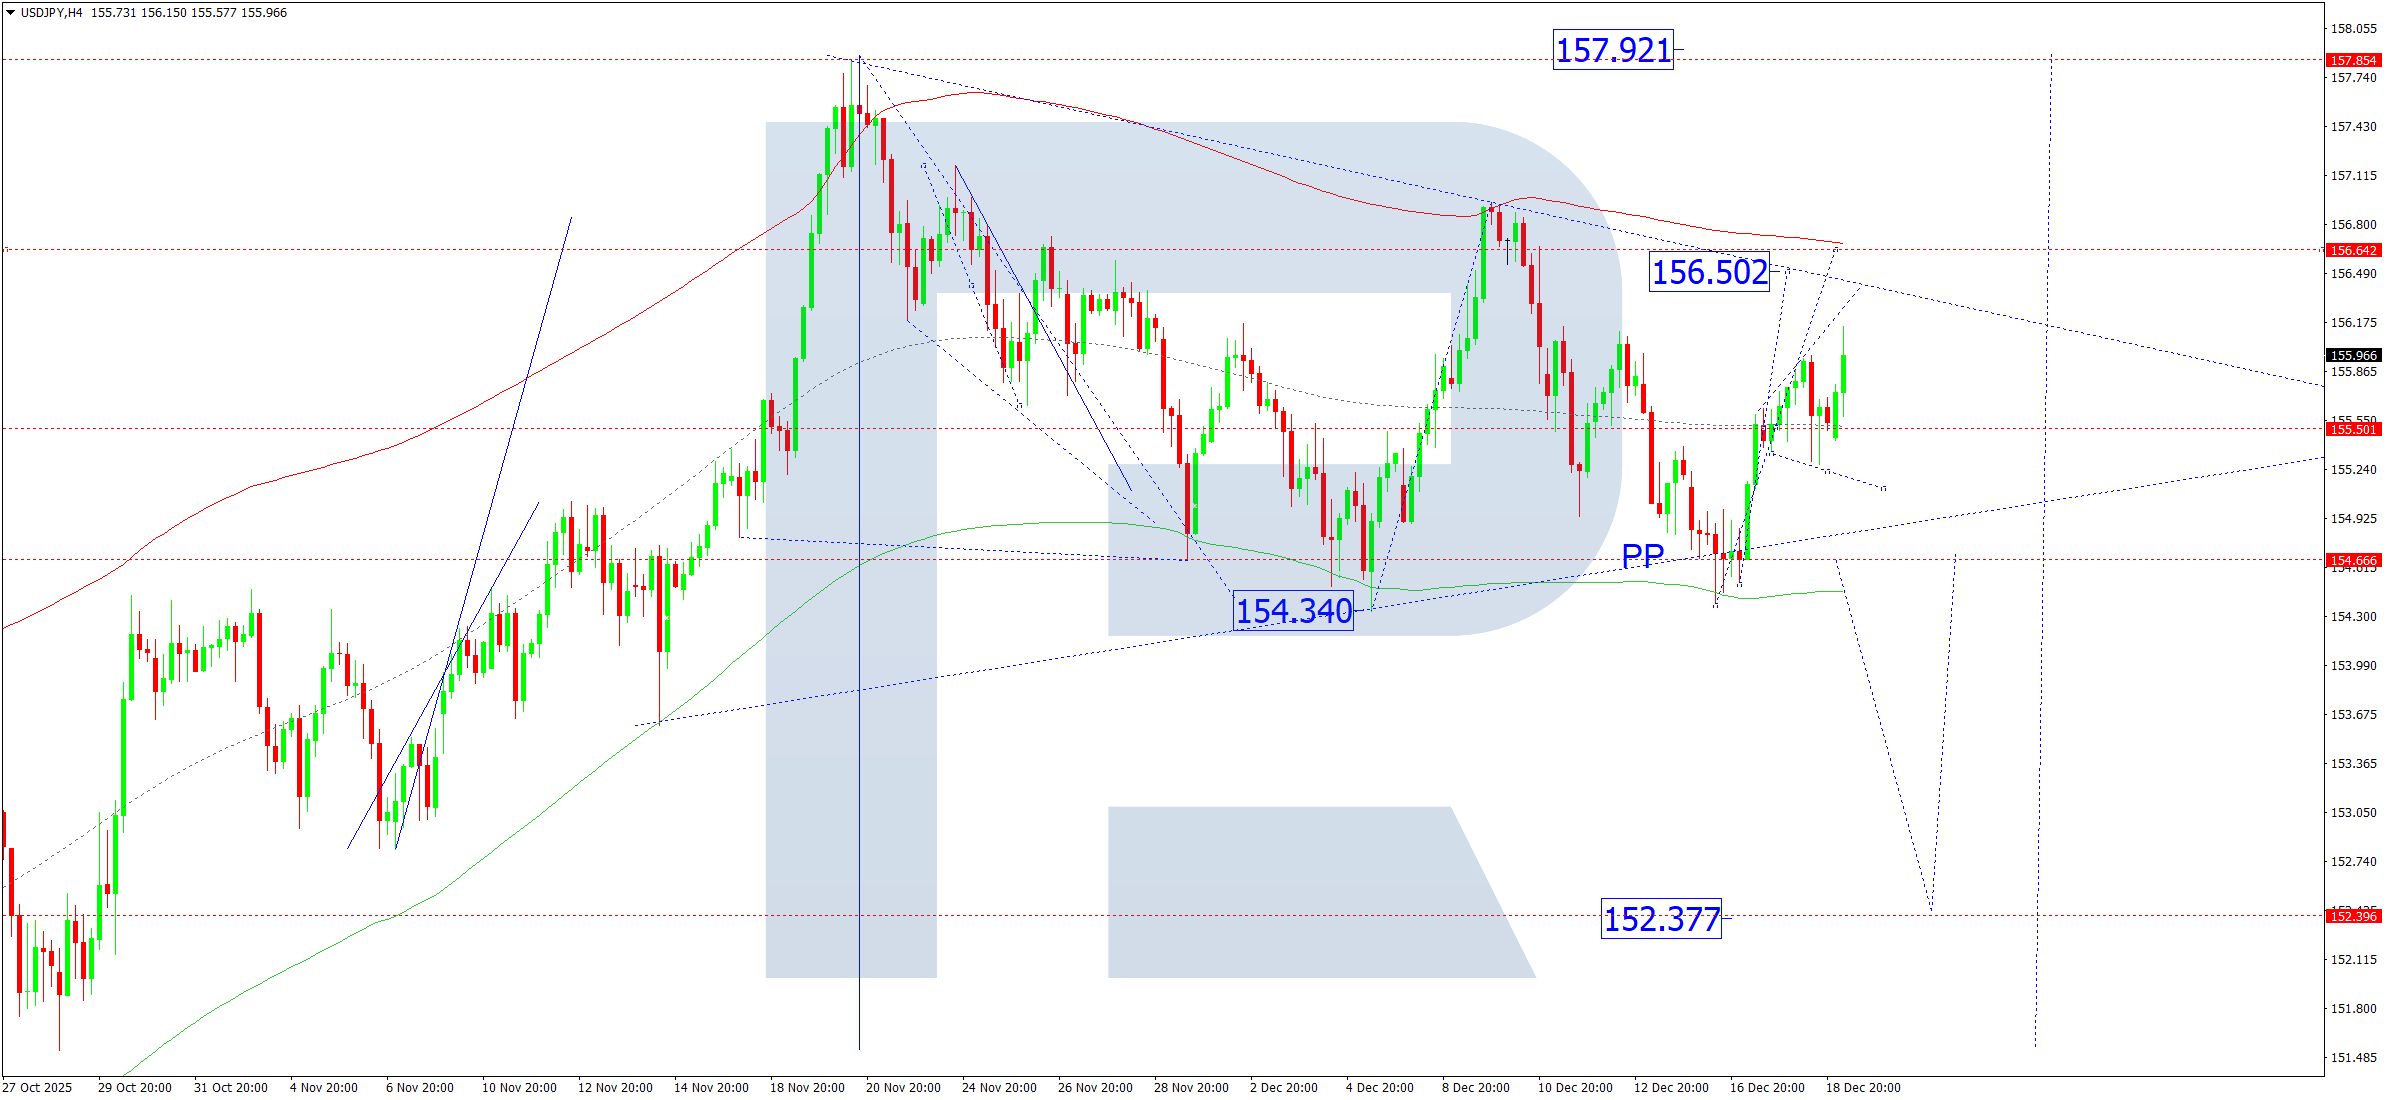
On the H4 timeframe, USDJPY continues to trade within a consolidation range around 155.50. Today, the primary scenario points to an upside breakout towards 156.50. After reaching this level, a pullback to 155.50 is possible, followed by renewed growth towards 156.60.
The outlook is confirmed by the Elliott Wave structure and the Matrix of the bullish wave, with a rotation centre at 155.50. The pair is currently developing an upward wave targeting the upper boundary of the Price Envelope at 156.50, after which a correction towards the central line near 155.50 may occur.
Technical indicators suggest potential growth towards 156.50, followed by a corrective decline.
USDJPY Technical Analysis – 19 December 2025
Risk Warning: Past trading performance does not guarantee future results.
GBPUSD Forecast
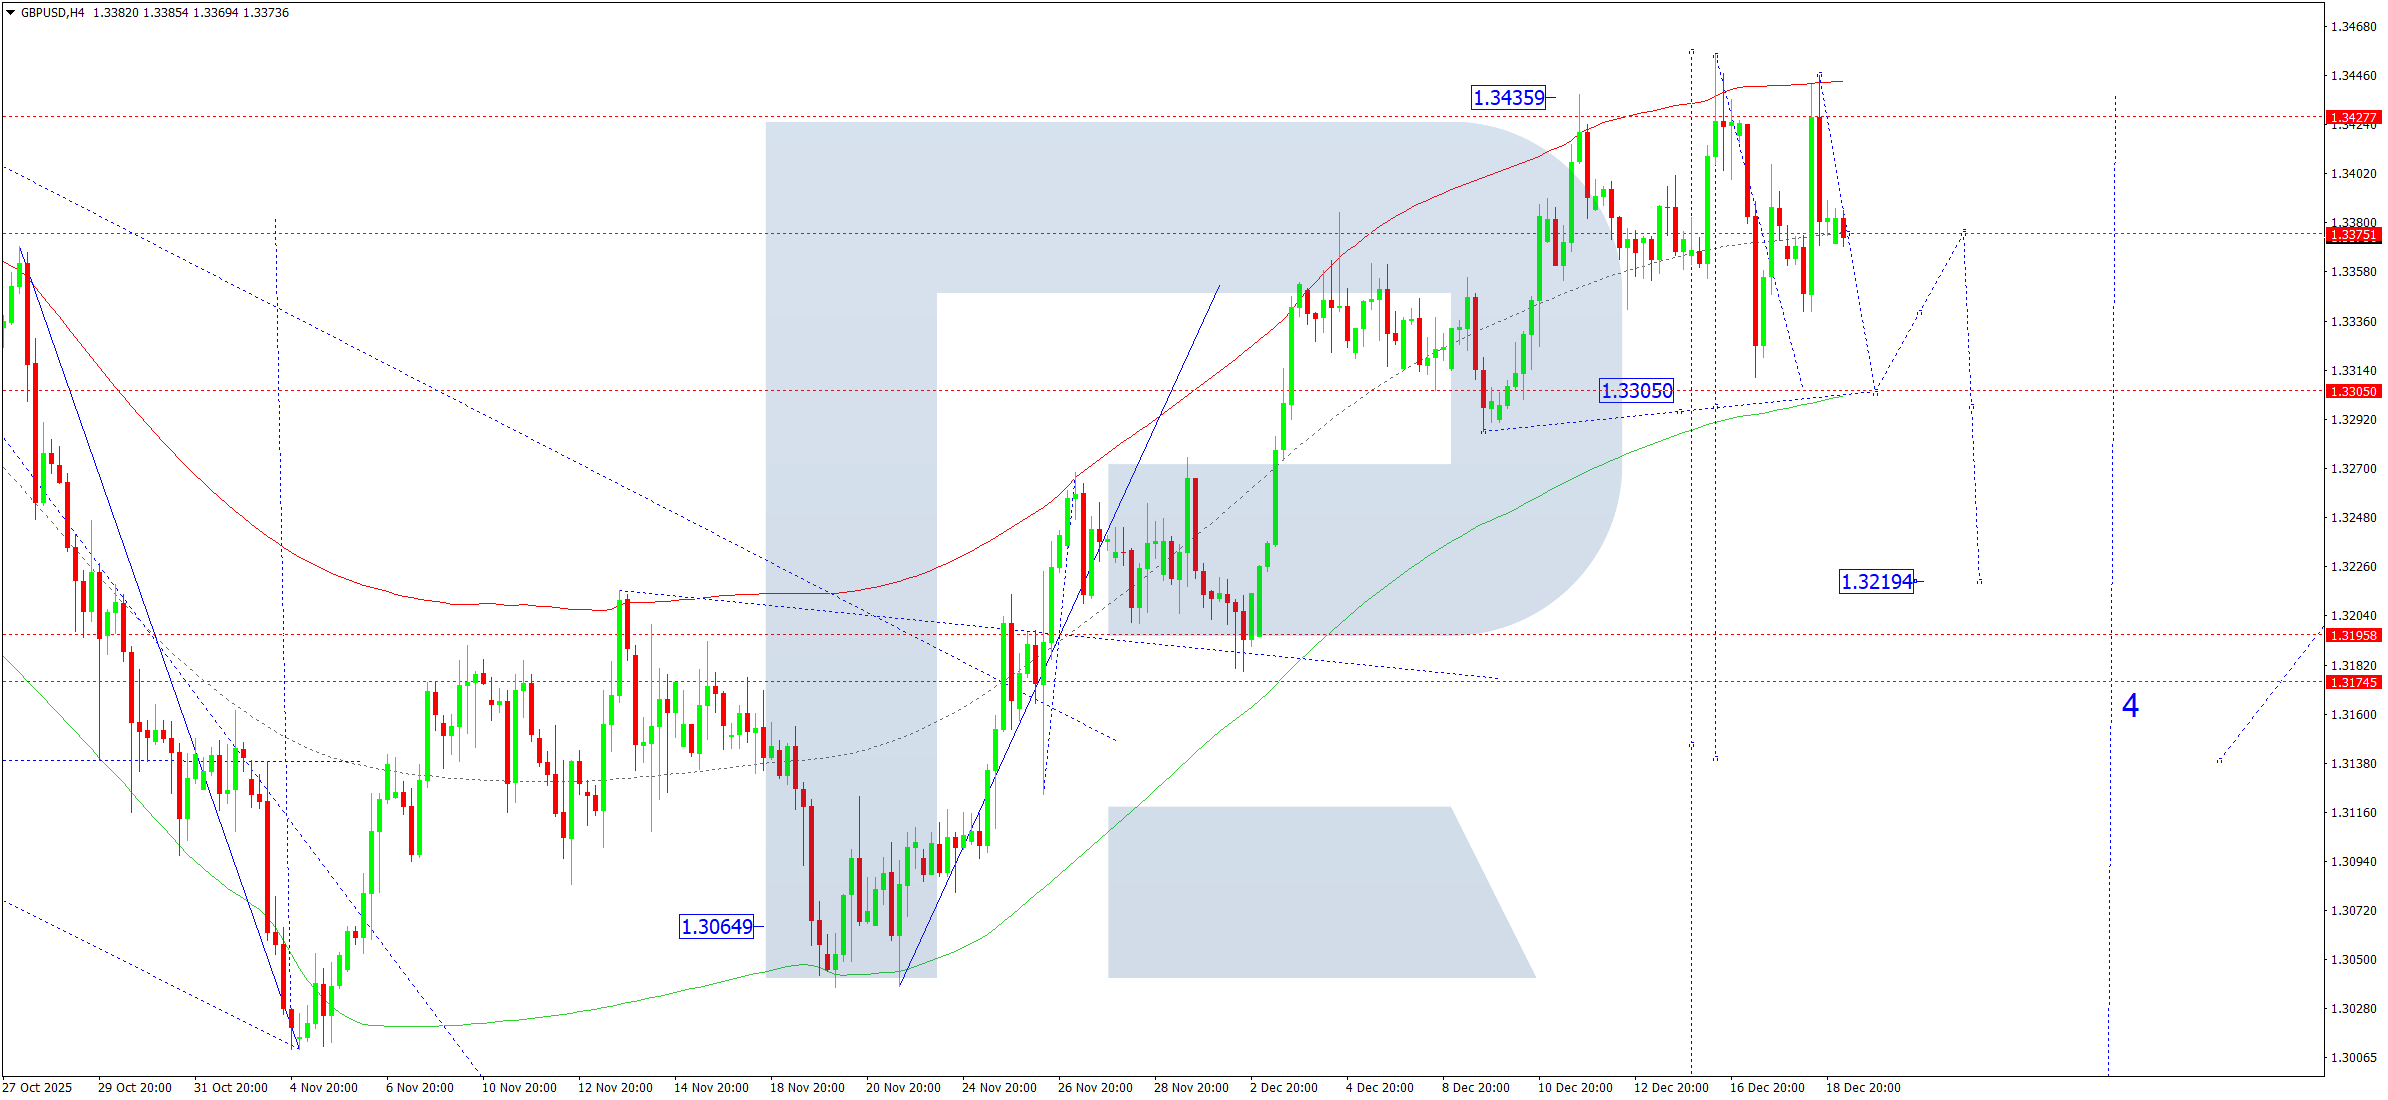
On the H4 chart, GBPUSD is forming a bearish wave structure aimed at 1.3305, which is expected to be reached today. Once this level is tested, a corrective recovery towards 1.3370 may follow.
Subsequently, the pair could resume its decline towards 1.3245, with further downside potential extending to 1.3170.
This scenario is validated by the Elliott Wave pattern and the Matrix of the downward wave, with a rotation centre at 1.3375. The current bearish movement is likely to continue towards the lower boundary of the Price Envelope at 1.3305, after which a correction towards the central line near 1.3375 may unfold.
Technical indicators support continued downside pressure towards 1.3305.
GBPUSD Technical Analysis – 19 December 2025
Risk Warning: Past trading performance does not guarantee future results.
AUDUSD Forecast
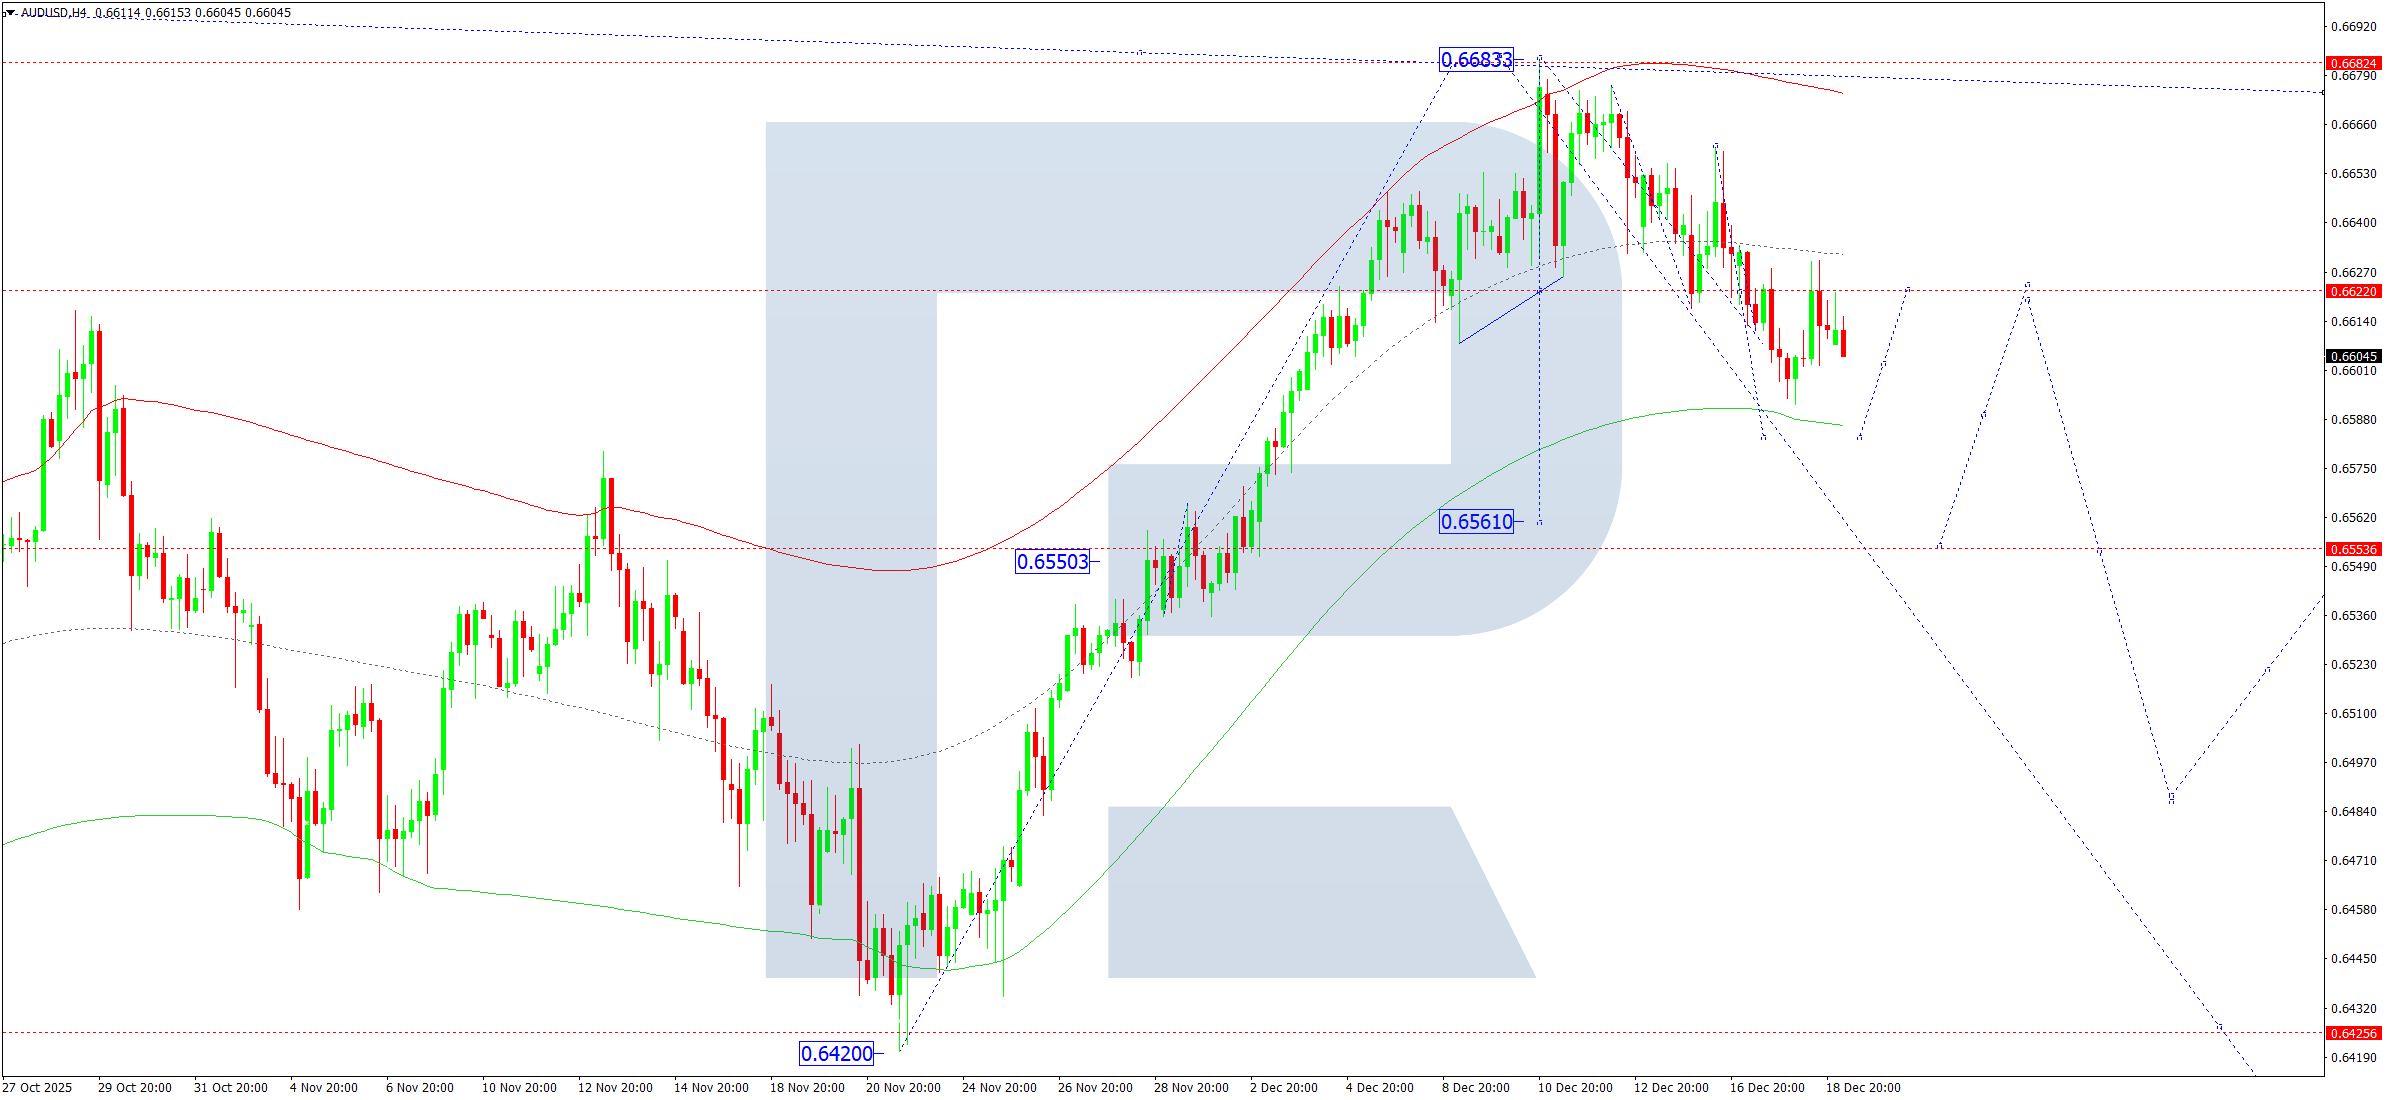
On the H4 timeframe, AUDUSD previously consolidated around 0.6622 before breaking lower and entering the third bearish wave. Today, further downside is expected towards 0.6580. A break below this level would open the way for a decline towards 0.6561, which serves as the next target.
The bearish outlook is confirmed by the Elliott Wave structure and the Matrix of the downward wave, with a rotation centre at 0.6622. Price action is currently directed towards the lower boundary of the Price Envelope at 0.6580.
Technical indicators indicate a higher probability of further decline towards 0.6580.
AUDUSD Technical Analysis – 19 December 2025
Risk Warning: Past trading performance does not guarantee future results.
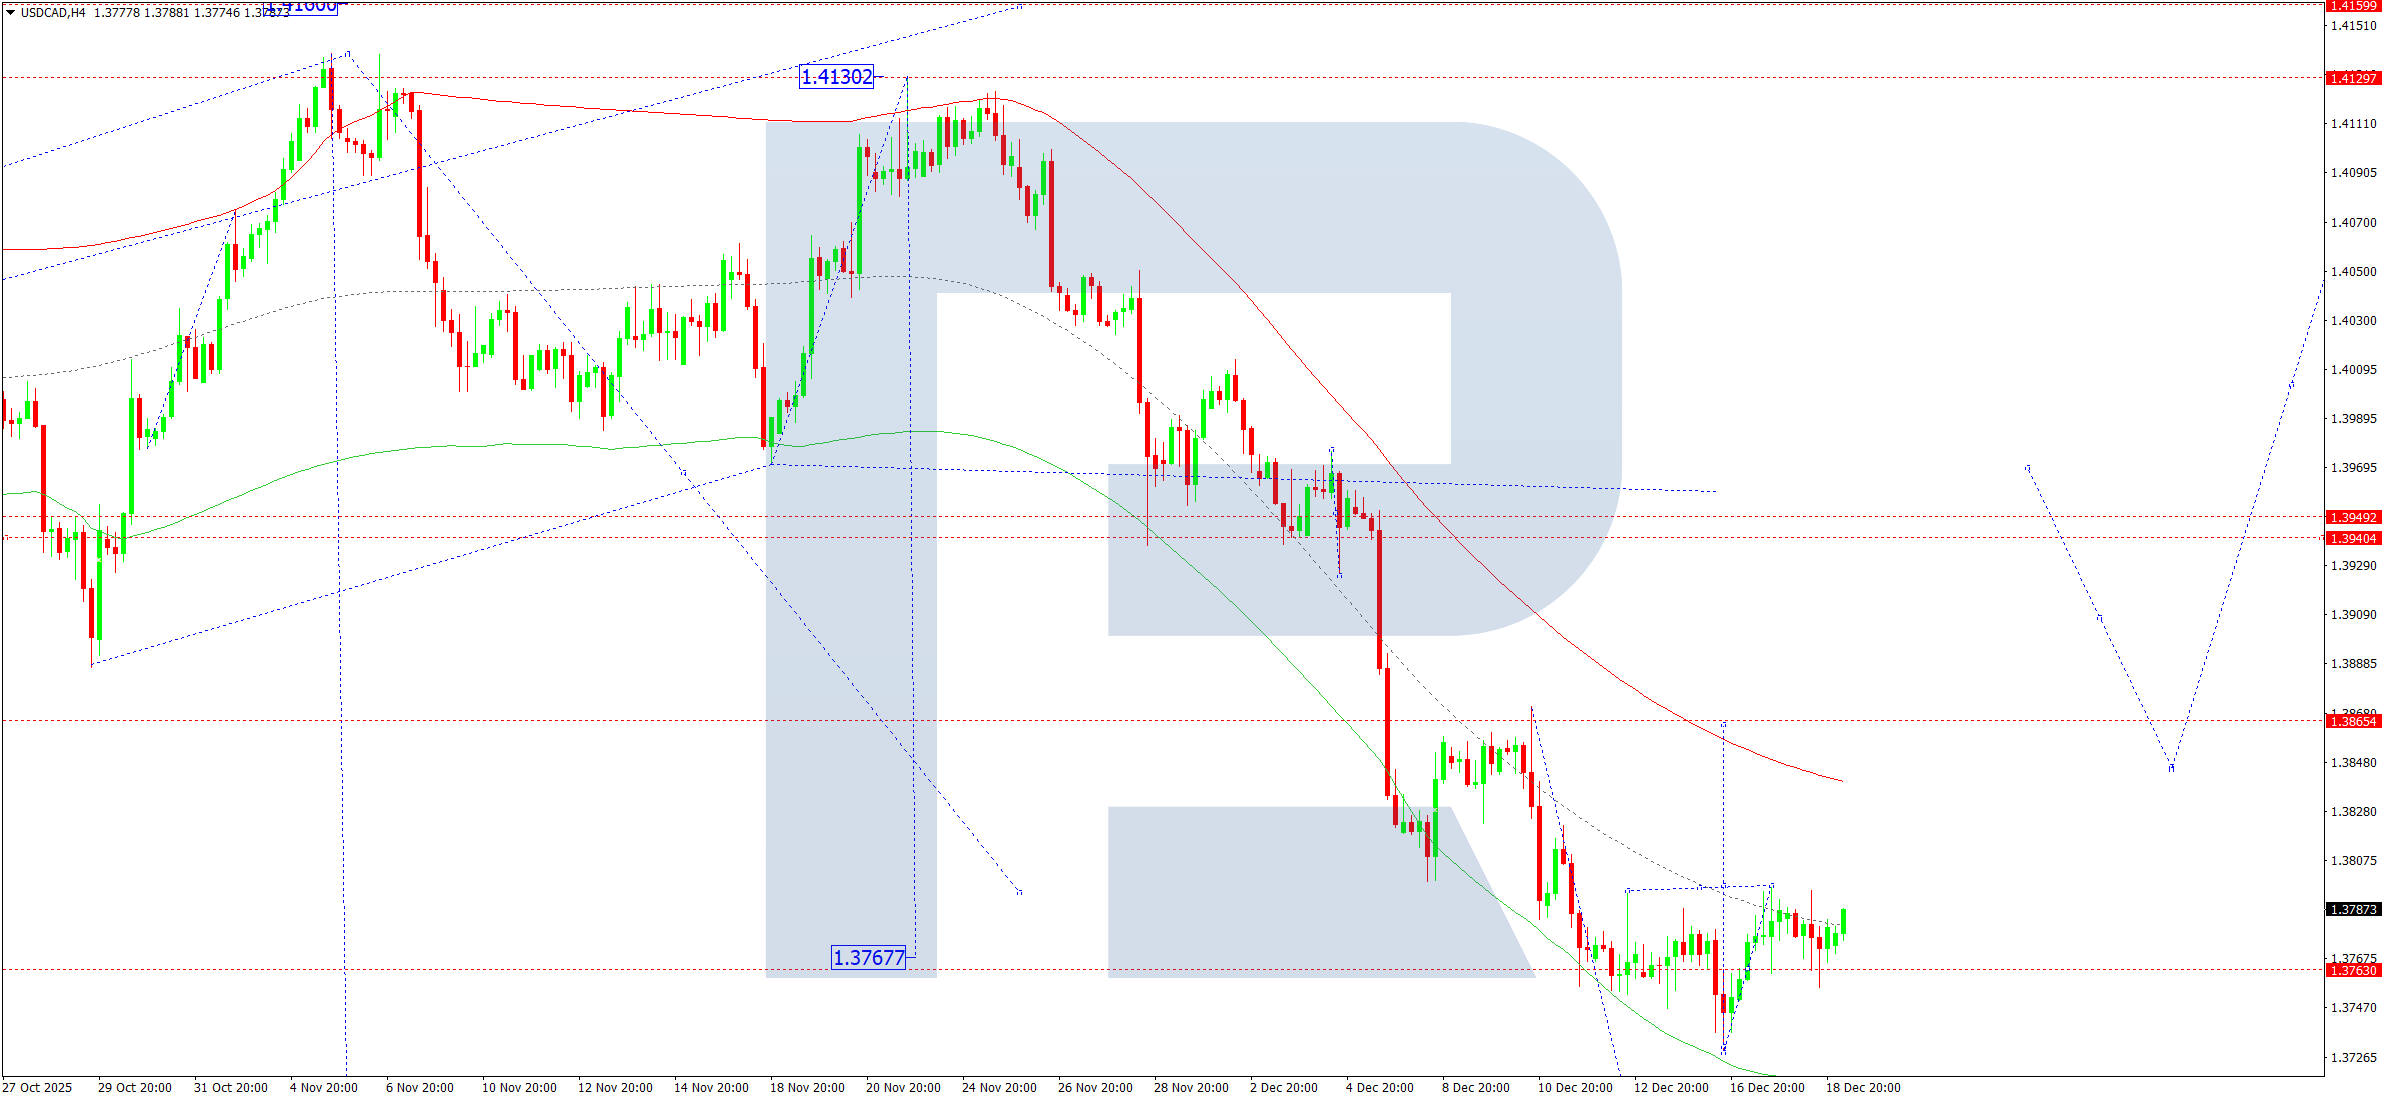
USDCAD Forecast
On the H4 chart, USDCAD is trading within a tight consolidation range near 1.3763. If the price breaks below this range, the decline could extend towards 1.3700. Conversely, an upside breakout would signal the potential start of a bullish wave towards 1.3865.
The Elliott Wave structure and the Matrix of the bearish wave, with a rotation centre at 1.3939, confirm this scenario. The market has completed a corrective move towards the lower boundary of the Price Envelope at 1.3767. Following this correction, the formation of a new upward wave targeting 1.3939 remains possible.
Technical indicators point to a corrective rise towards 1.3865.
USDCAD Technical Analysis – 19 December 2025
Risk Warning: Past trading performance does not guarantee future results.
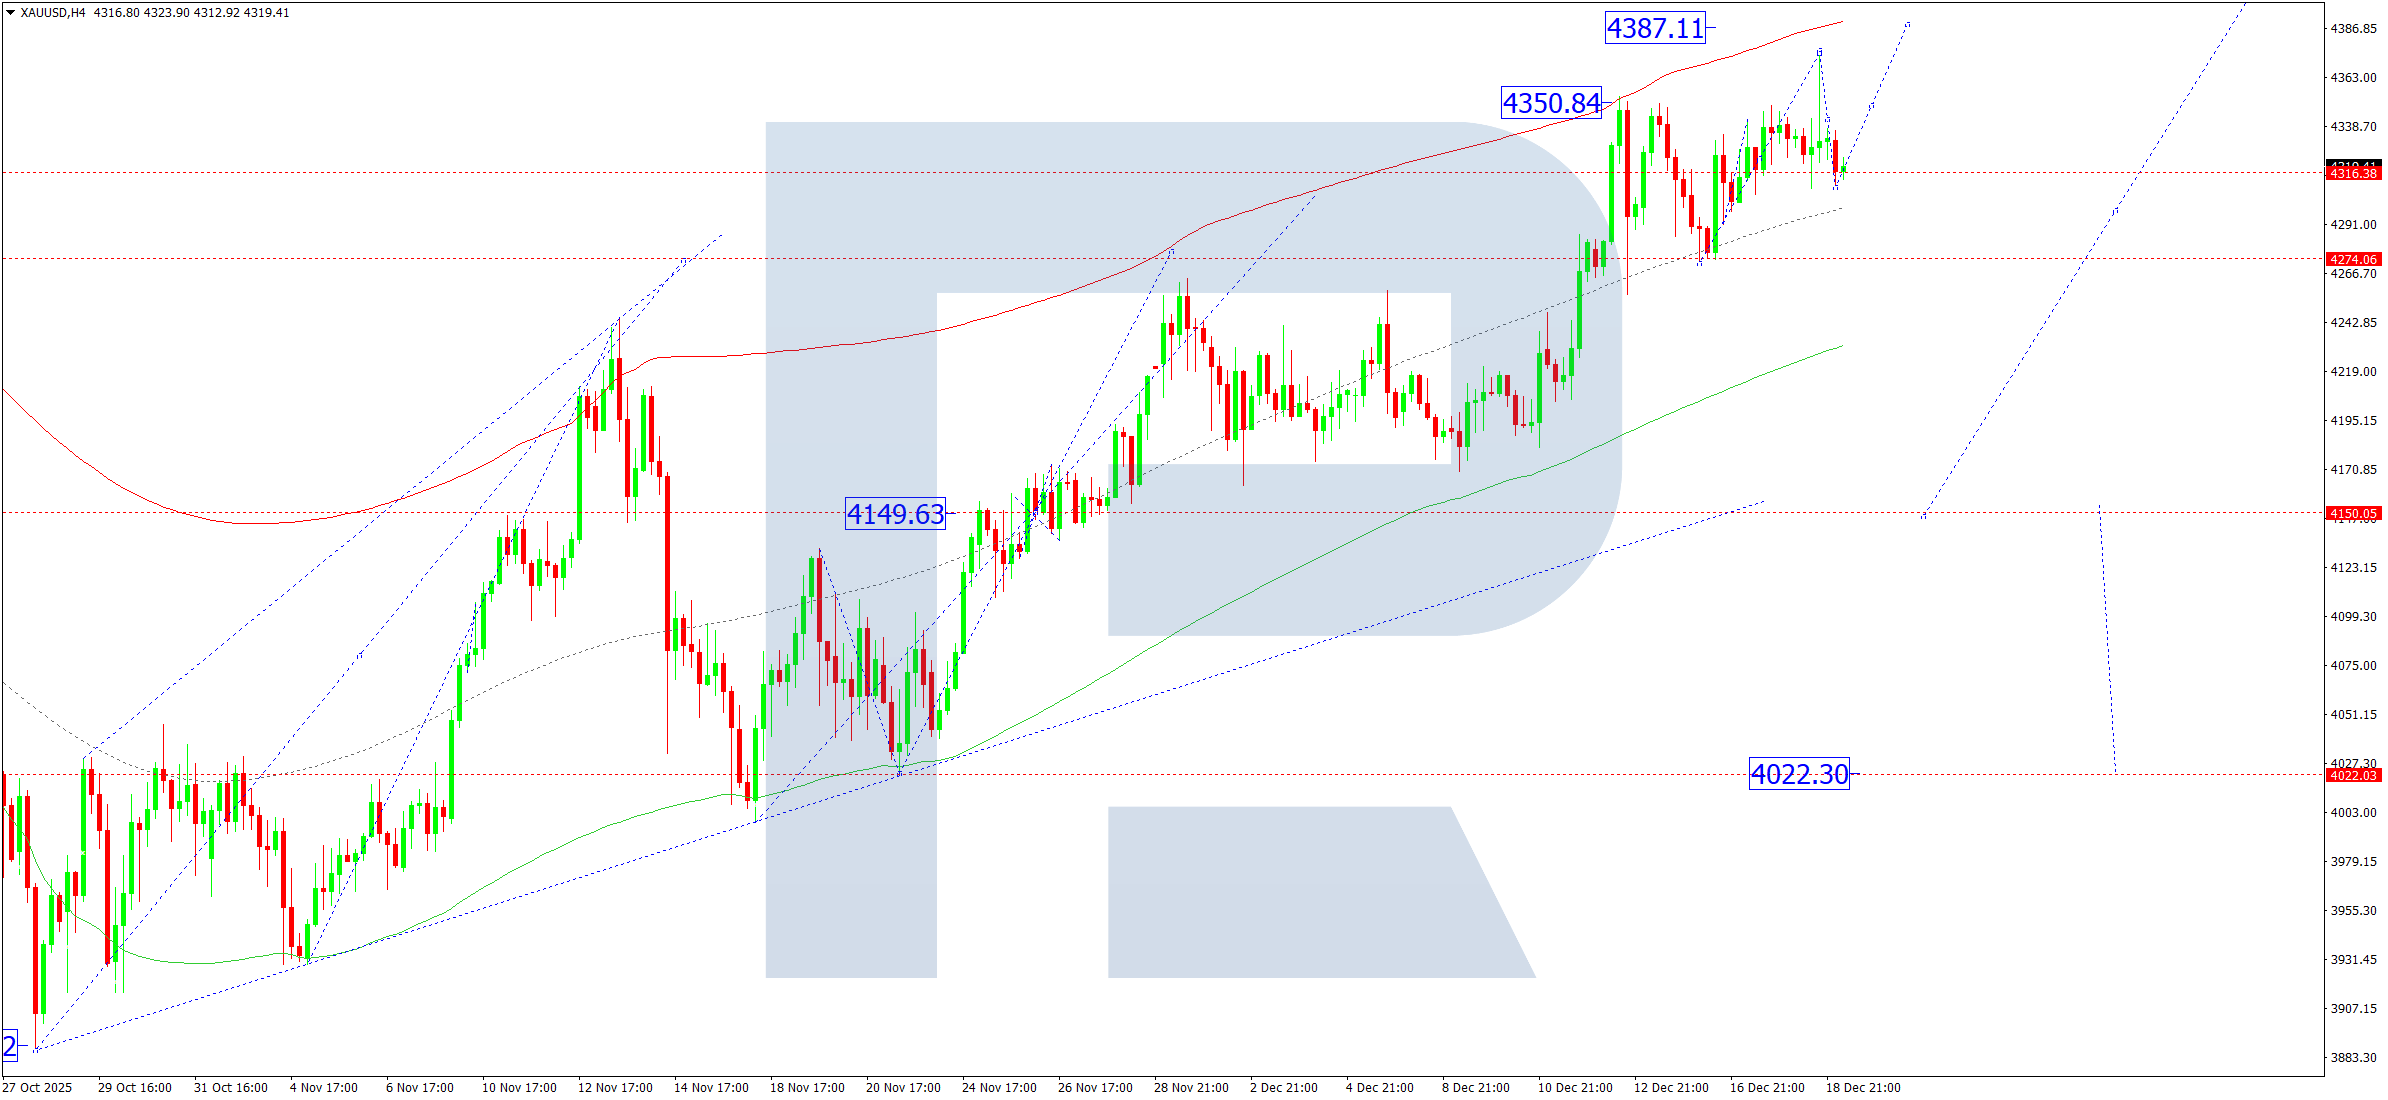
XAUUSD (Gold) Forecast
On the H4 chart, XAUUSD has завершed an upward wave reaching 4,374, followed by a pullback to 4,315, acting as a retest from above. This movement has effectively defined a consolidation range.
A breakout above this range would open the path towards 4,387, while a downside breakout could trigger a correction towards 4,150. After such a correction, the broader uptrend may resume, targeting the 4,400 level.
This outlook is supported by the Elliott Wave structure and the Matrix of the bullish wave, with a rotation centre at 4,150. The market continues to develop the fifth upward wave, aiming for the upper boundary of the Price Envelope near 4,400, after which a corrective move towards 4,150 may follow.
Technical indicators suggest a higher probability of growth towards 4,387.
XAUUSD Technical Analysis – 19 December 2025
Risk Warning: Past trading performance does not guarantee future results.
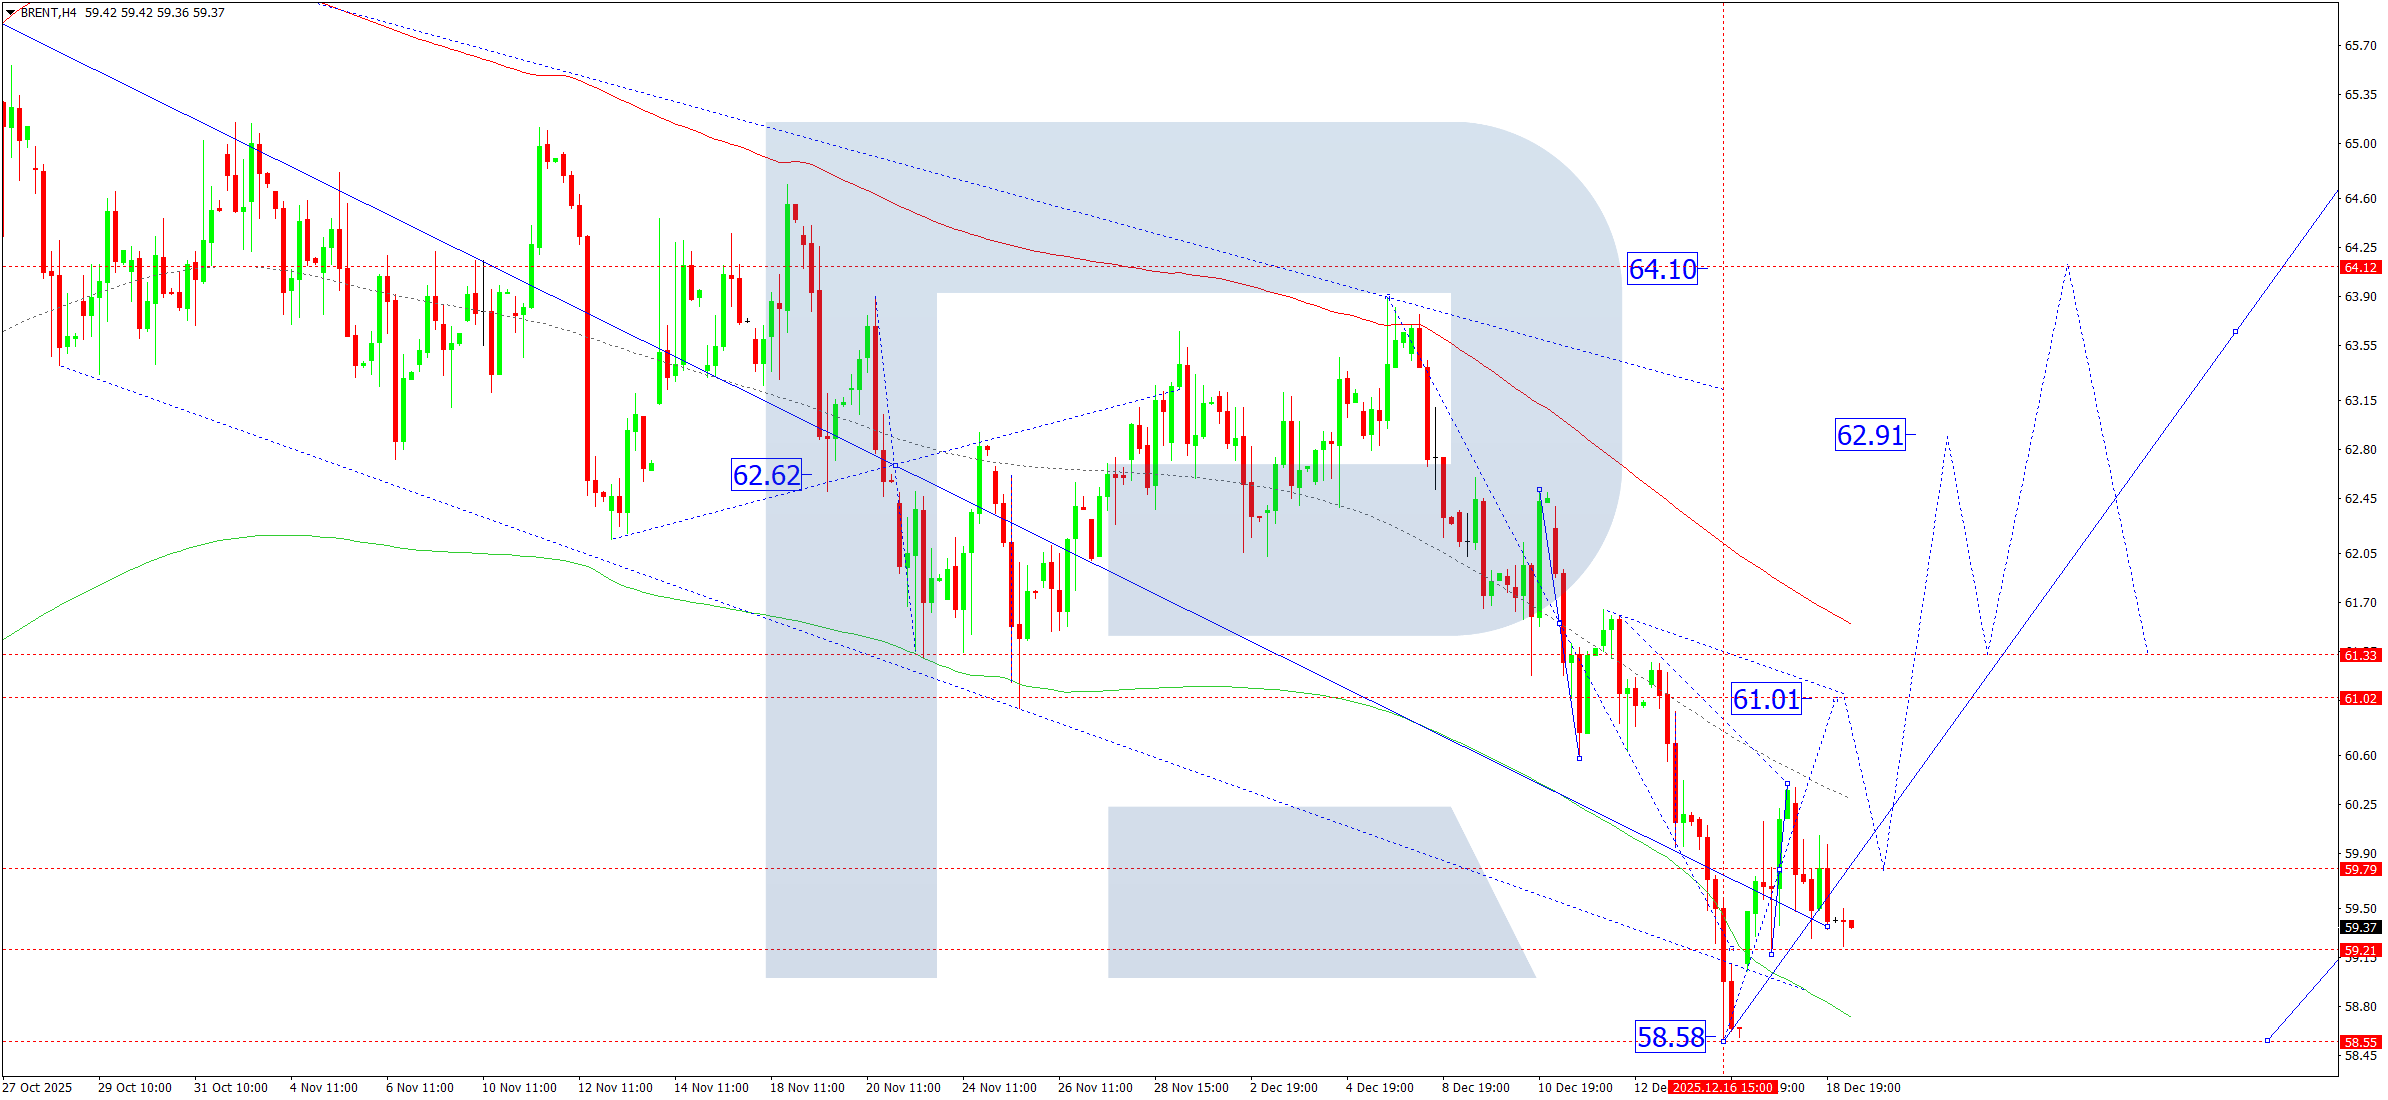
Brent Crude Oil Forecast
On the H4 chart, Brent crude oil is consolidating around 59.79. A short-term decline towards 58.90 is possible today. Thereafter, an upward impulse is expected towards 61.00, with further upside potential extending to 62.90 and eventually 64.10, which serves as the first major target.
This scenario is confirmed by the Elliott Wave structure and the Matrix of the bearish wave, with a rotation centre at 62.62. The market is currently forming an upward impulse towards the central line of the Price Envelope at 61.00. A breakout above this level would increase the likelihood of further growth towards 62.90.
Technical indicators favor upward movement towards 61.00 and 62.90.
Brent Technical Analysis – 19 December 2025
Risk Warning: Past trading performance does not guarantee future results.
Leave a Reply