
Daily Technical Analysis and Forecast – 23 December 2025
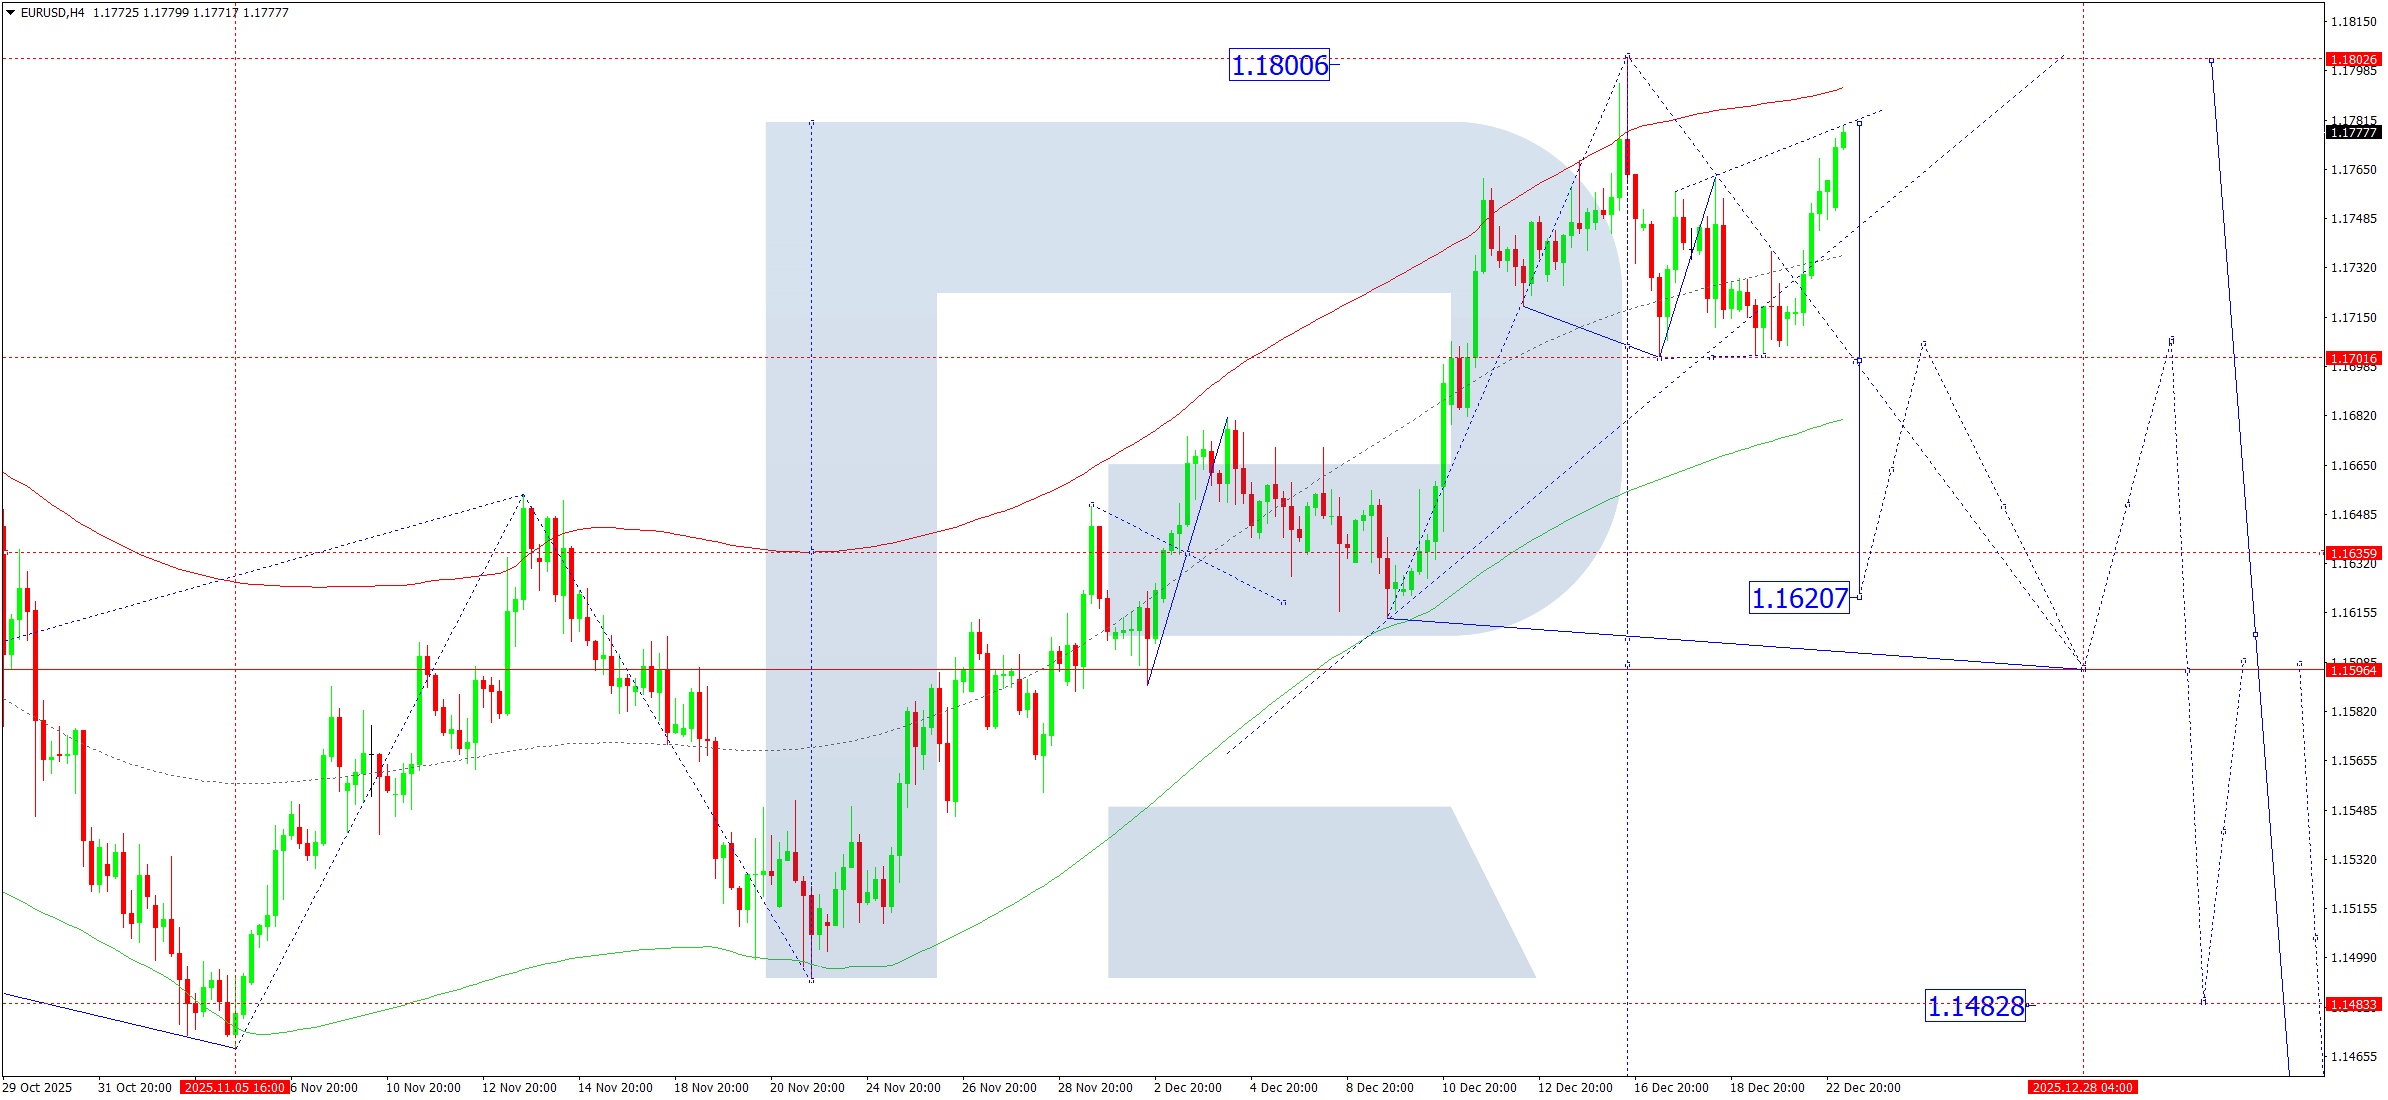
EURUSD Forecast
On the H4 chart, EURUSD continues to trade within a consolidation range centered near 1.1740. On 23 December 2025, the upper boundary of this range has extended toward 1.1780. The primary scenario suggests a potential decline toward the lower boundary at 1.1700. A confirmed breakout below this level may open the way for further downside toward 1.1620. Alternatively, if price breaks above resistance, an additional upward move toward 1.1800 remains possible.
From a technical perspective, this outlook is supported by the Elliott wave structure and the Matrix of the bullish wave, with a key rotation level at 1.1640. The market previously completed a downward impulse to the central line of the Price Envelope at 1.1702. A corrective move toward 1.1780 is currently forming, after which a renewed decline toward 1.1700 is anticipated.
Technical indicators favor a corrective decline toward the 1.1740 area during today’s session.
Risk Warning: Past trading performance does not guarantee future results.
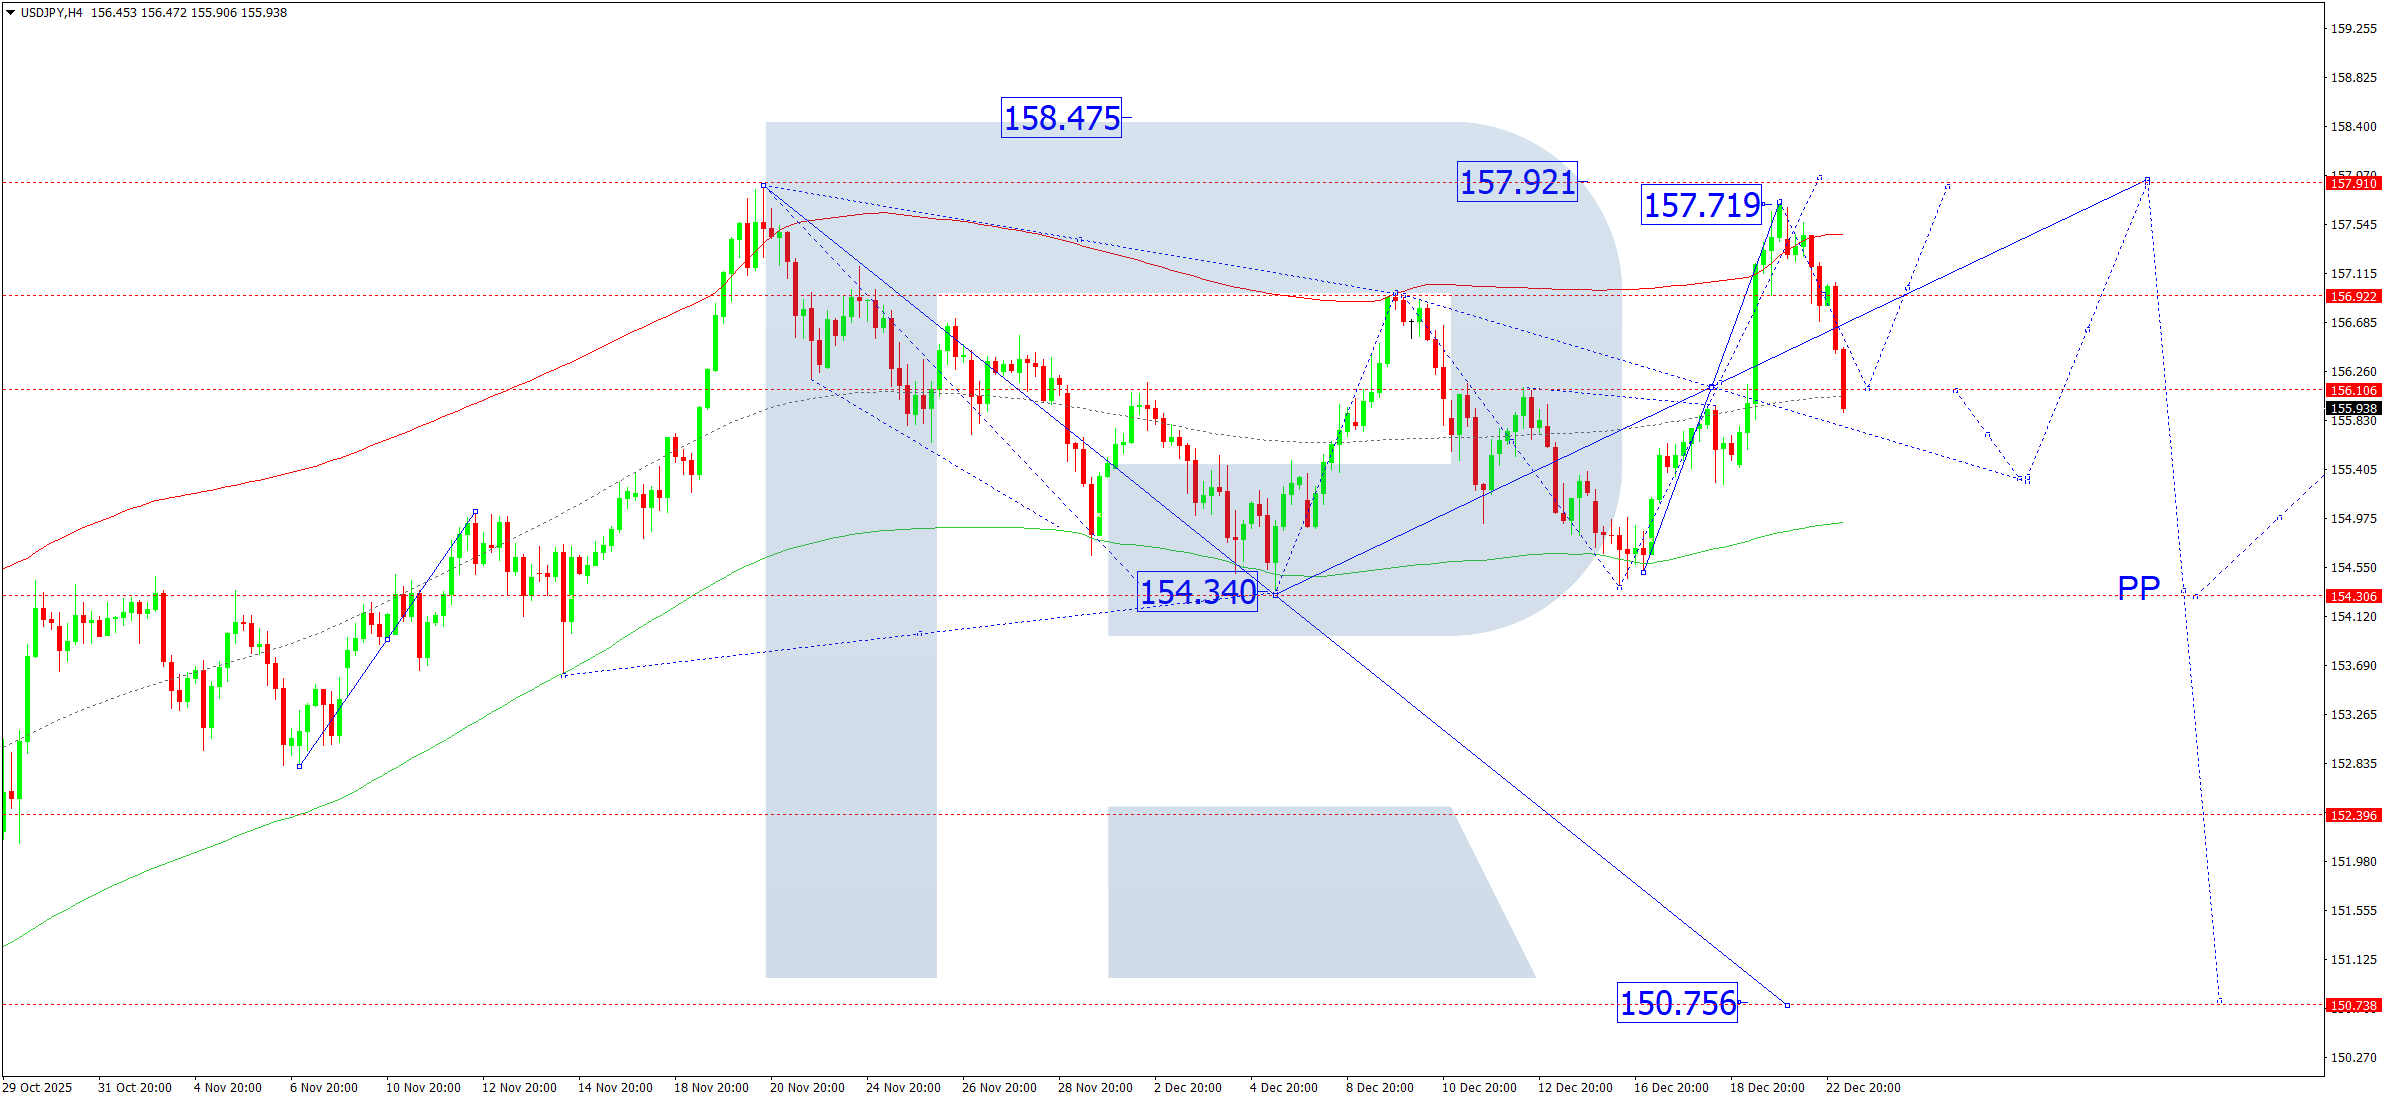
USDJPY Forecast
On the H4 chart, USDJPY has completed a corrective phase near 156.00. For 23 December 2025, the primary expectation is the development of a new upward wave targeting 157.92. Following this advance, a corrective pullback toward 154.34 may occur.
This scenario is confirmed by the Elliott wave structure and the Matrix of the bullish wave, with a rotation center located at 156.10. The market recently formed an upward impulse to the upper boundary of the Price Envelope at 157.72. A short-term correction toward the central line at 156.00 is possible before growth resumes toward 157.92.
Technical indicators point to a high probability of renewed upside momentum toward 157.92.
Risk Warning: Past trading performance does not guarantee future results.
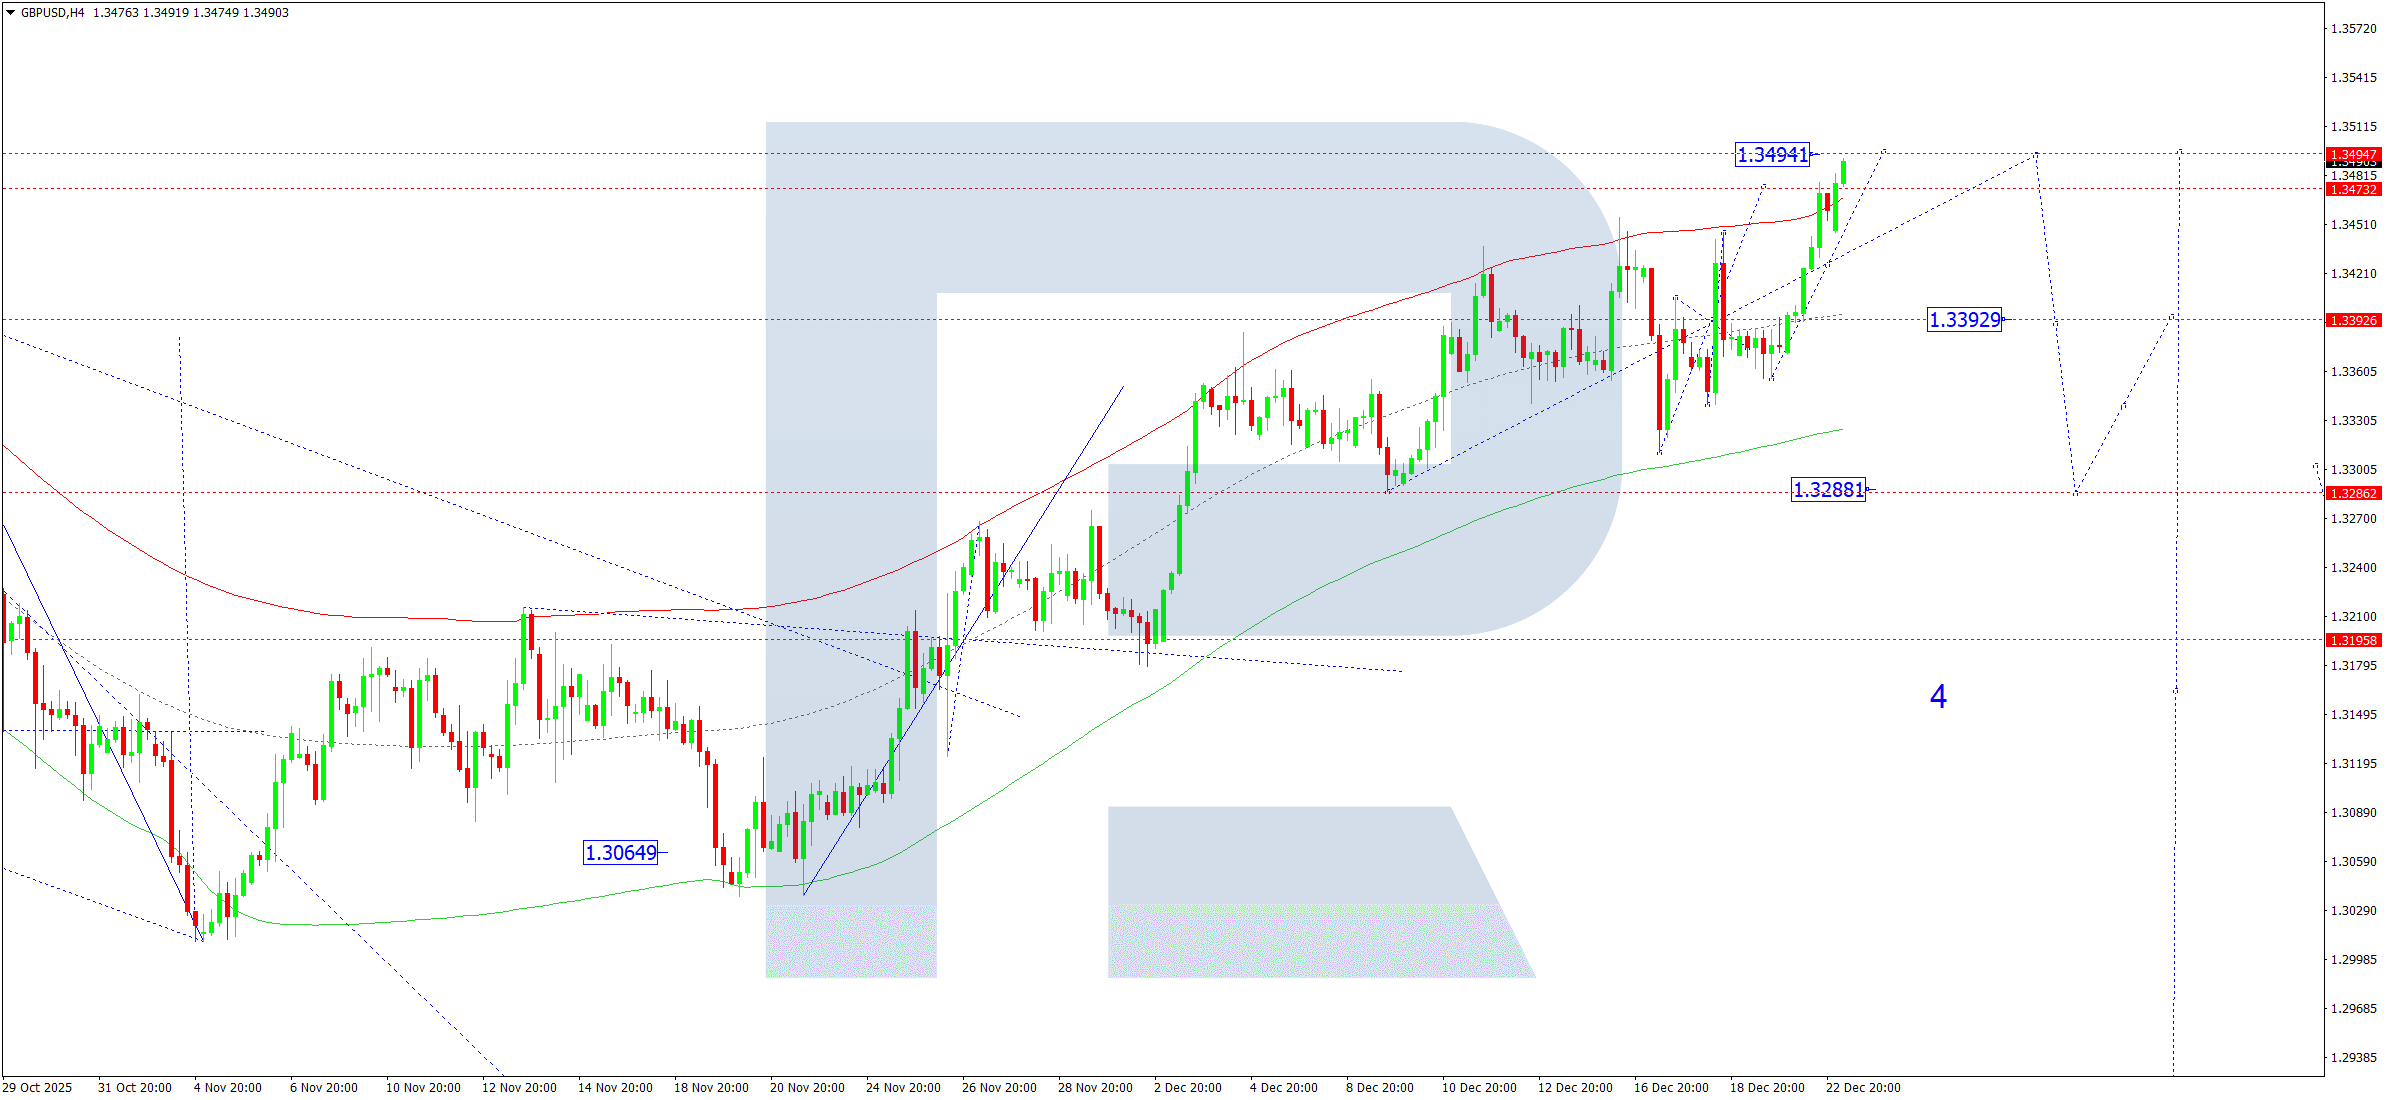
GBPUSD Forecast
On the H4 timeframe, GBPUSD remains in a consolidation phase around 1.3390. During today’s session, the range may expand upward toward 1.3494. After reaching this resistance, a pullback toward 1.3390 is expected. A breakout below this level would increase the probability of a deeper decline toward 1.3288.
This outlook aligns with the Elliott wave structure and the Matrix of the bullish wave, with a rotation center at 1.3190. The upward wave is approaching the upper boundary of the Price Envelope near 1.3494, where selling pressure may emerge. A downward move toward the central line at 1.3392 is likely after the upward phase completes.
Technical indicators suggest the early formation of a downward wave toward 1.3393.
Risk Warning: Past trading performance does not guarantee future results.
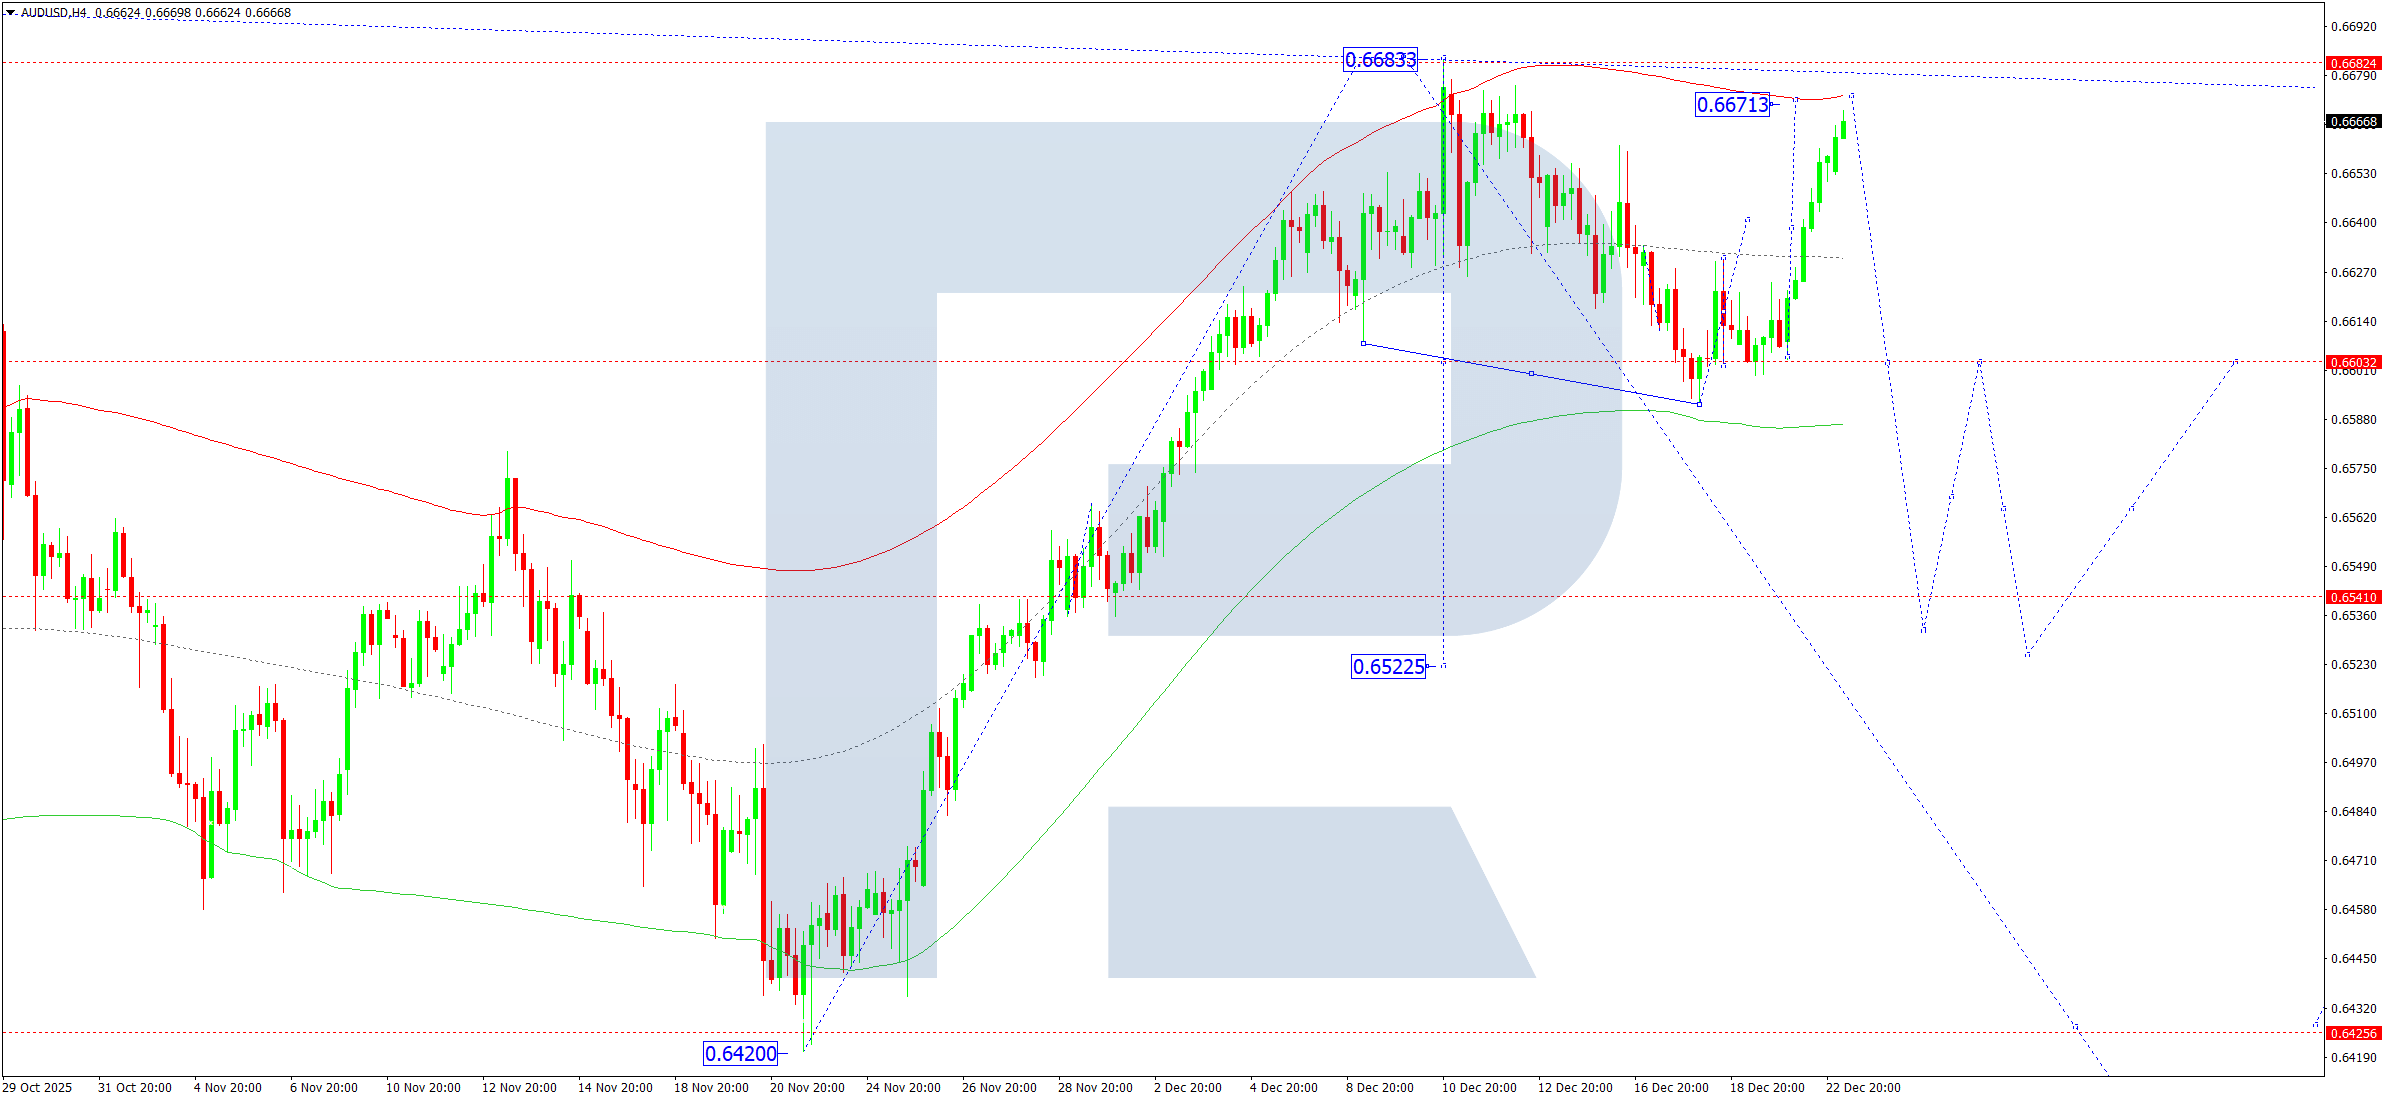
AUDUSD Forecast
On the H4 chart, AUDUSD continues to move sideways within a consolidation range centered near 0.6632. On 23 December 2025, the upper boundary has extended to 0.6669. A decline toward 0.6632 is expected, although a brief extension toward 0.6675 remains possible before a deeper move lower toward 0.6600.
This scenario is supported by the Elliott wave structure and the Matrix of the bullish wave, with a key rotation level at 0.6545. Price action is currently consolidating around the central line of the Price Envelope.
Technical indicators favor a short-term rise toward 0.6675 before renewed weakness.
Risk Warning: Past trading performance does not guarantee future results.
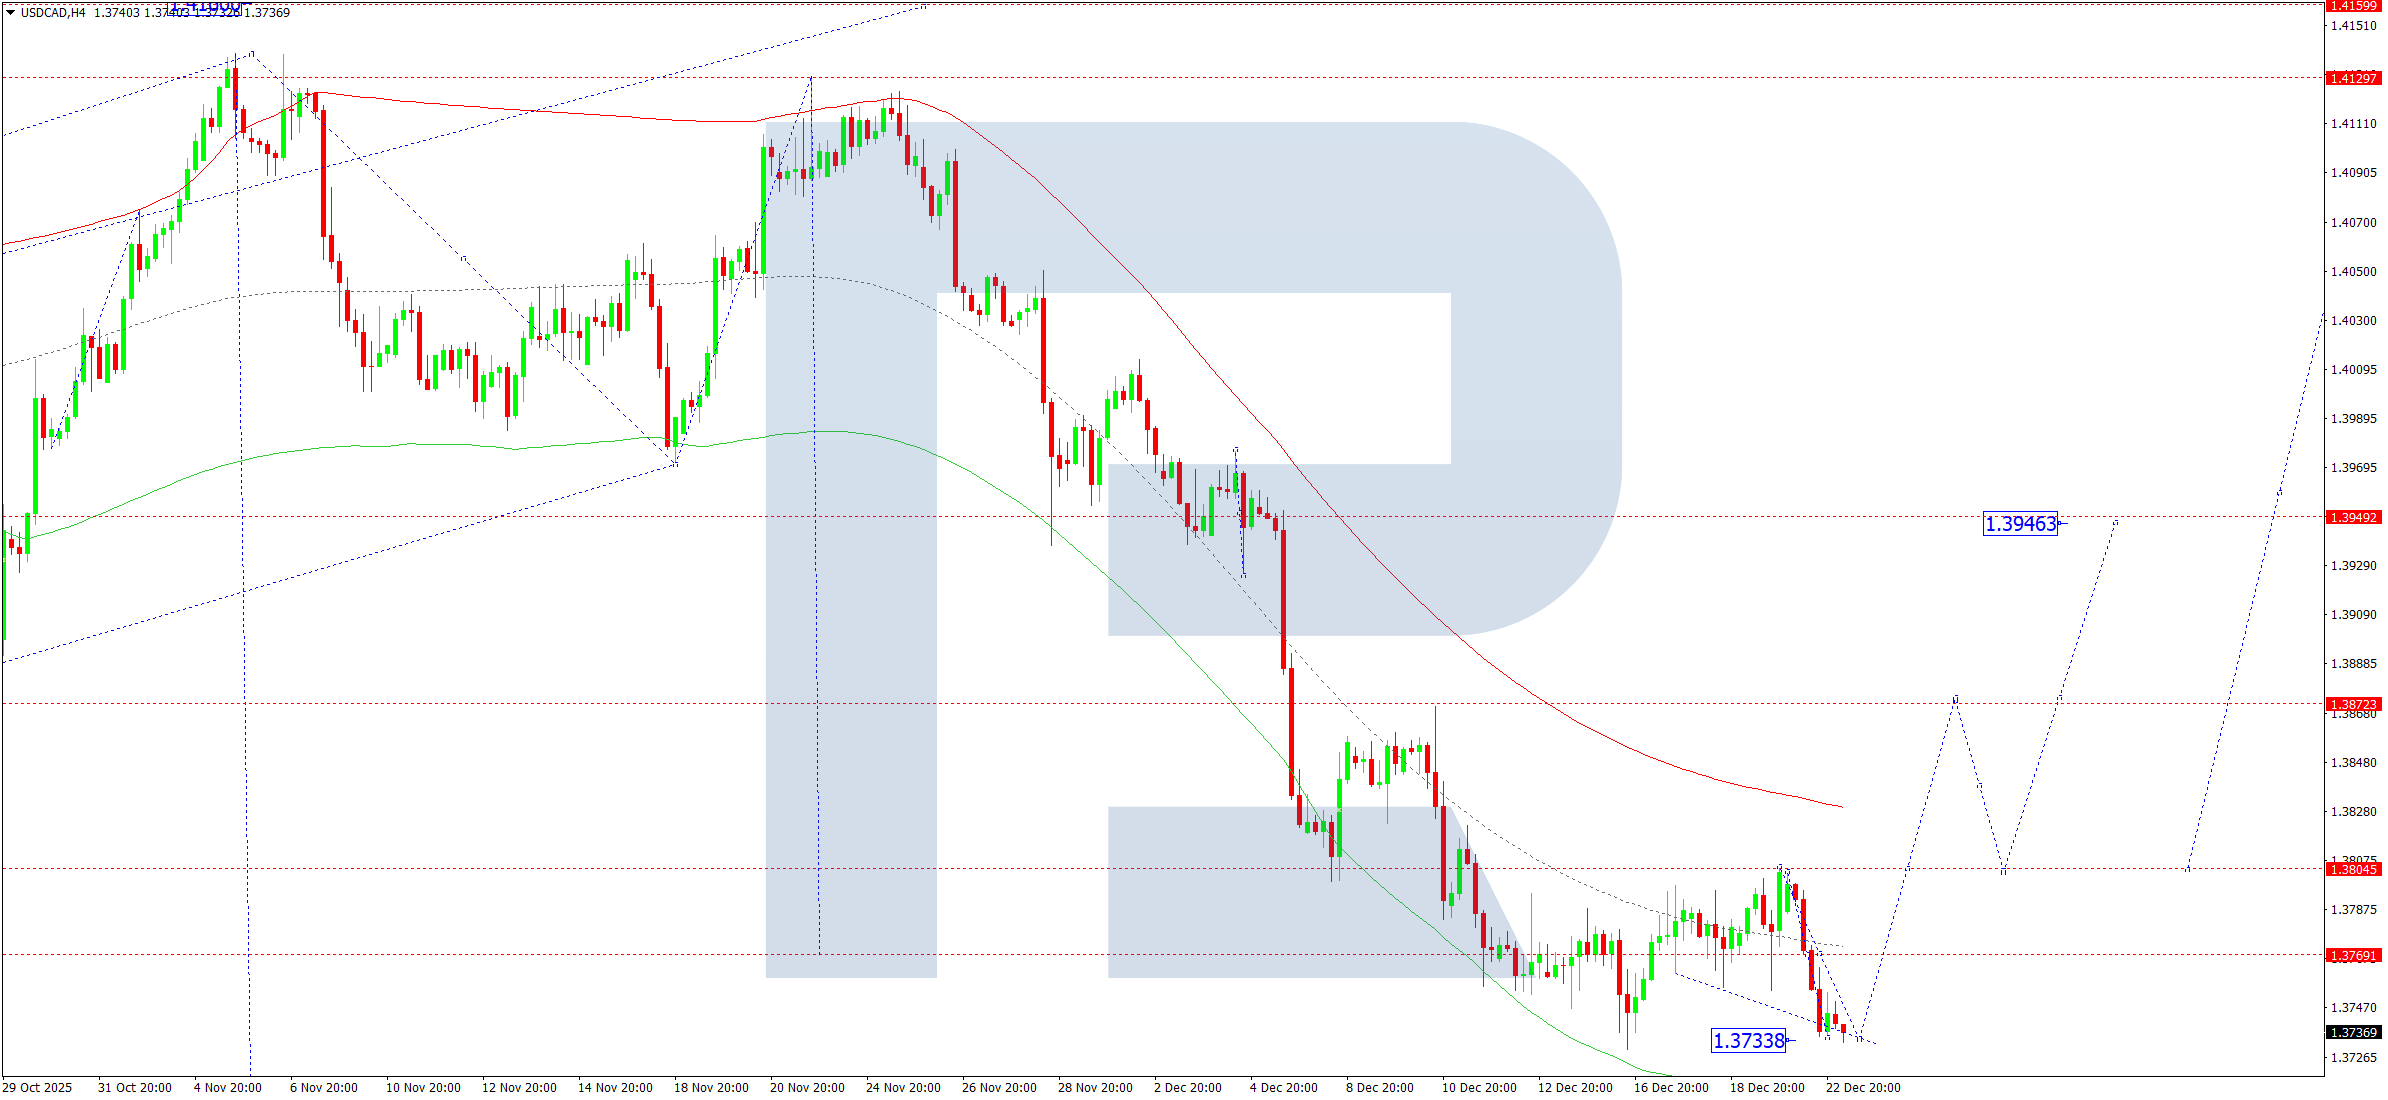
USDCAD Forecast
On the H4 chart, USDCAD remains in a consolidation phase around 1.3770. Today, the range may extend lower toward 1.3733, followed by the start of a new upward wave targeting 1.3805. A breakout above this resistance could open the path toward 1.3873.
Technically, this view is confirmed by the Elliott wave structure and the Matrix of the bearish wave, with a rotation center at 1.3950. The market continues to consolidate around the central line of the Price Envelope at 1.3770, with upside breakout potential toward 1.3805.
Technical indicators indicate a growing probability of an upward move toward 1.3804.
Risk Warning: Past trading performance does not guarantee future results.
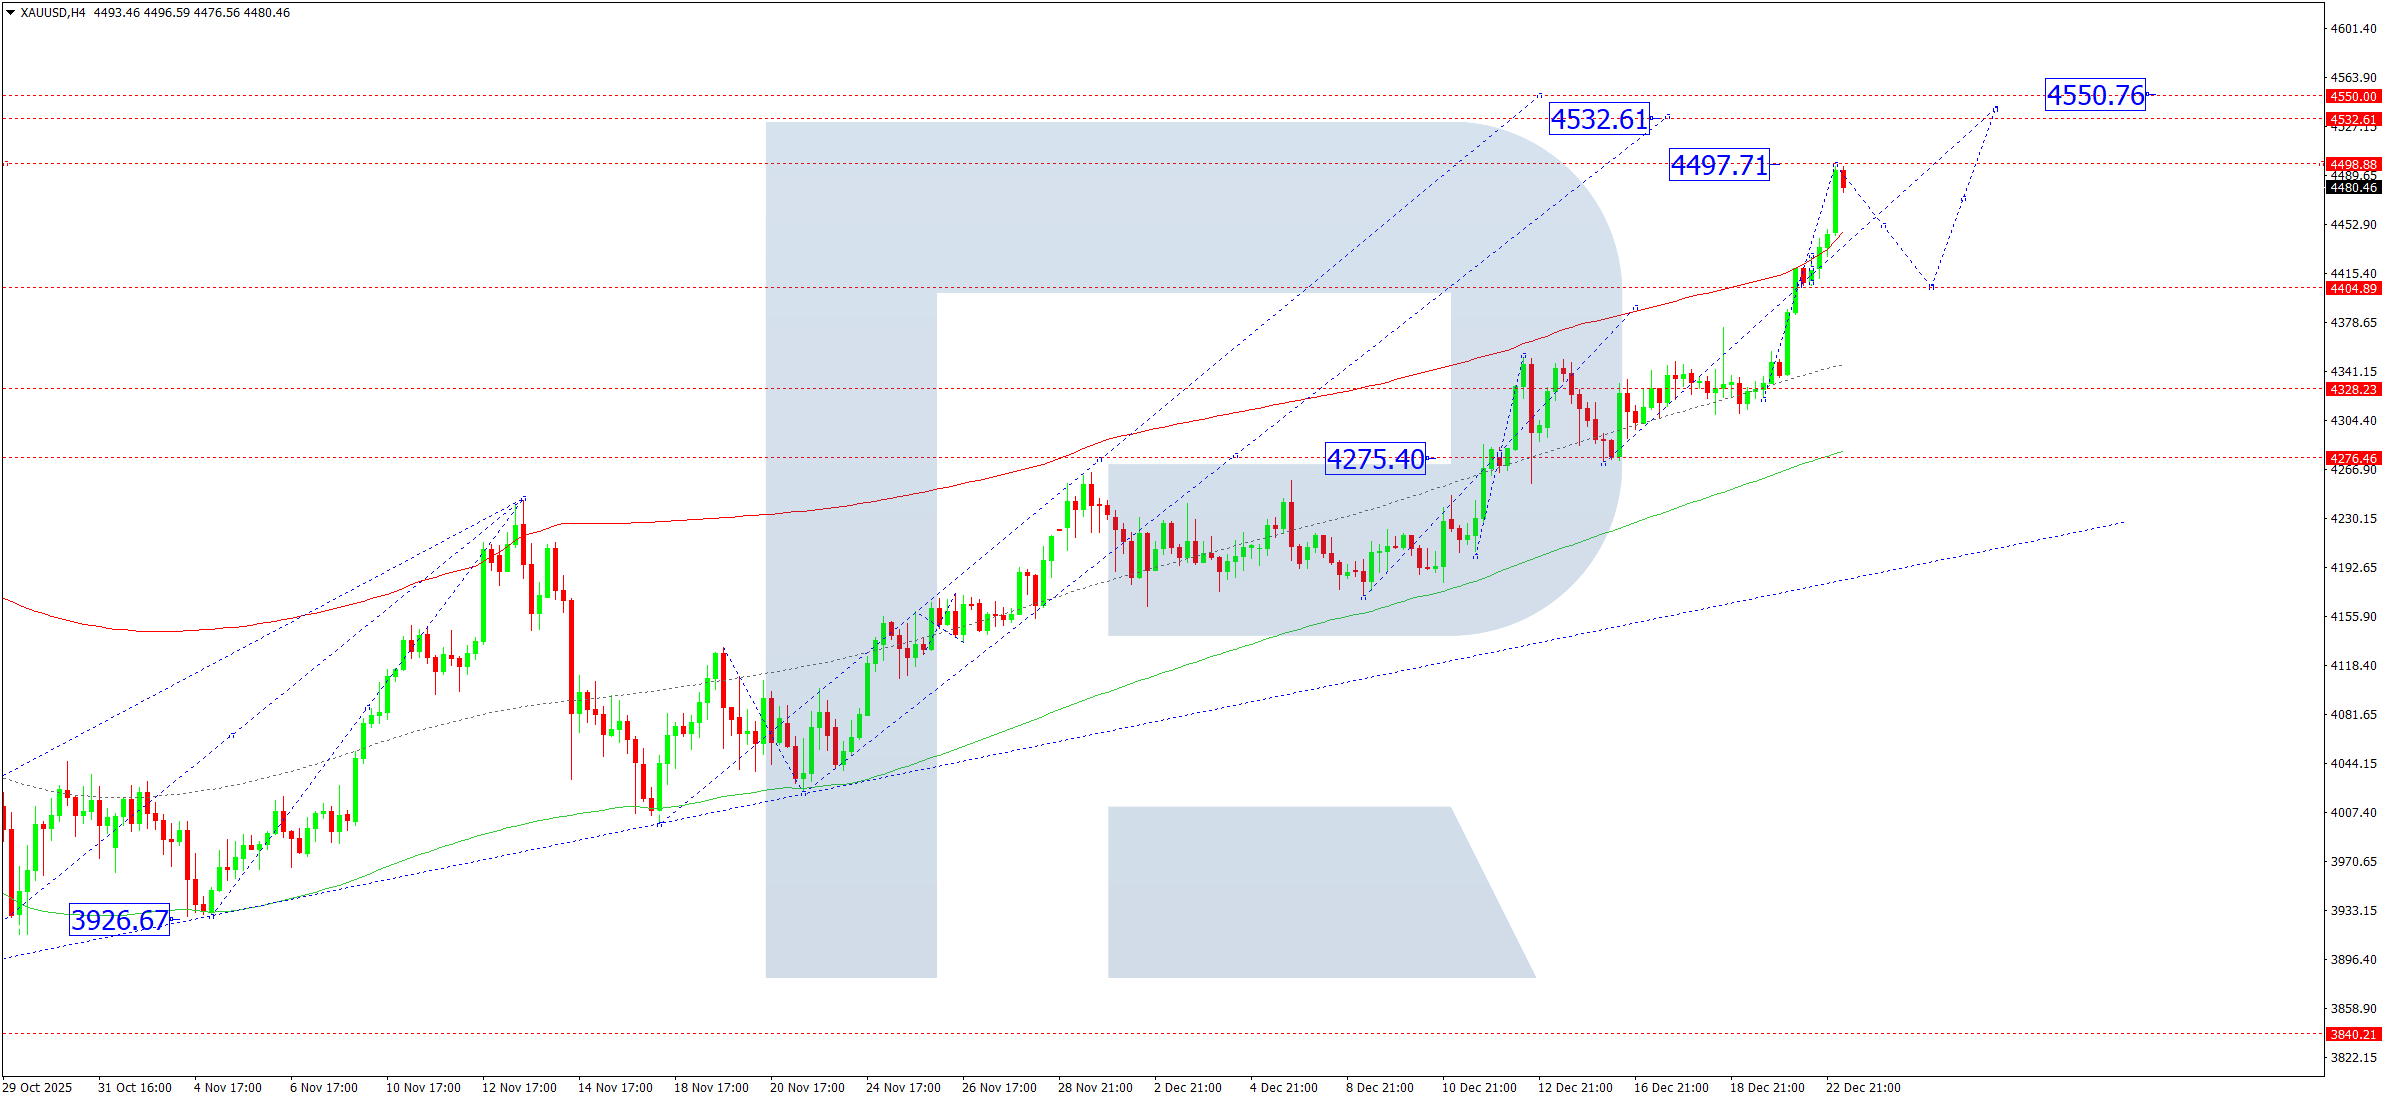
XAUUSD (Gold) Forecast
On the H4 chart, XAUUSD has completed an upward wave reaching 4,497. For 23 December 2025, a corrective pullback toward 4,400 cannot be ruled out. After this correction, the bullish trend may resume toward 4,532, with further upside potential toward 4,550.
This outlook is supported by the Elliott wave structure and the Matrix of the bullish wave, with a rotation center at 4,275. The market is currently developing the fifth upward wave toward the upper boundary of the Price Envelope at 4,550. Upon reaching this zone, a deeper correction toward 4,275 may follow.
Technical indicators suggest a short-term correction toward 4,400, followed by renewed growth toward 4,532.
Risk Warning: Past trading performance does not guarantee future results.
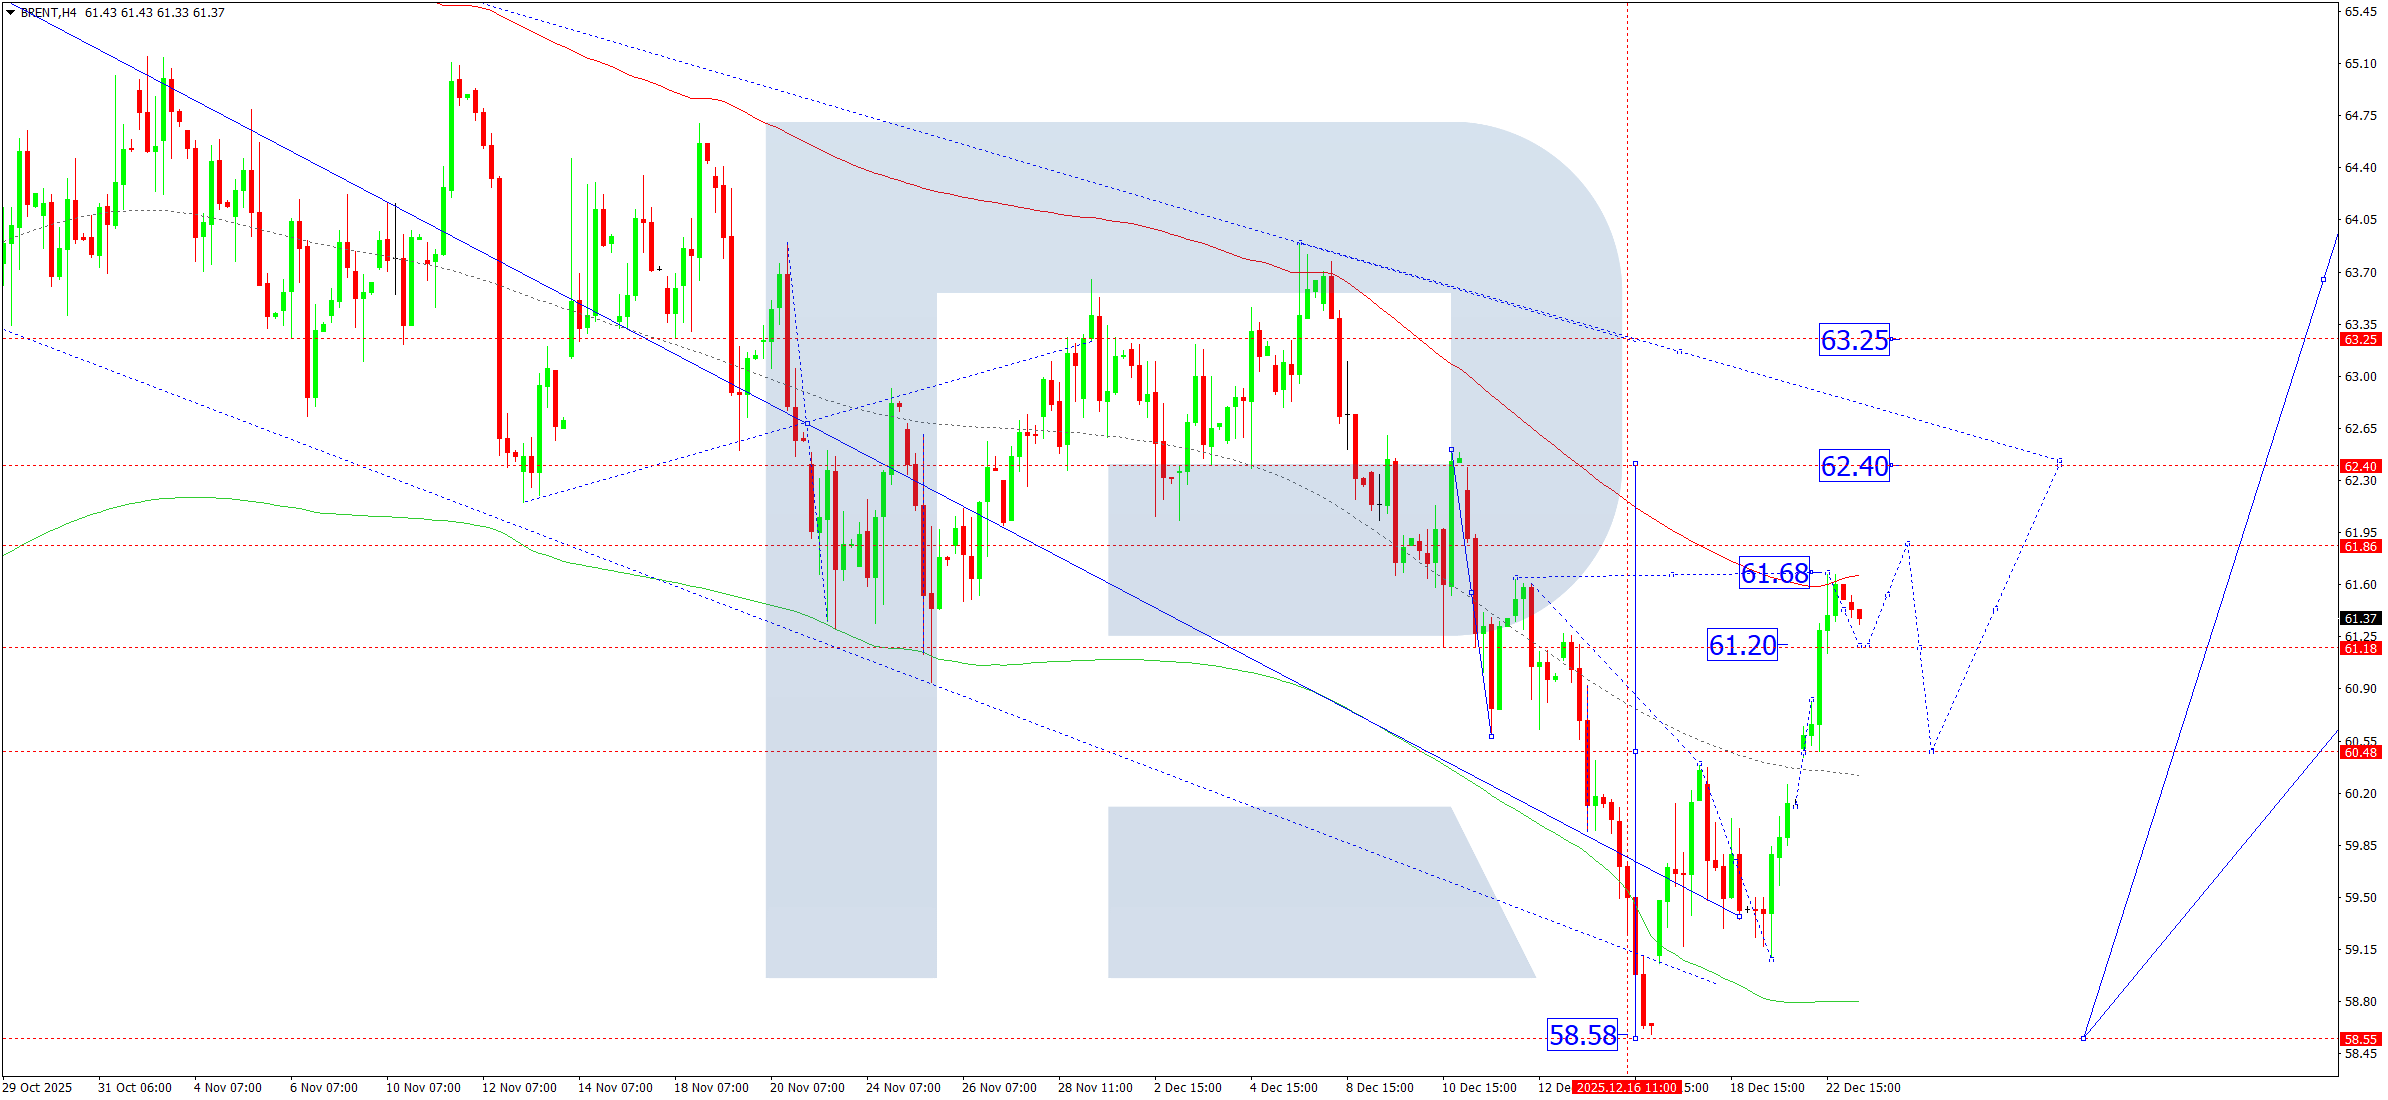
Brent Crude Oil Forecast
On the H4 chart, Brent crude has completed an upward move to 61.68. For today, a corrective decline toward 61.20 is expected, followed by another upward leg toward 61.86. After reaching this local target, a deeper correction toward 60.50 is possible before the trend resumes toward 62.40, which represents the first major upside objective.
This scenario is confirmed by the Elliott wave structure and the Matrix of the bullish wave, with a rotation center at 60.50. Price action recently formed an upward impulse toward the upper boundary of the Price Envelope at 61.68, after which a corrective move toward the central line at 60.50 may develop.
Technical indicators support continued growth toward 61.68, followed by a corrective pullback toward 60.50.
Risk Warning: Past trading performance does not guarantee future results.
Leave a Reply