
Daily Technical Analysis and Forecast – 14 August 2025
EURUSD Forecast
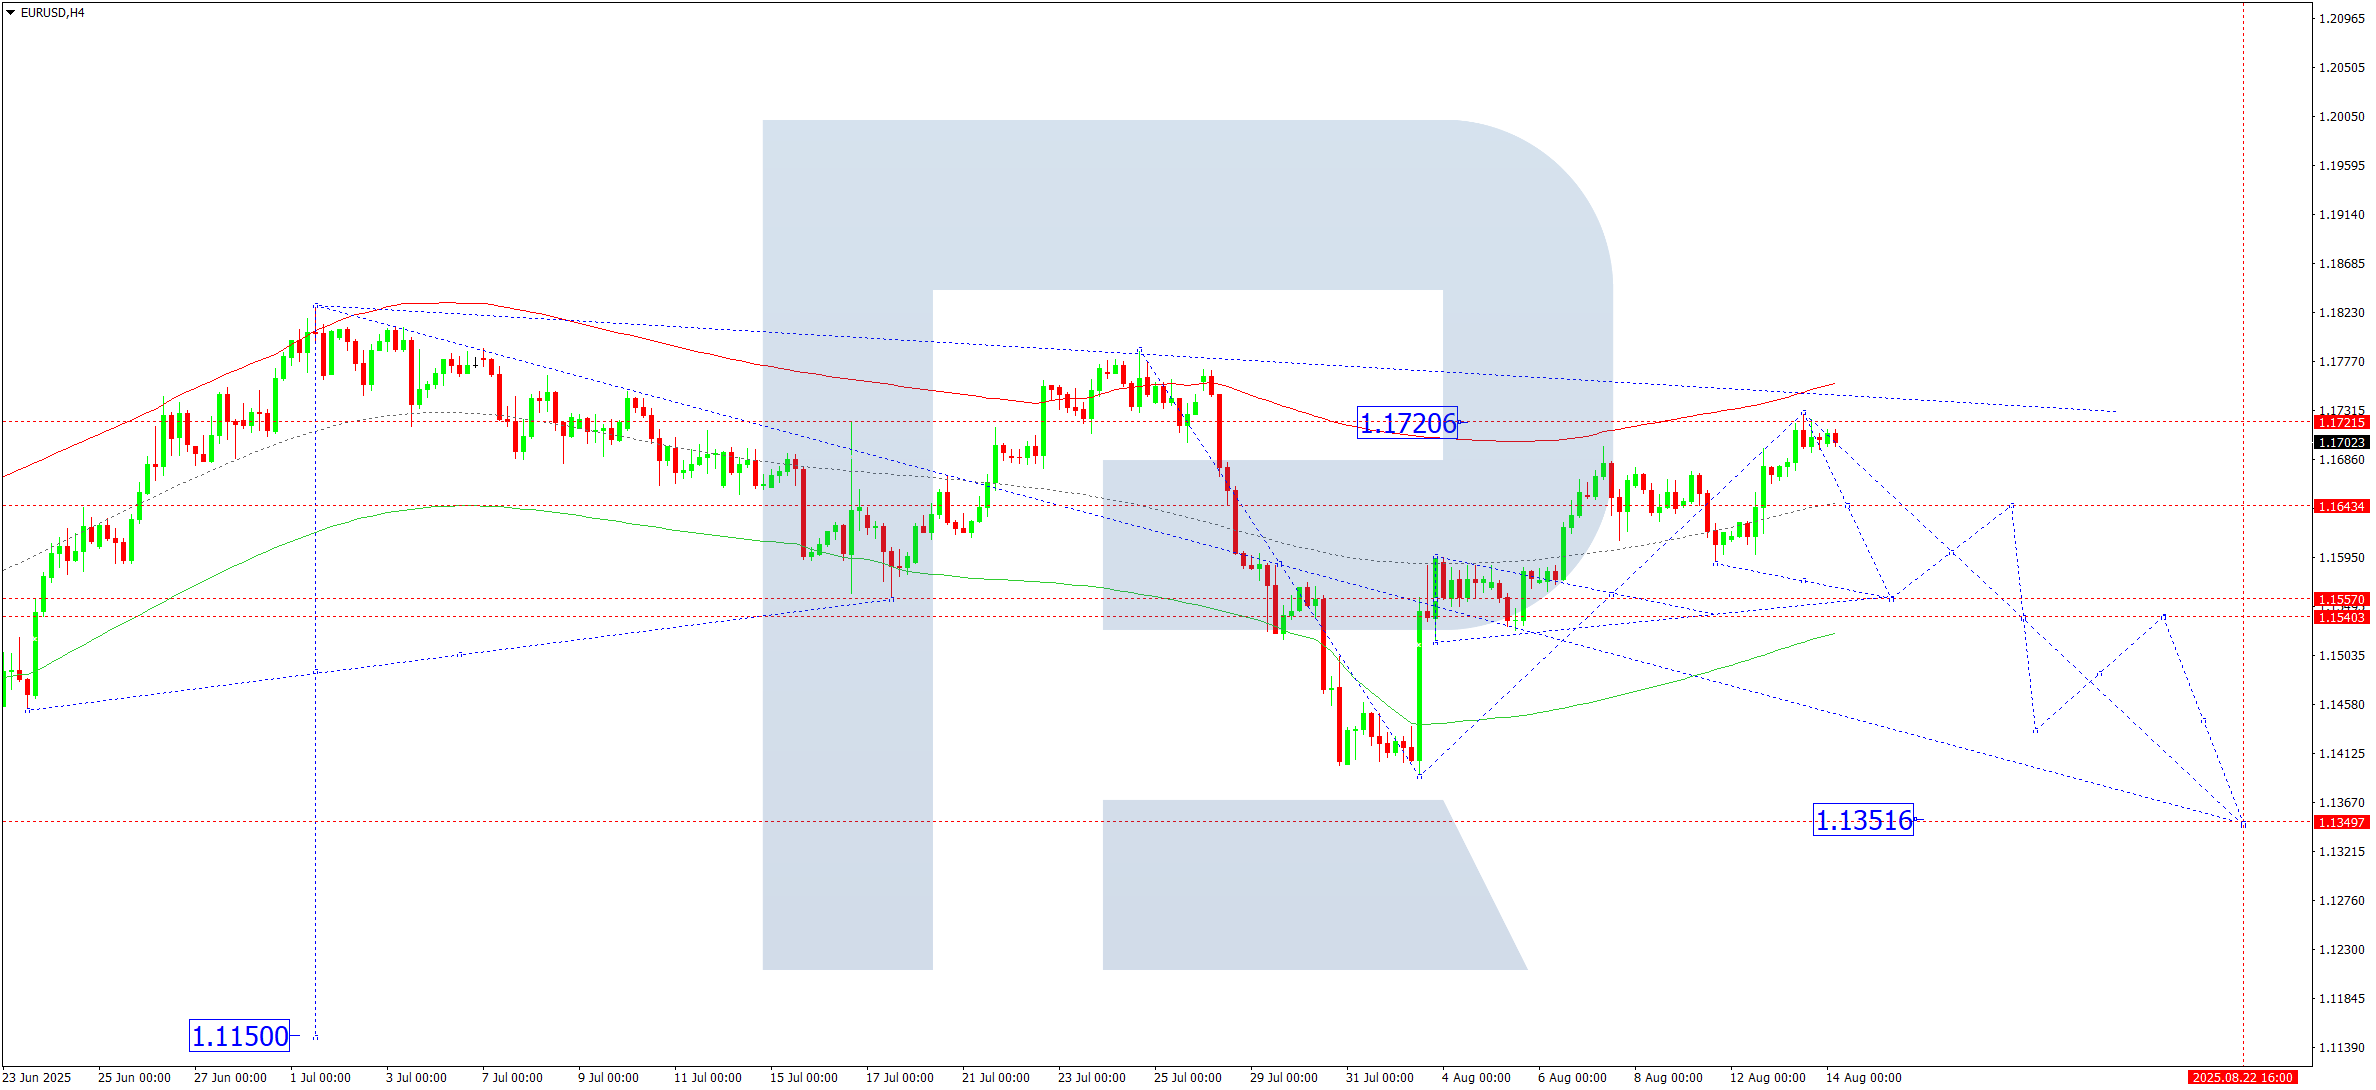
On the H4 chart, EURUSD has completed an upward corrective structure toward 1.1720, approaching the upper boundary of the Price Envelope. This level represents the likely limit of the correction. Today, a consolidation range is expected to form just below this resistance.
The primary scenario points to a downward breakout, targeting 1.1555 for a retest from above. A short-term bounce toward 1.1644 may follow, but the broader expectation remains bearish, with the next targets at 1.1444 and possibly 1.1352.
The wave structure aligns with the Elliott pattern, where the pivot at 1.1590 plays a critical role in confirming further decline.
📉 Technical indicators support a move lower toward 1.1555.
USDJPY Forecast
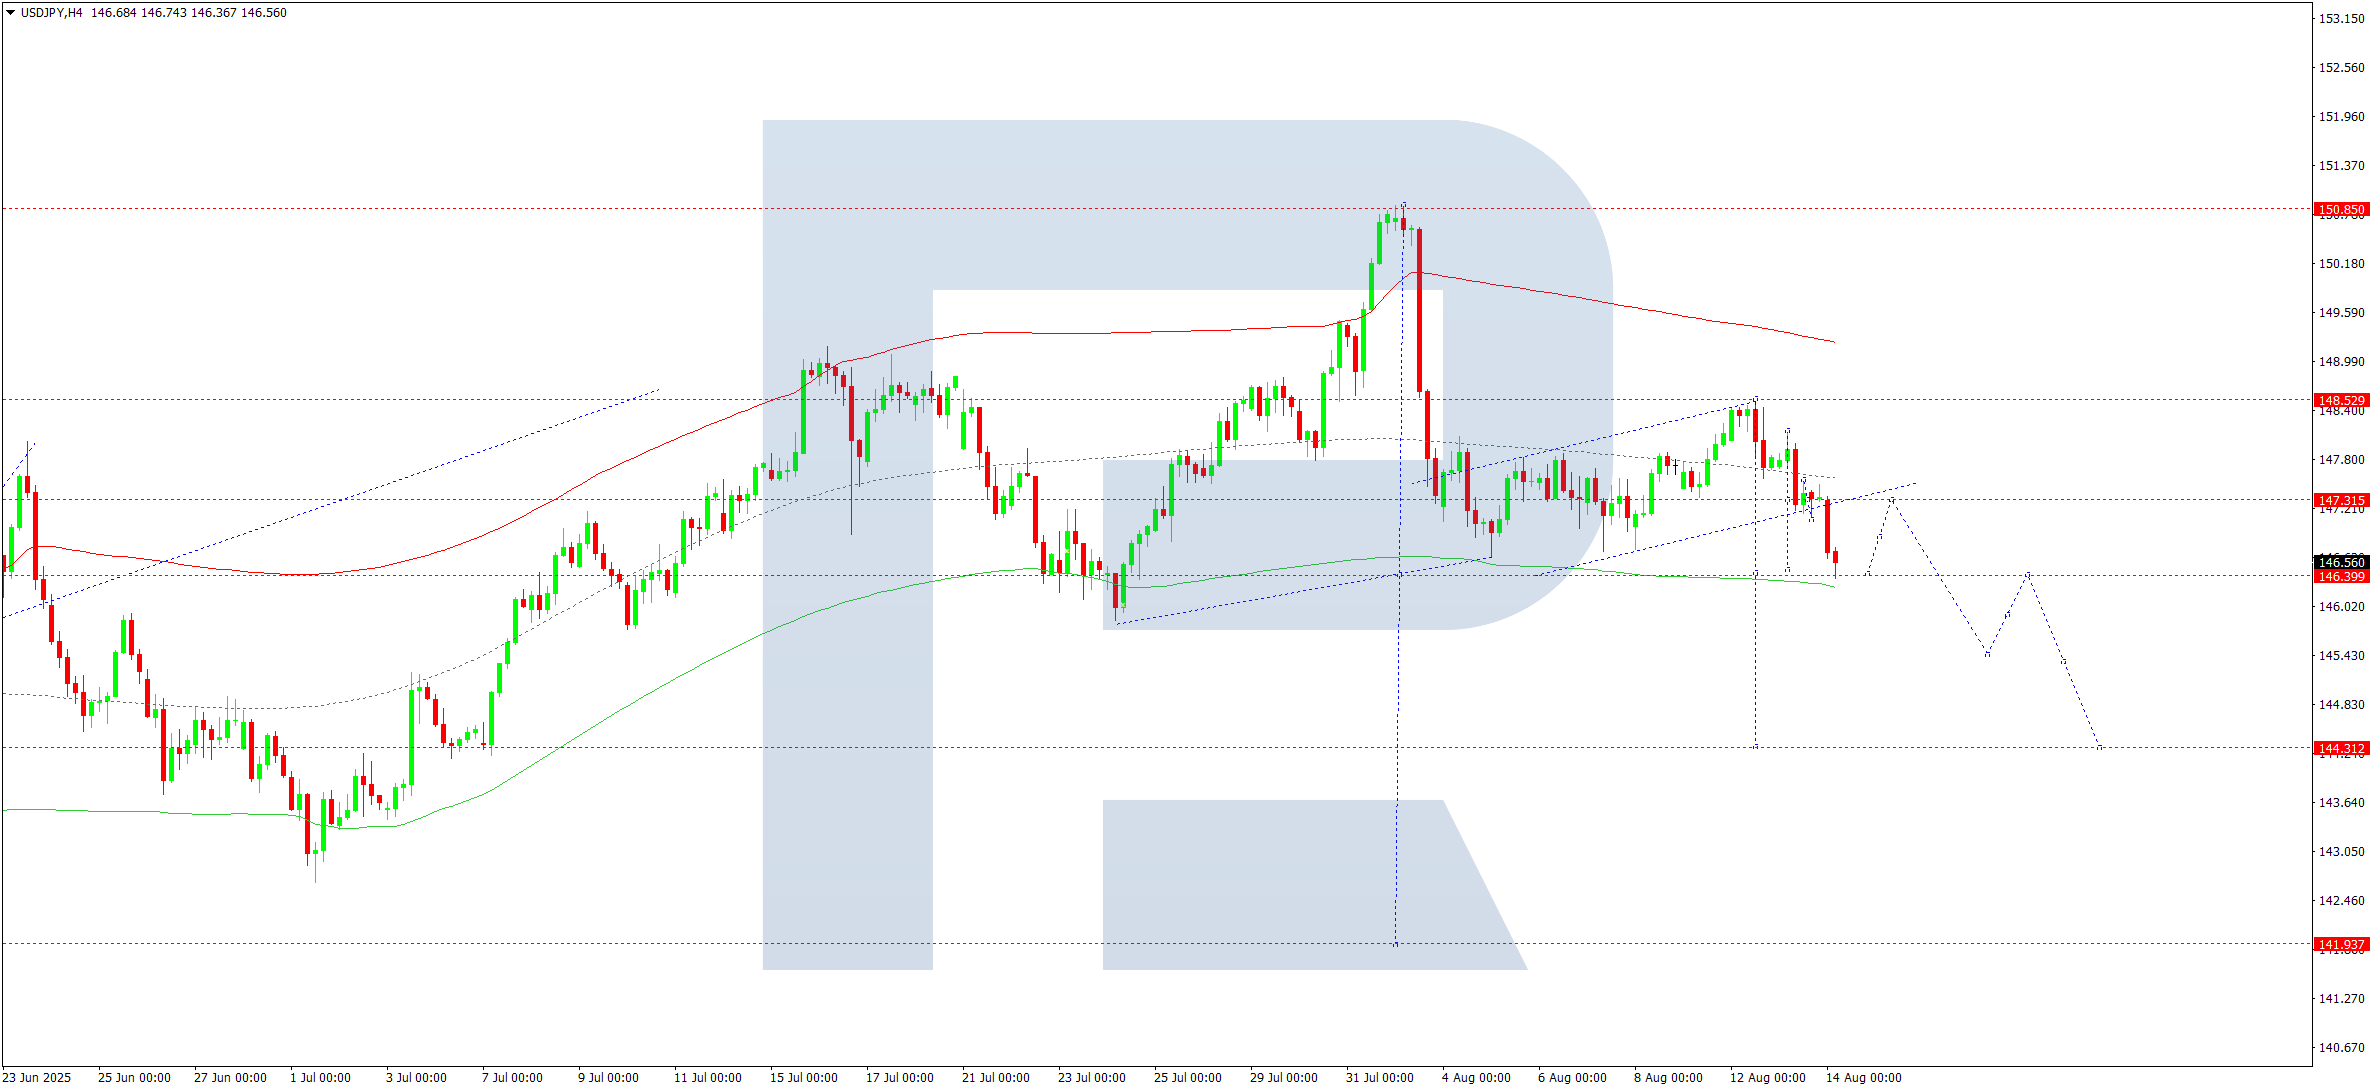
On the H4 timeframe, USDJPY recently completed a bearish wave down to 147.31, followed by a tight consolidation. The market has broken below this range, initiating a leg toward 146.39. A potential pullback to retest 147.30 from below is likely before the decline continues toward 145.45 and potentially 144.30.
This scenario is supported by the Elliott wave formation, with a pivotal level at 146.40. The pair is moving within a Price Envelope structure, with the lower boundary projected near 144.31.
📉 Technical indicators indicate a continued decline toward 144.30.
GBPUSD Forecast
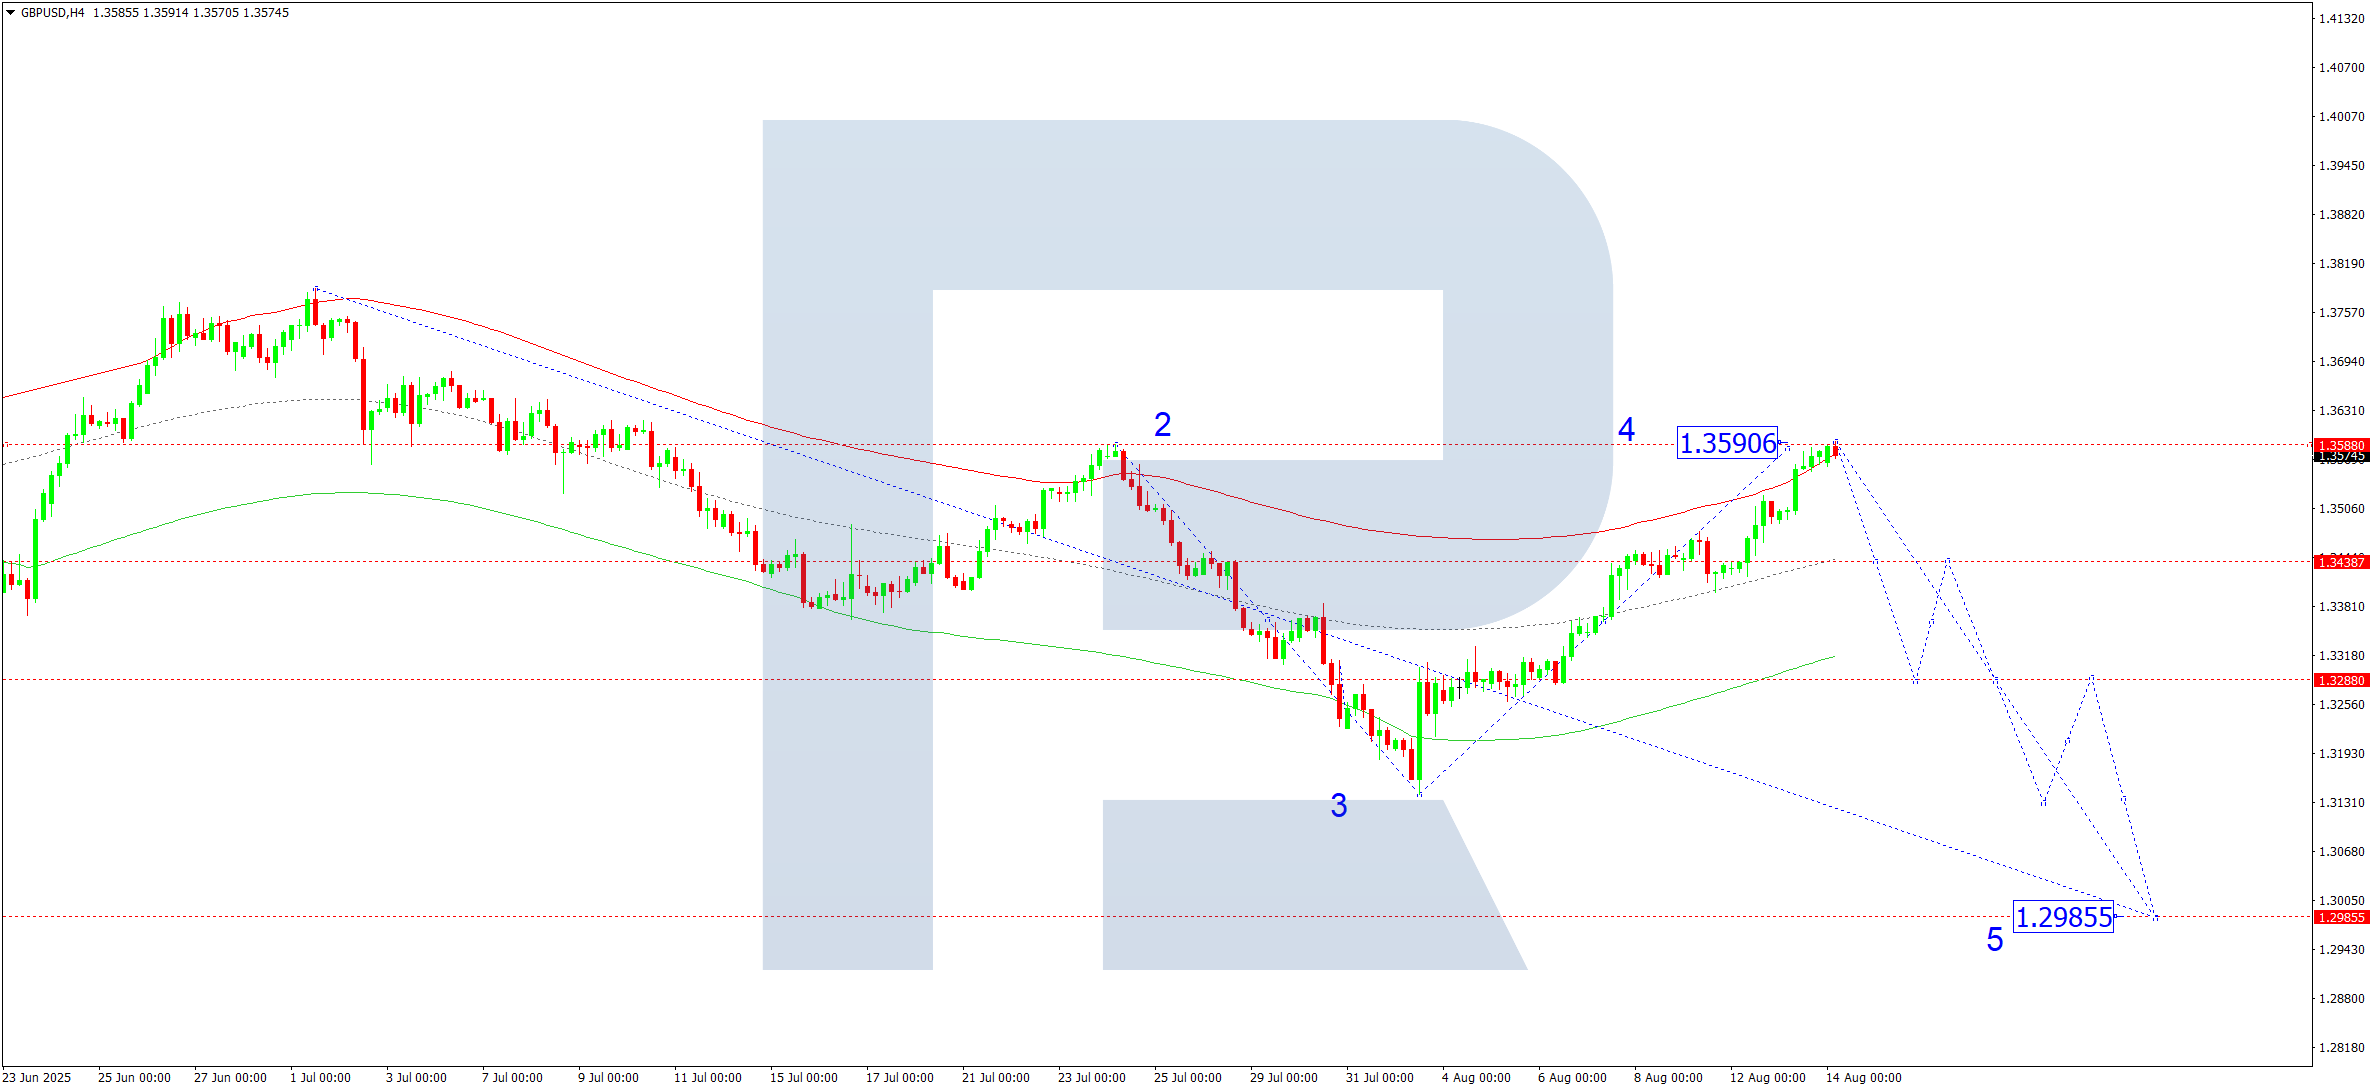
GBPUSD completed a corrective move to 1.3590. From this level, a fresh bearish wave may begin, initially targeting 1.3434. A break below this support could pave the way for further downside toward 1.3288, and ultimately, 1.2985.
The wave matrix, pivoting at 1.3366, confirms this outlook. GBPUSD is expected to consolidate below 1.3590 before pushing lower within the lower half of the Price Envelope.
📉 Technical indicators favor a downward move toward 1.3434.
AUDUSD Forecast
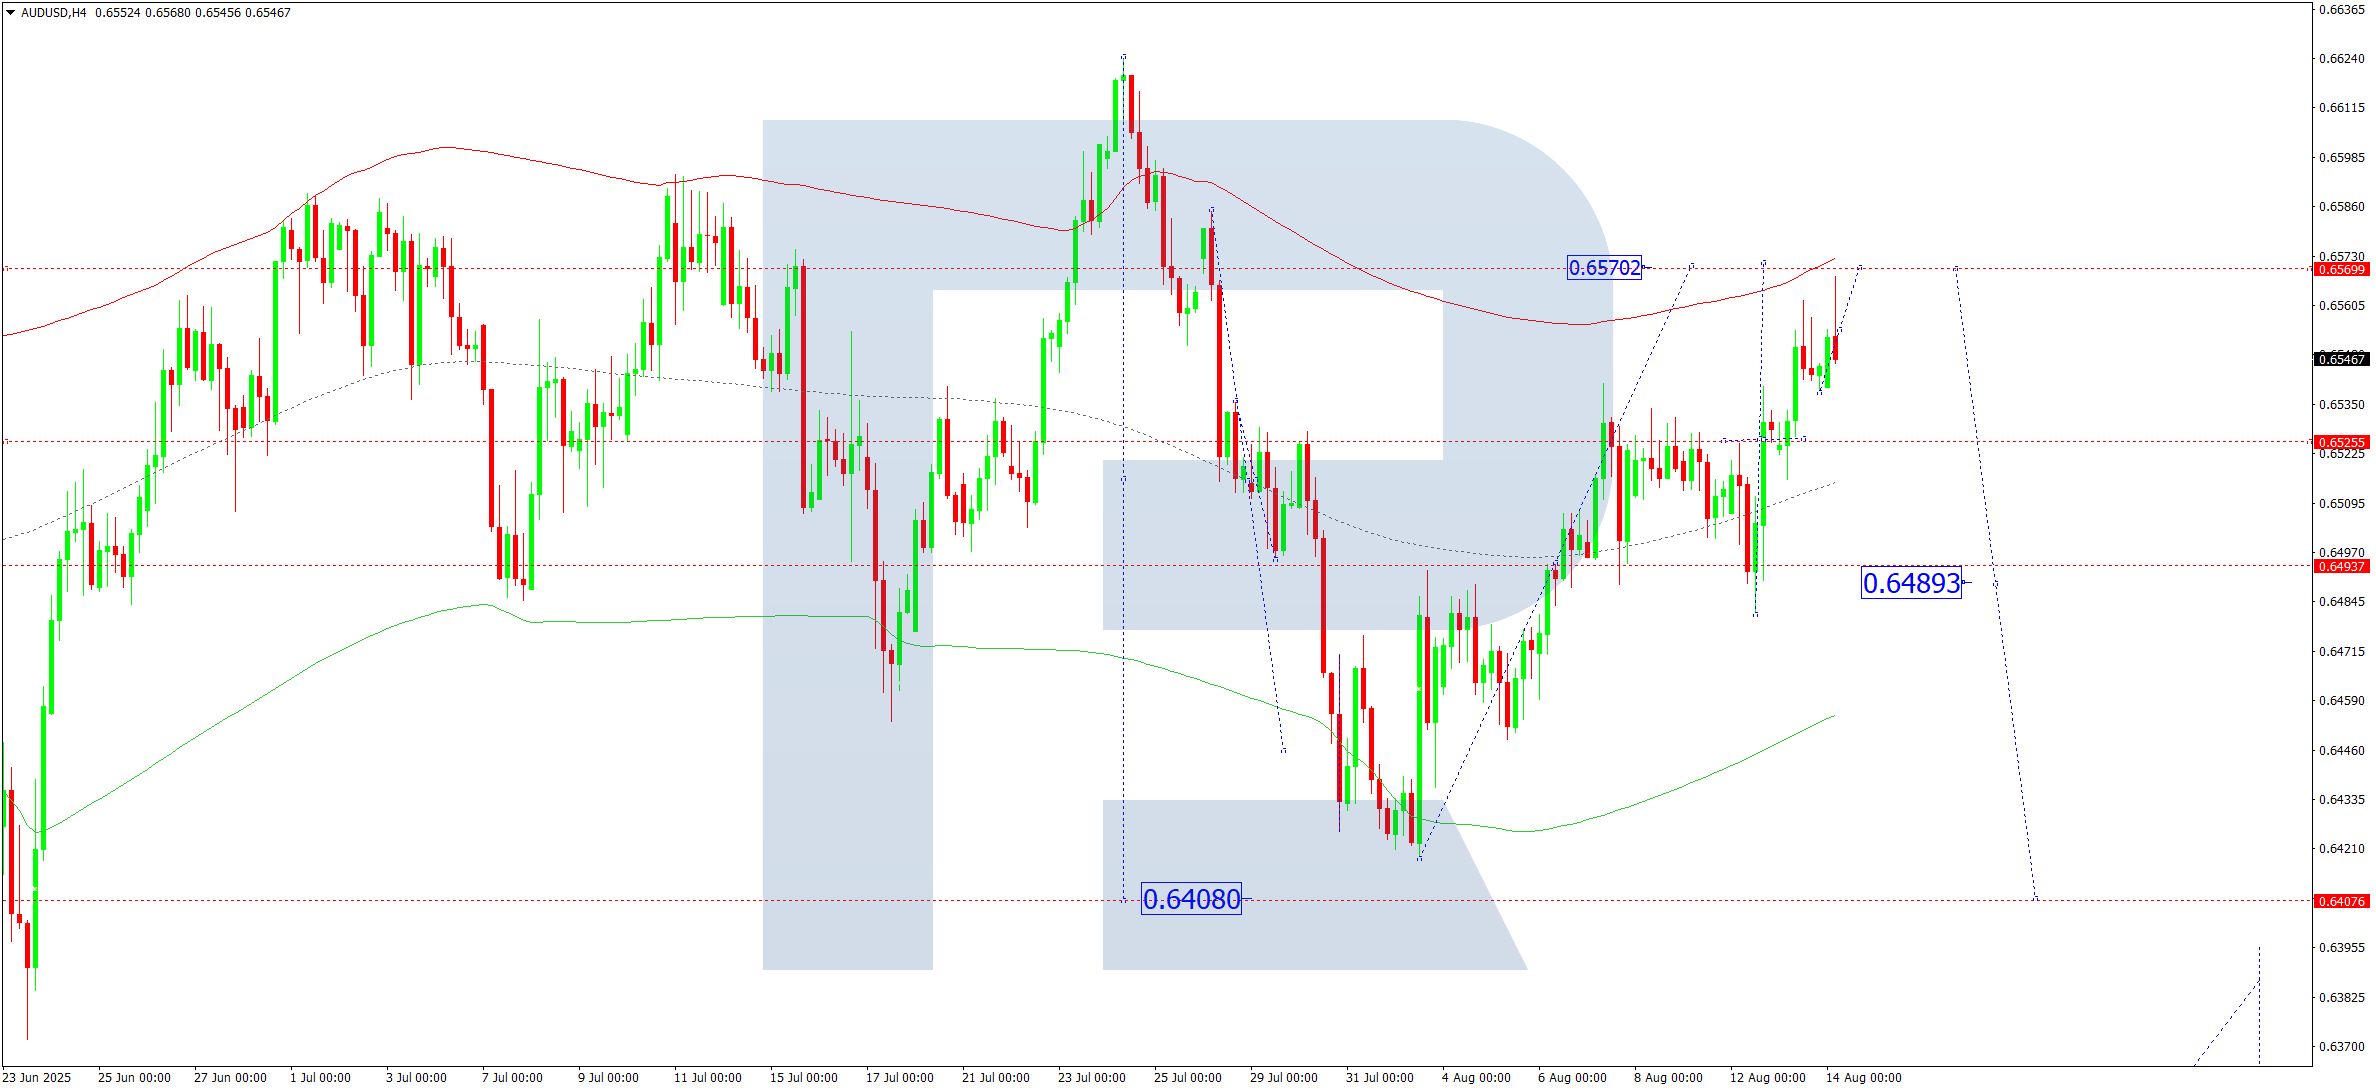
AUDUSD continues its corrective rise toward the 0.6570 resistance zone. Once this level is tested, a reversal is anticipated, with an initial target at 0.6490. A sustained move below this level would expose 0.6408 as the next support.
The Elliott wave structure and the pivot at 0.6515 confirm this bearish setup. The pair is nearing the upper edge of the Price Envelope and is likely to trend back down toward the lower boundary.
📉 Technical indicators suggest a bearish continuation toward 0.6408.
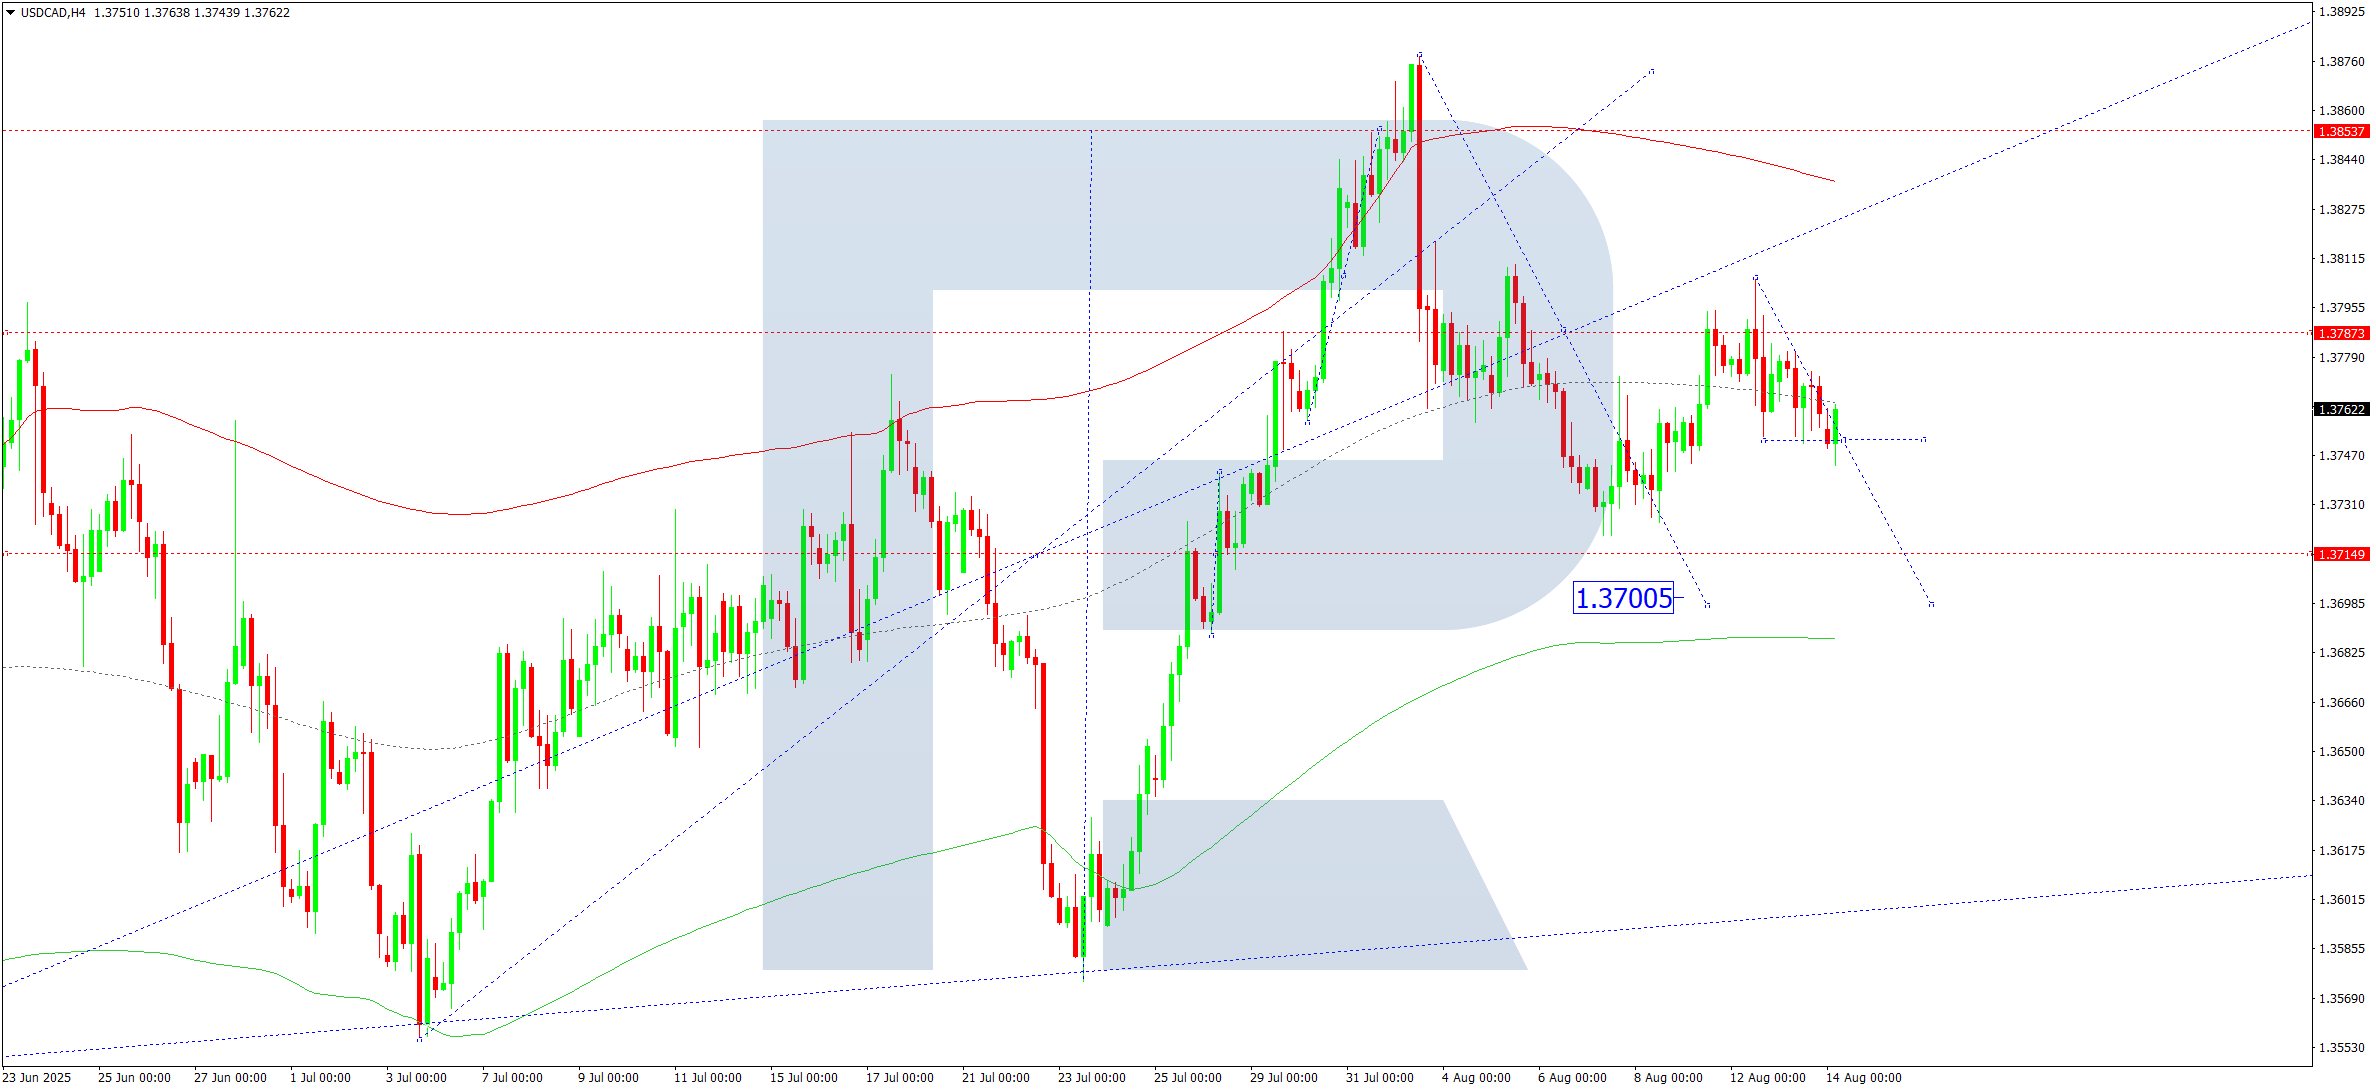
USDCAD Forecast
USDCAD has completed a downward impulse to 1.3755. A further dip toward 1.3700 is expected, forming the final phase of the correction. Once this level is reached, a reversal and growth wave could begin, aiming first for 1.3787 and potentially higher.
This movement aligns with the Elliott wave outlook, with a key pivot at 1.3715. The current drop is viewed as corrective within a broader uptrend, with possible targets at the upper Price Envelope boundary near 1.3890.
📉 Short-term indicators support a dip toward 1.3700 before potential recovery.
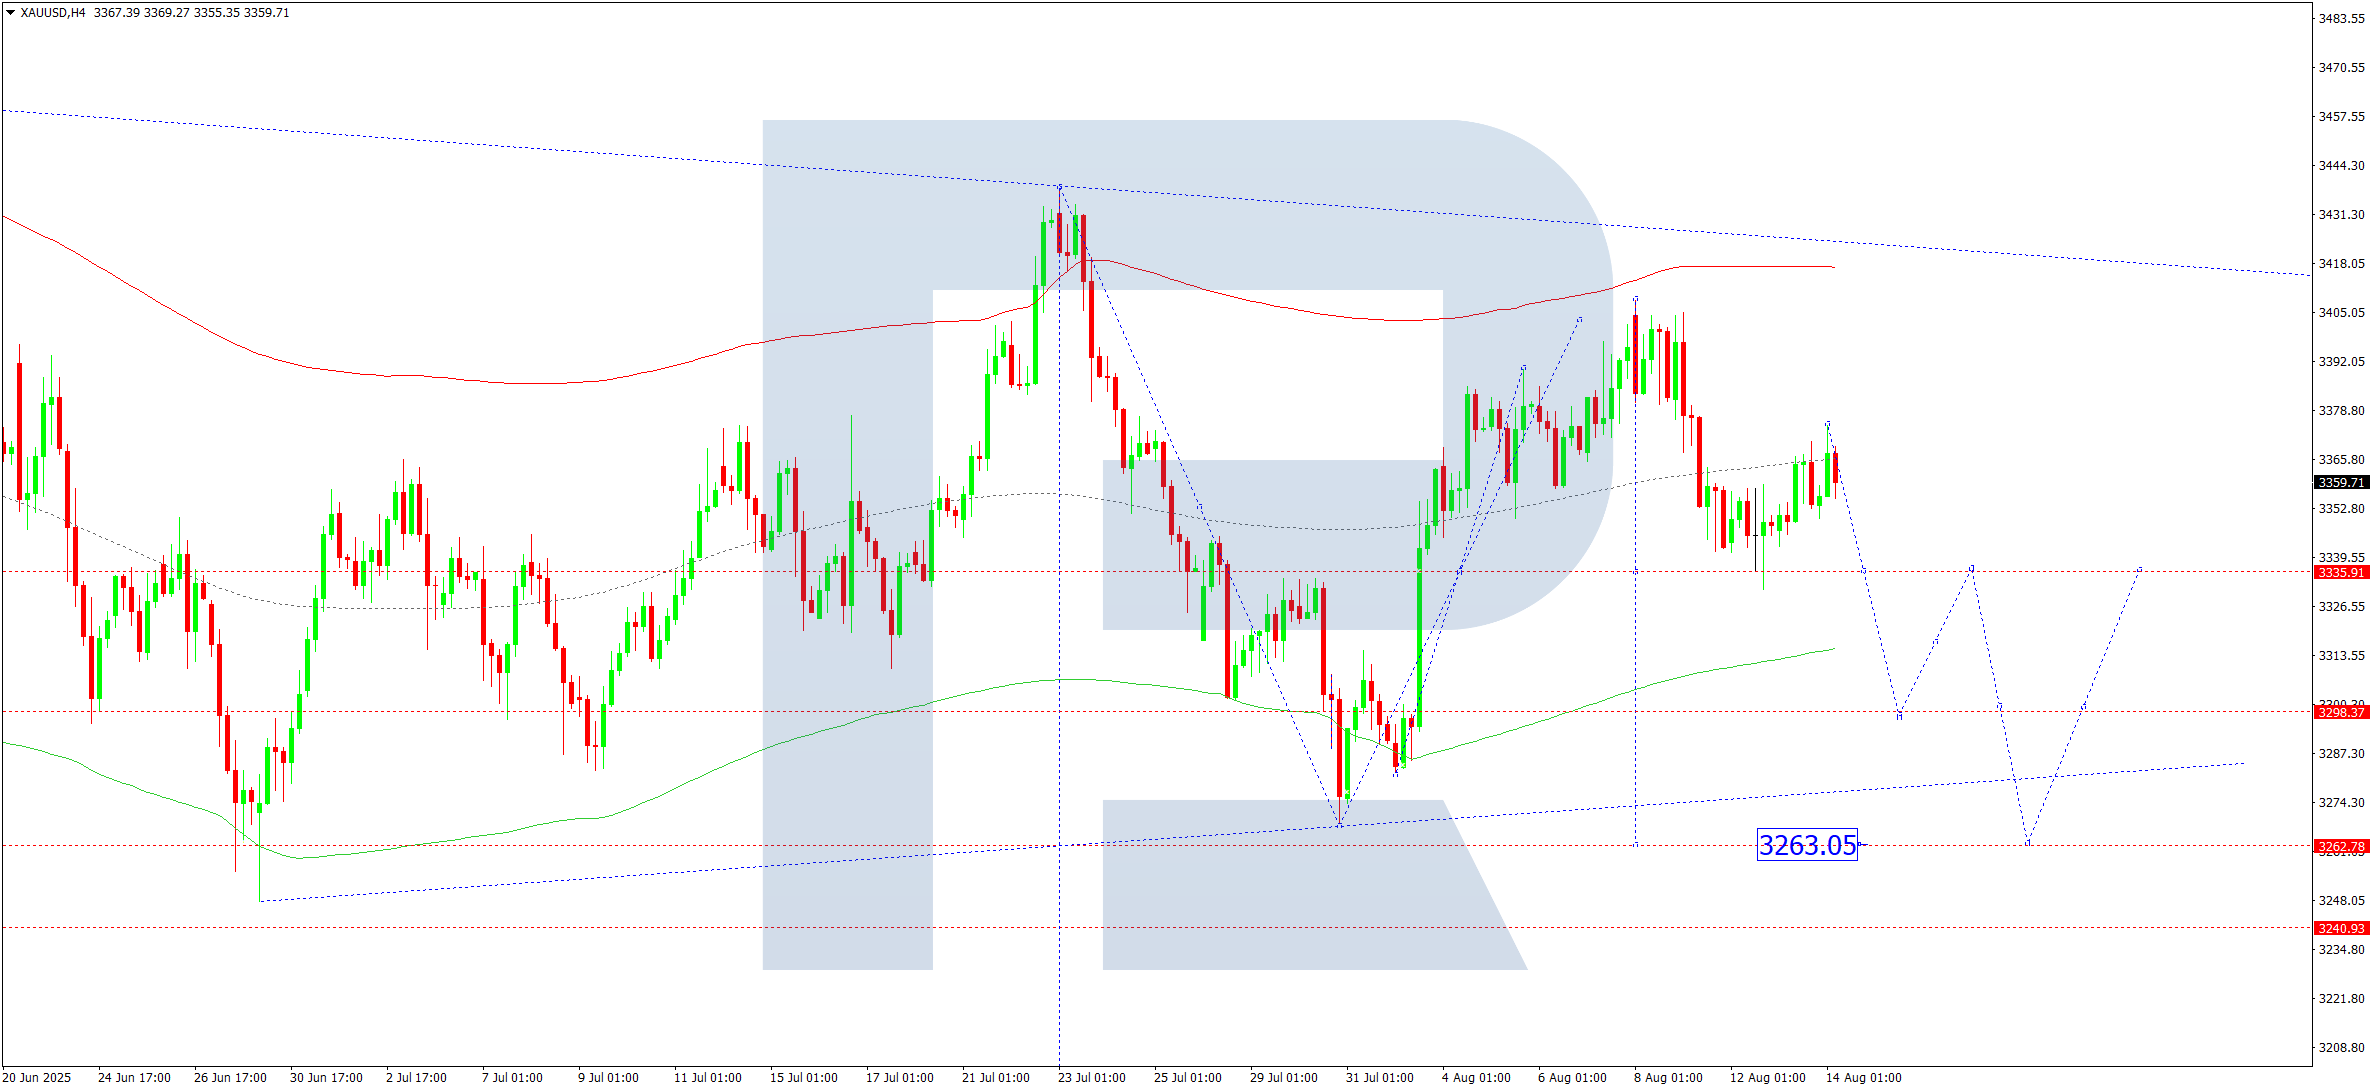
XAUUSD (Gold) Forecast
Gold (XAUUSD) completed a drop to $3,333, followed by a correction to $3,375. Today, a breakout below this range could lead to a continuation of the bearish wave, with $3,265 and $3,255 as targets.
The key pivot level at $3,333 plays a central role in confirming the bearish structure. While the short-term trend is downward toward the lower boundary at $3,298, a potential rebound toward $3,420 remains on the table afterward.
📉 Technical indicators suggest a continued correction toward $3,298.
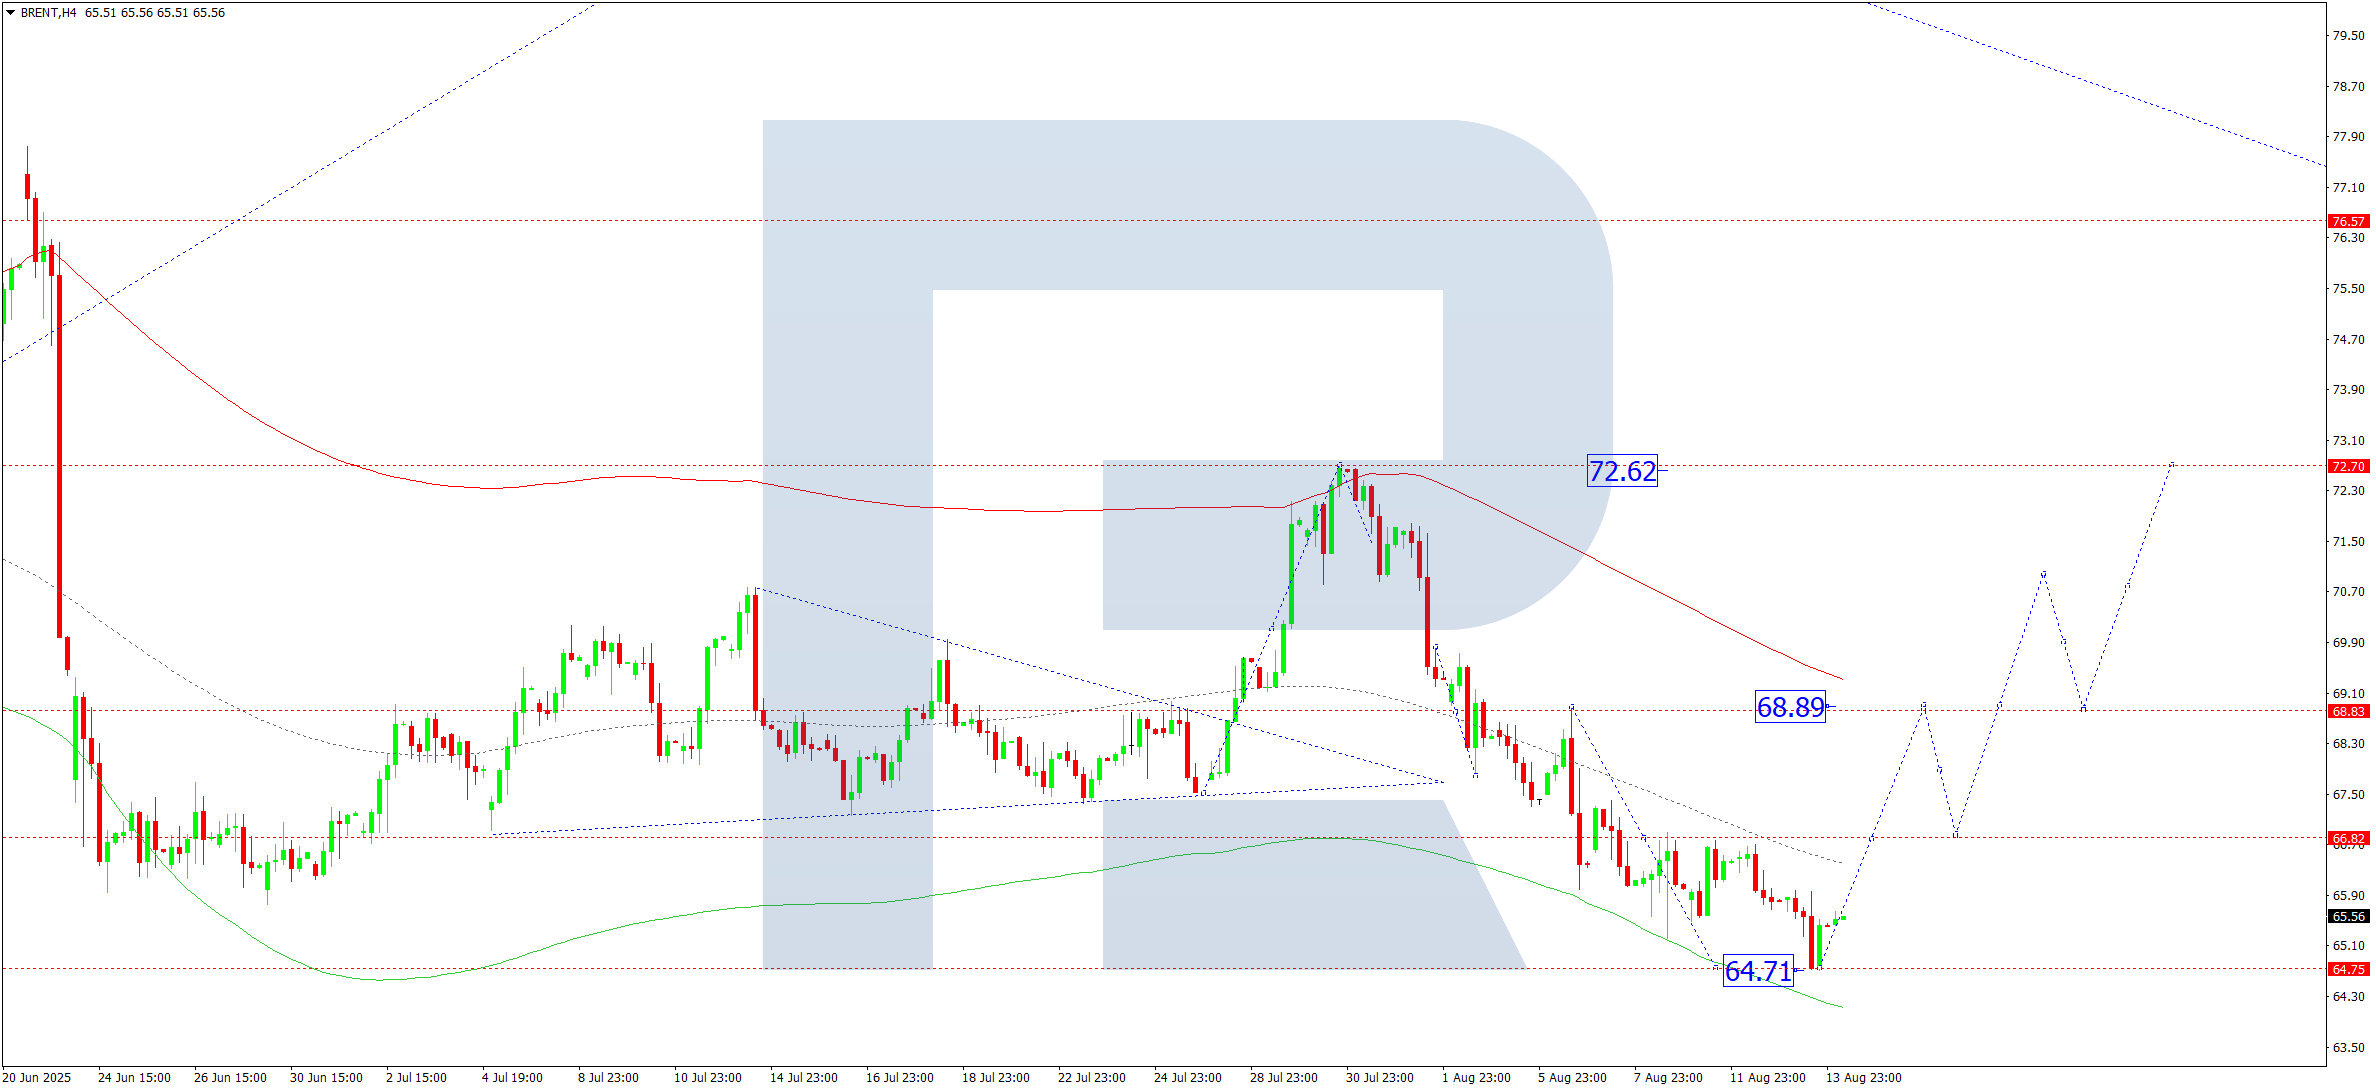
Brent Crude Oil Forecast
Brent crude completed a downward move to $64.72 and is now showing signs of a bullish reversal. A rise to $66.80 is anticipated. A breakout above this resistance could confirm the development of a new upward wave, with targets at $68.88 and potentially $72.62.
This scenario is validated by the Elliott wave structure, with the pivot set at $68.88. The market has found support near the lower edge of the Price Envelope, and further gains are likely toward the upper boundary.
📈 Technical indicators support a bullish move toward $68.88.
Disclaimer: Past performance does not guarantee future results. All trading involves risk. Use proper risk management and consult with a financial advisor if needed.
Leave a Reply