
Daily Technical Analysis and Forecast – 18 August 2025
EURUSD Forecast
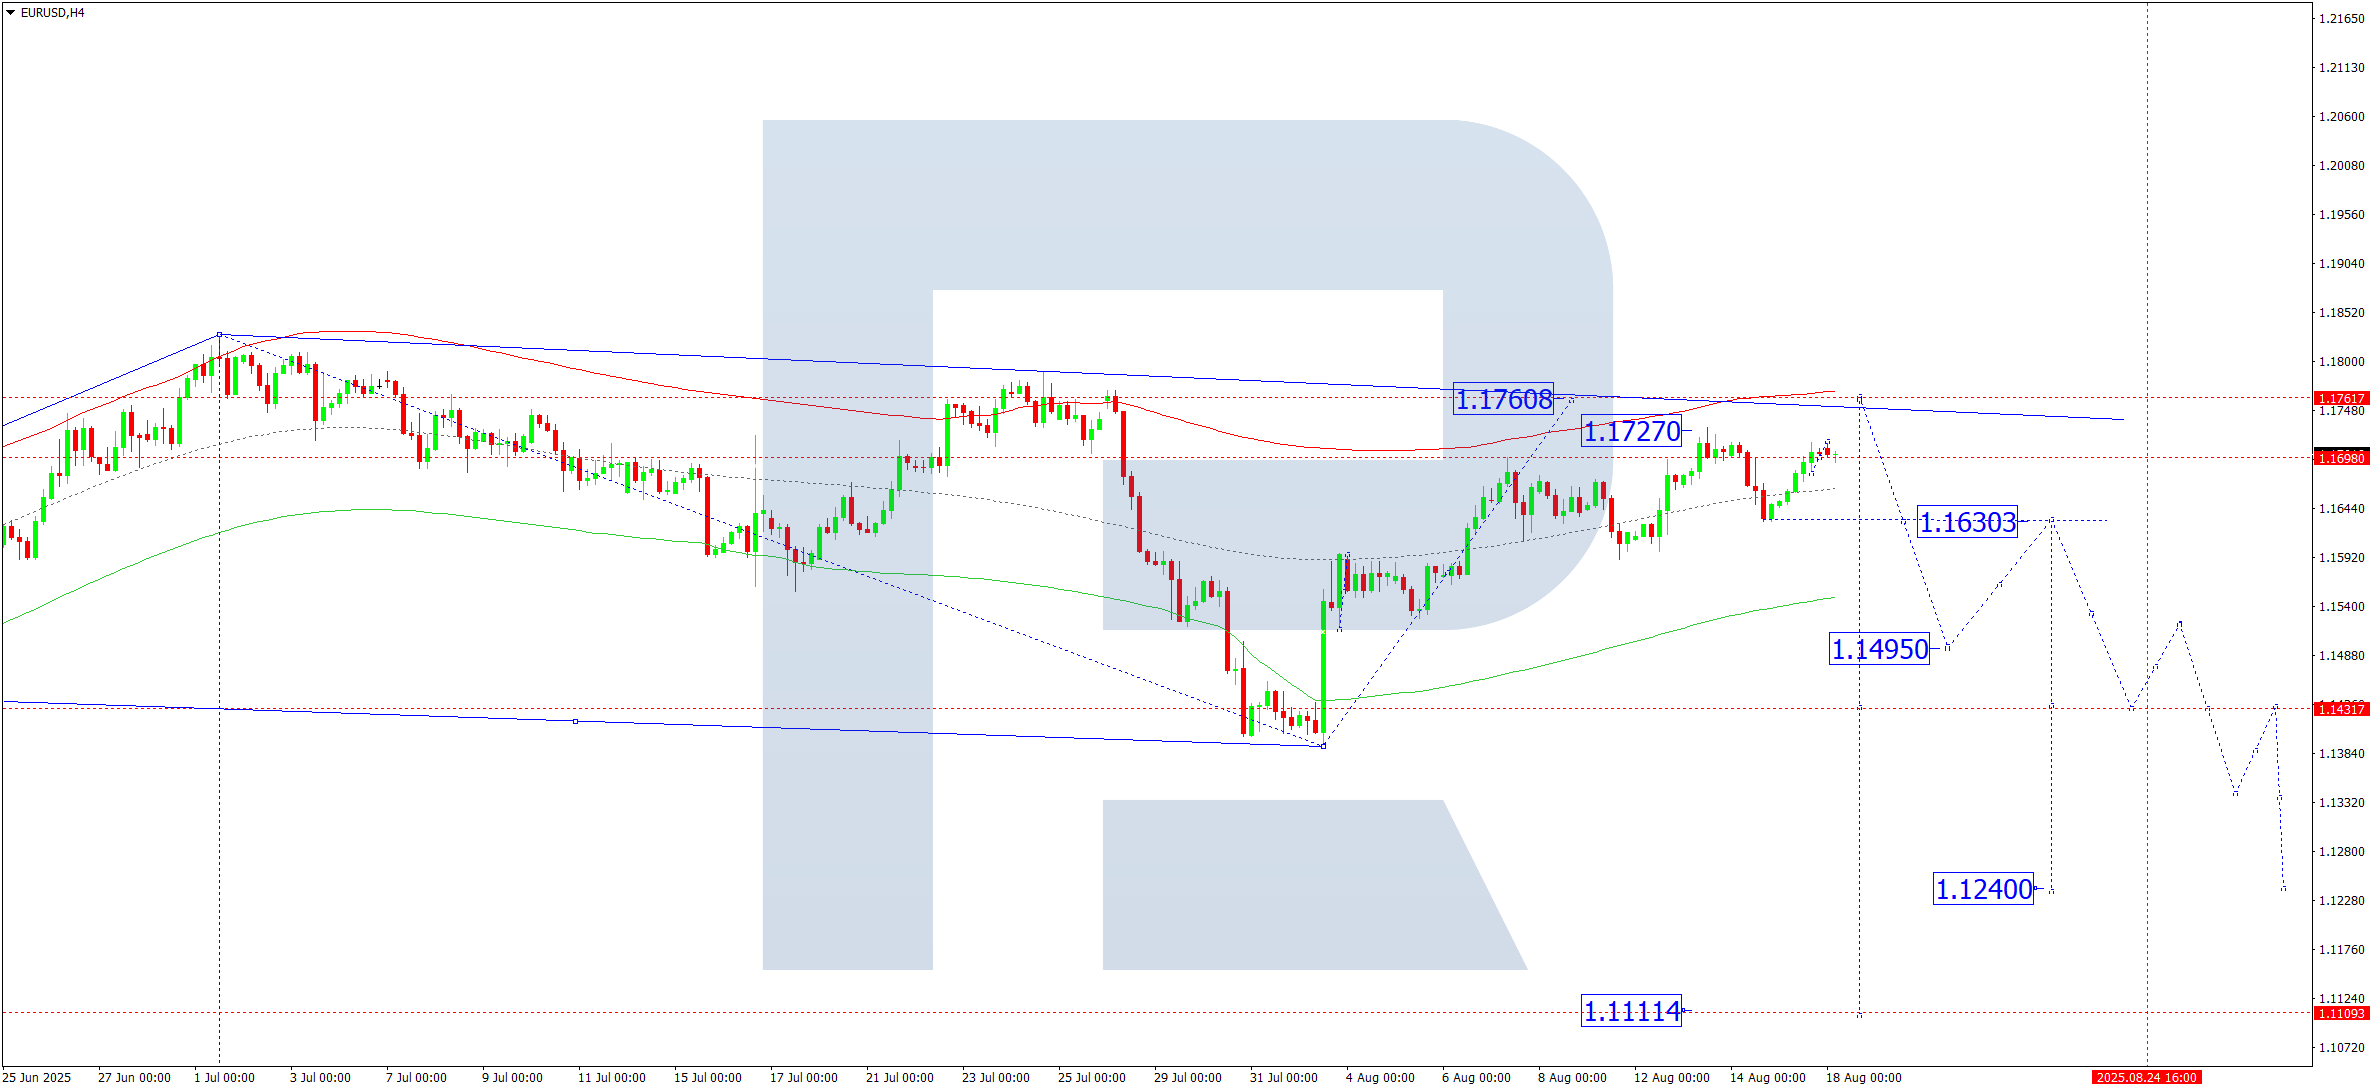
On the H4 chart, EURUSD has completed another upward move, reaching 1.1698, which likely finalizes the current corrective phase. Today, 18 August 2025, a consolidation range is expected to form around this level. While a brief rise toward 1.1760 cannot be ruled out, the primary scenario anticipates a downward breakout towards 1.1630. Subsequently, the pair may revisit 1.1690 before continuing its decline toward 1.1430, with extended targets at 1.1240 and 1.1111.
This outlook aligns with the Elliott Wave structure and the bearish wave matrix, with the key pivot point identified at 1.1590. Currently, price action is approaching the upper boundary of the Price Envelope near 1.1760, from where a new downward wave is expected toward the lower boundary at 1.1495.
Technical indicators suggest a bearish move toward 1.1495.
USDJPY Forecast
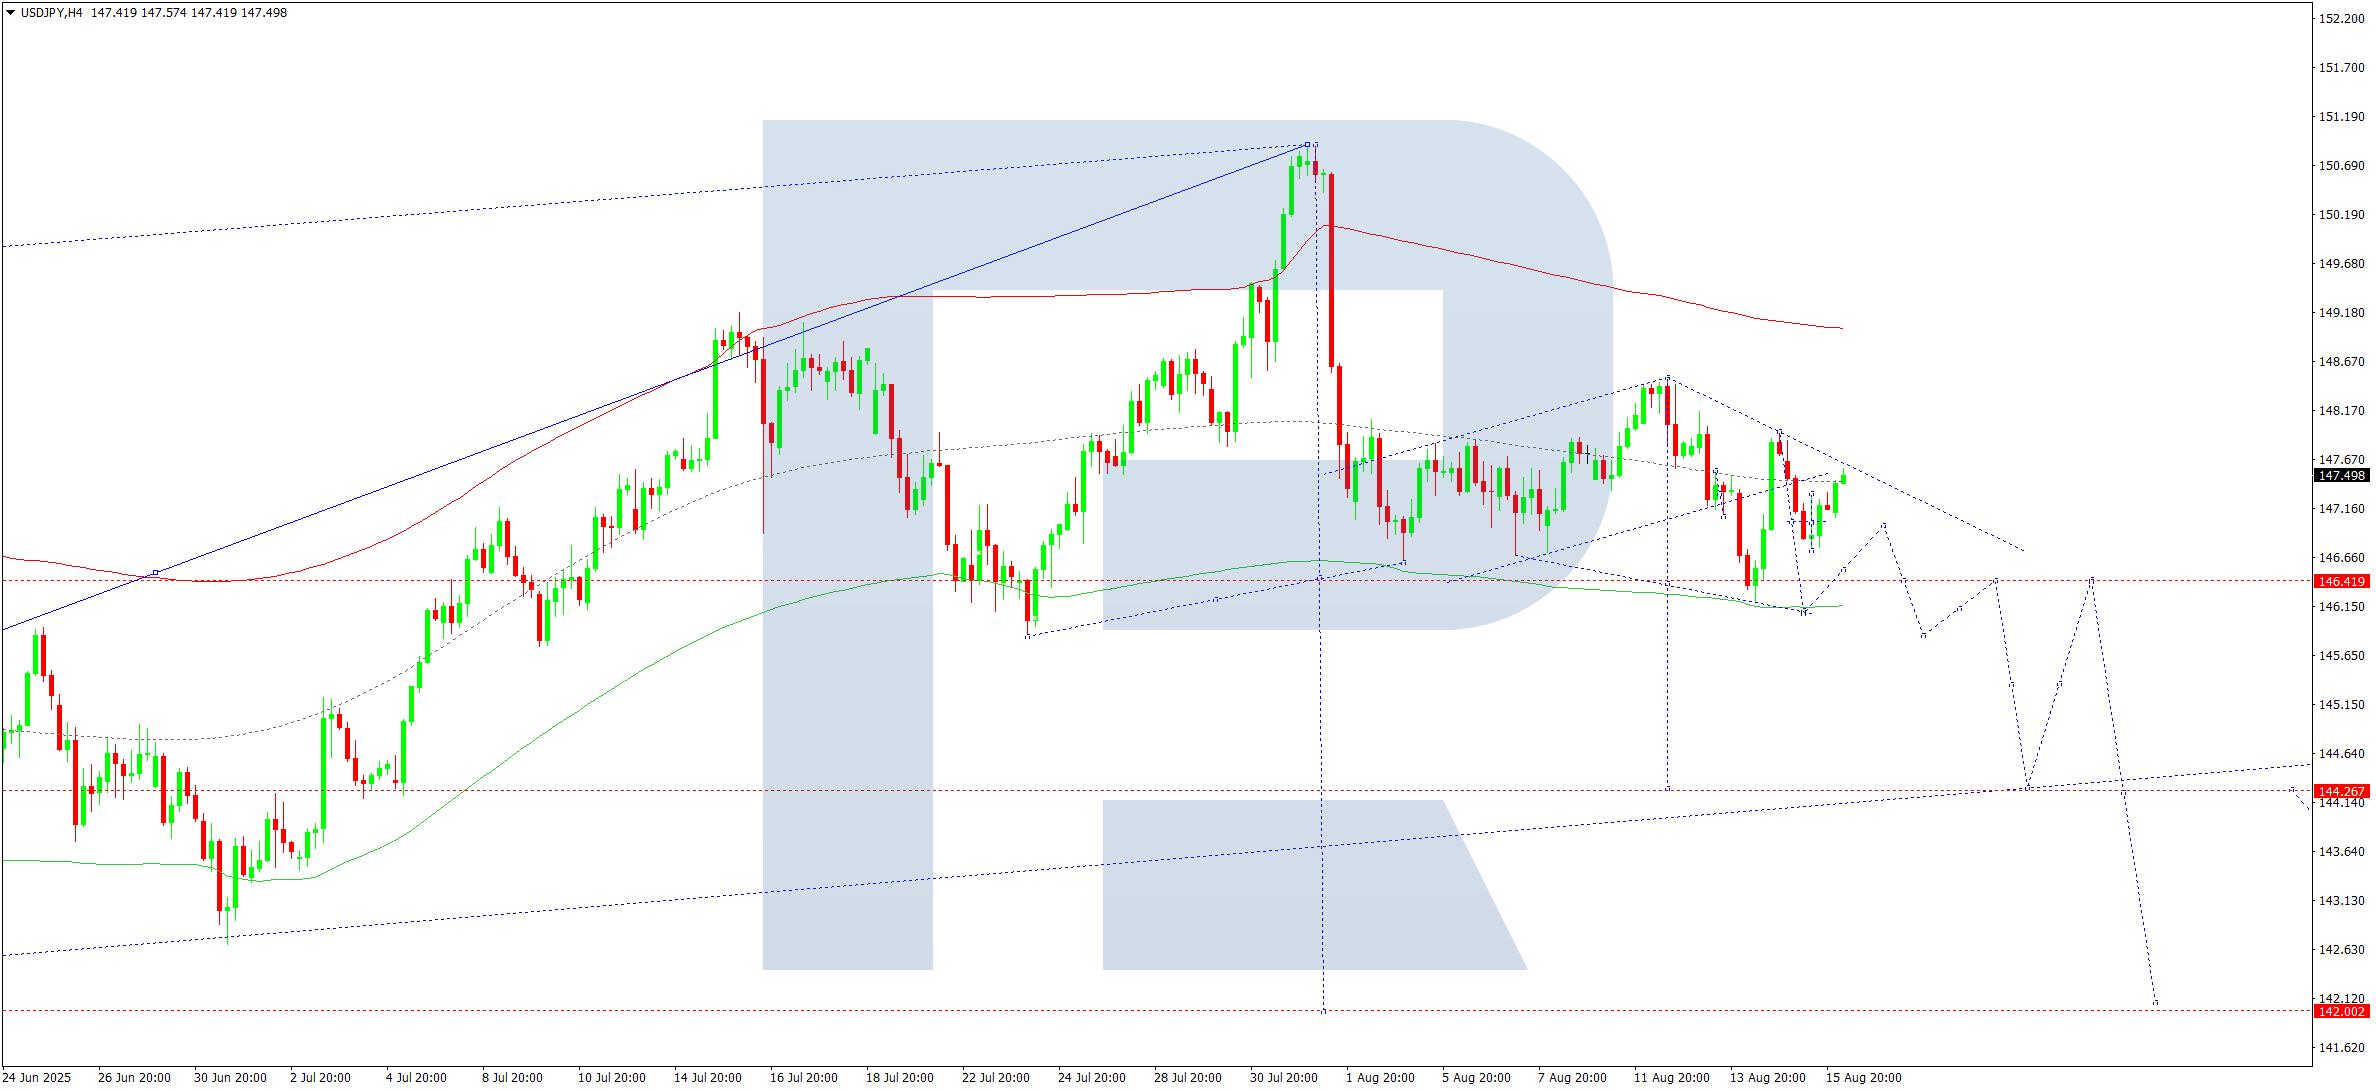
The USDJPY pair remains in a tight consolidation zone around 147.35 on the H4 chart. For 18 August 2025, a decline towards the lower boundary at 146.40 is anticipated. A breakout below this level could trigger a deeper correction toward 144.26.
This projection is supported by the Elliott Wave analysis and the wave matrix with 147.35 acting as a critical pivot. Price has stabilized around the center of the Price Envelope and now shows signs of a potential downward breakout, first targeting 146.00 and then 144.26.
Technical indicators point toward continued downside momentum to 146.00.
GBPUSD Forecast
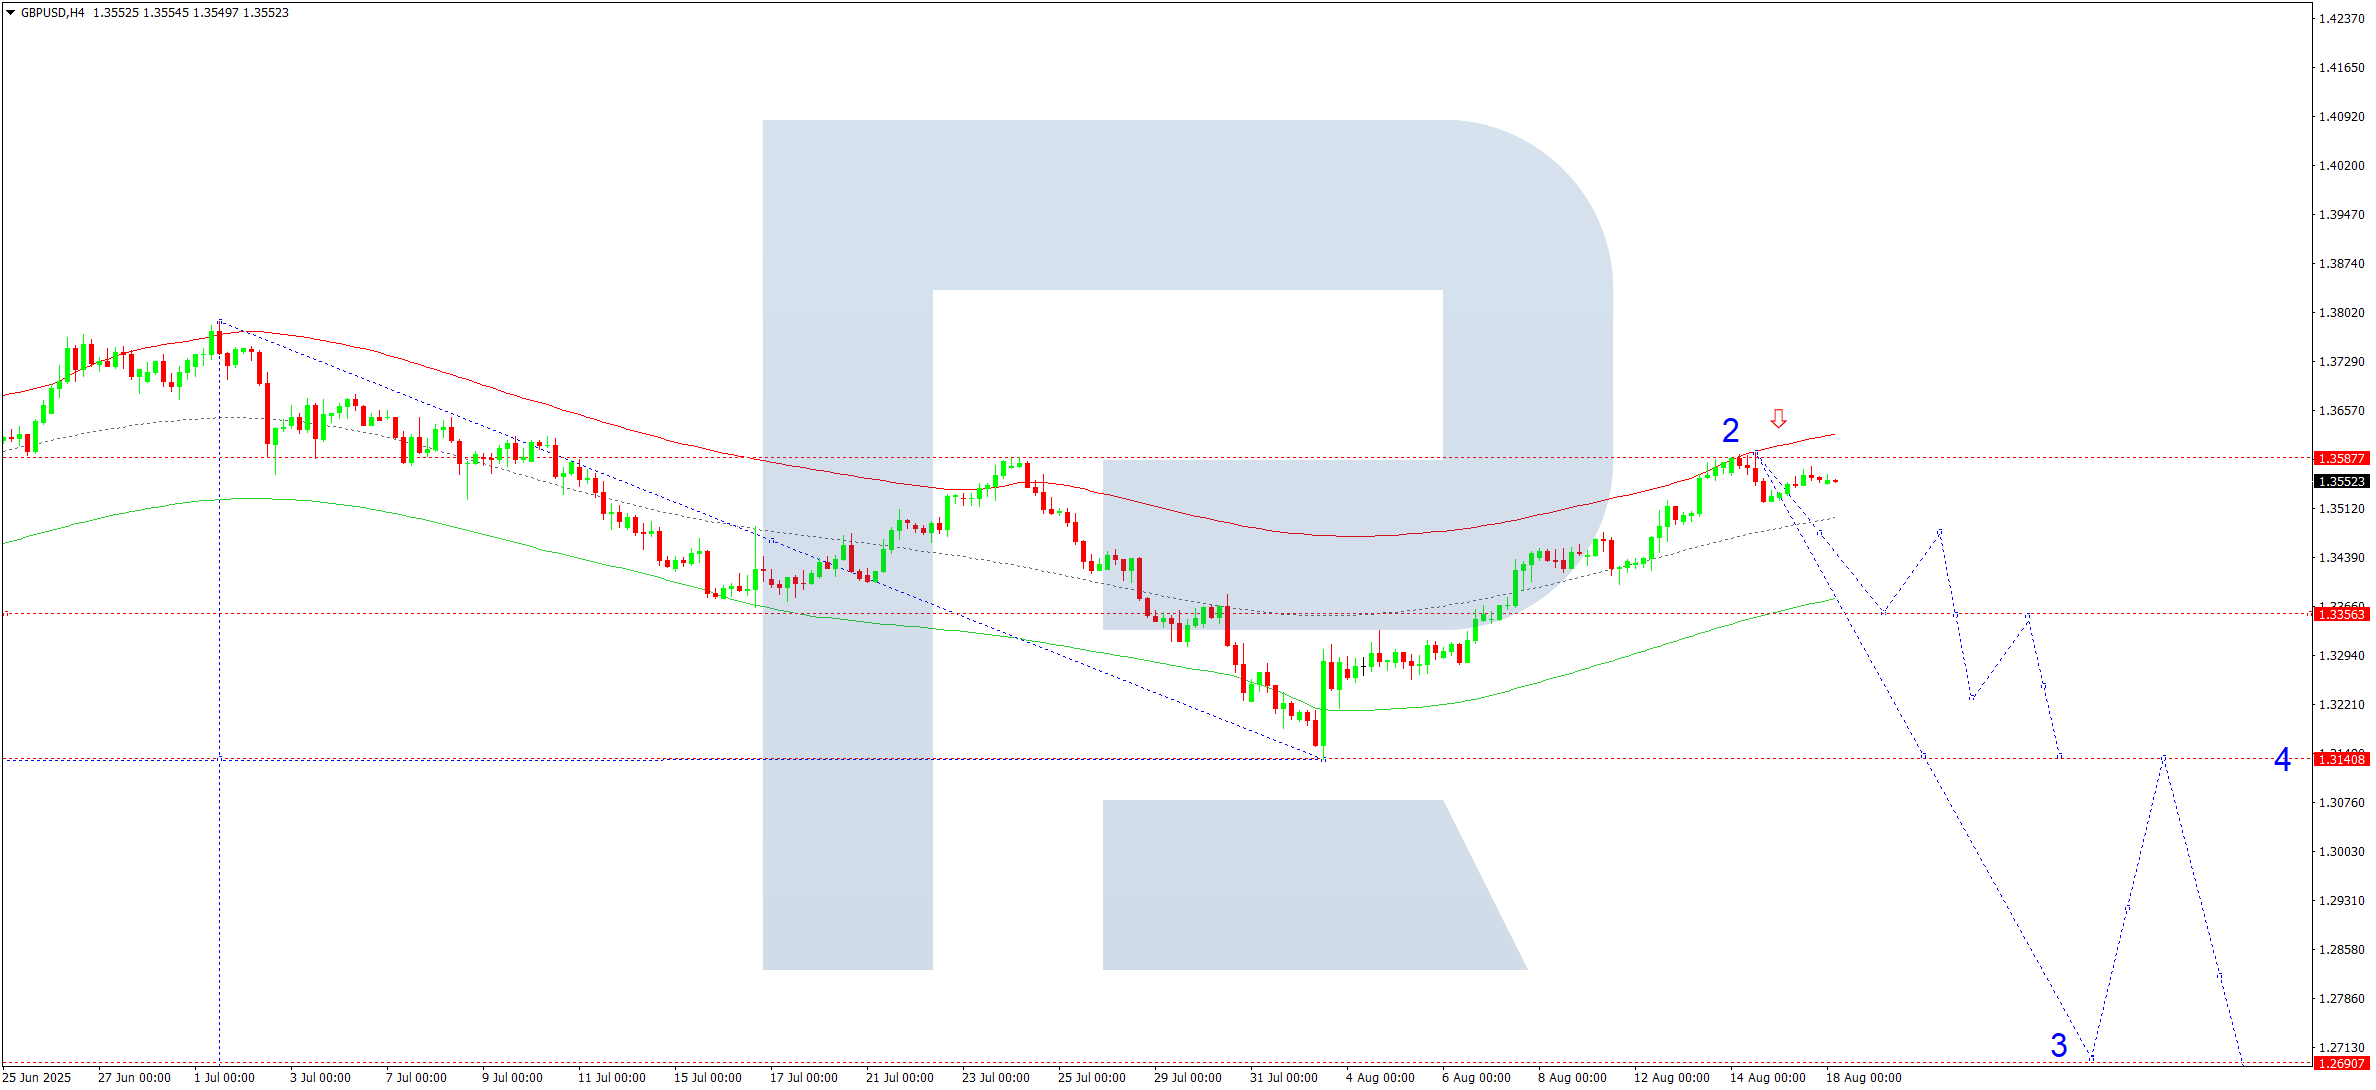
GBPUSD has completed a corrective move up to 1.3590. For 18 August 2025, a period of consolidation is likely below this level. A downward breakout would indicate the start of a bearish wave towards 1.3355, with a further target at 1.3140.
This scenario is validated by the Elliott Wave formation and the decline wave matrix, with 1.3355 serving as a pivotal level. Currently, price is testing the upper boundary of the Price Envelope. A move lower toward 1.3355 is the anticipated direction.
Technical indicators support a downside move to 1.3355.
AUDUSD Forecast
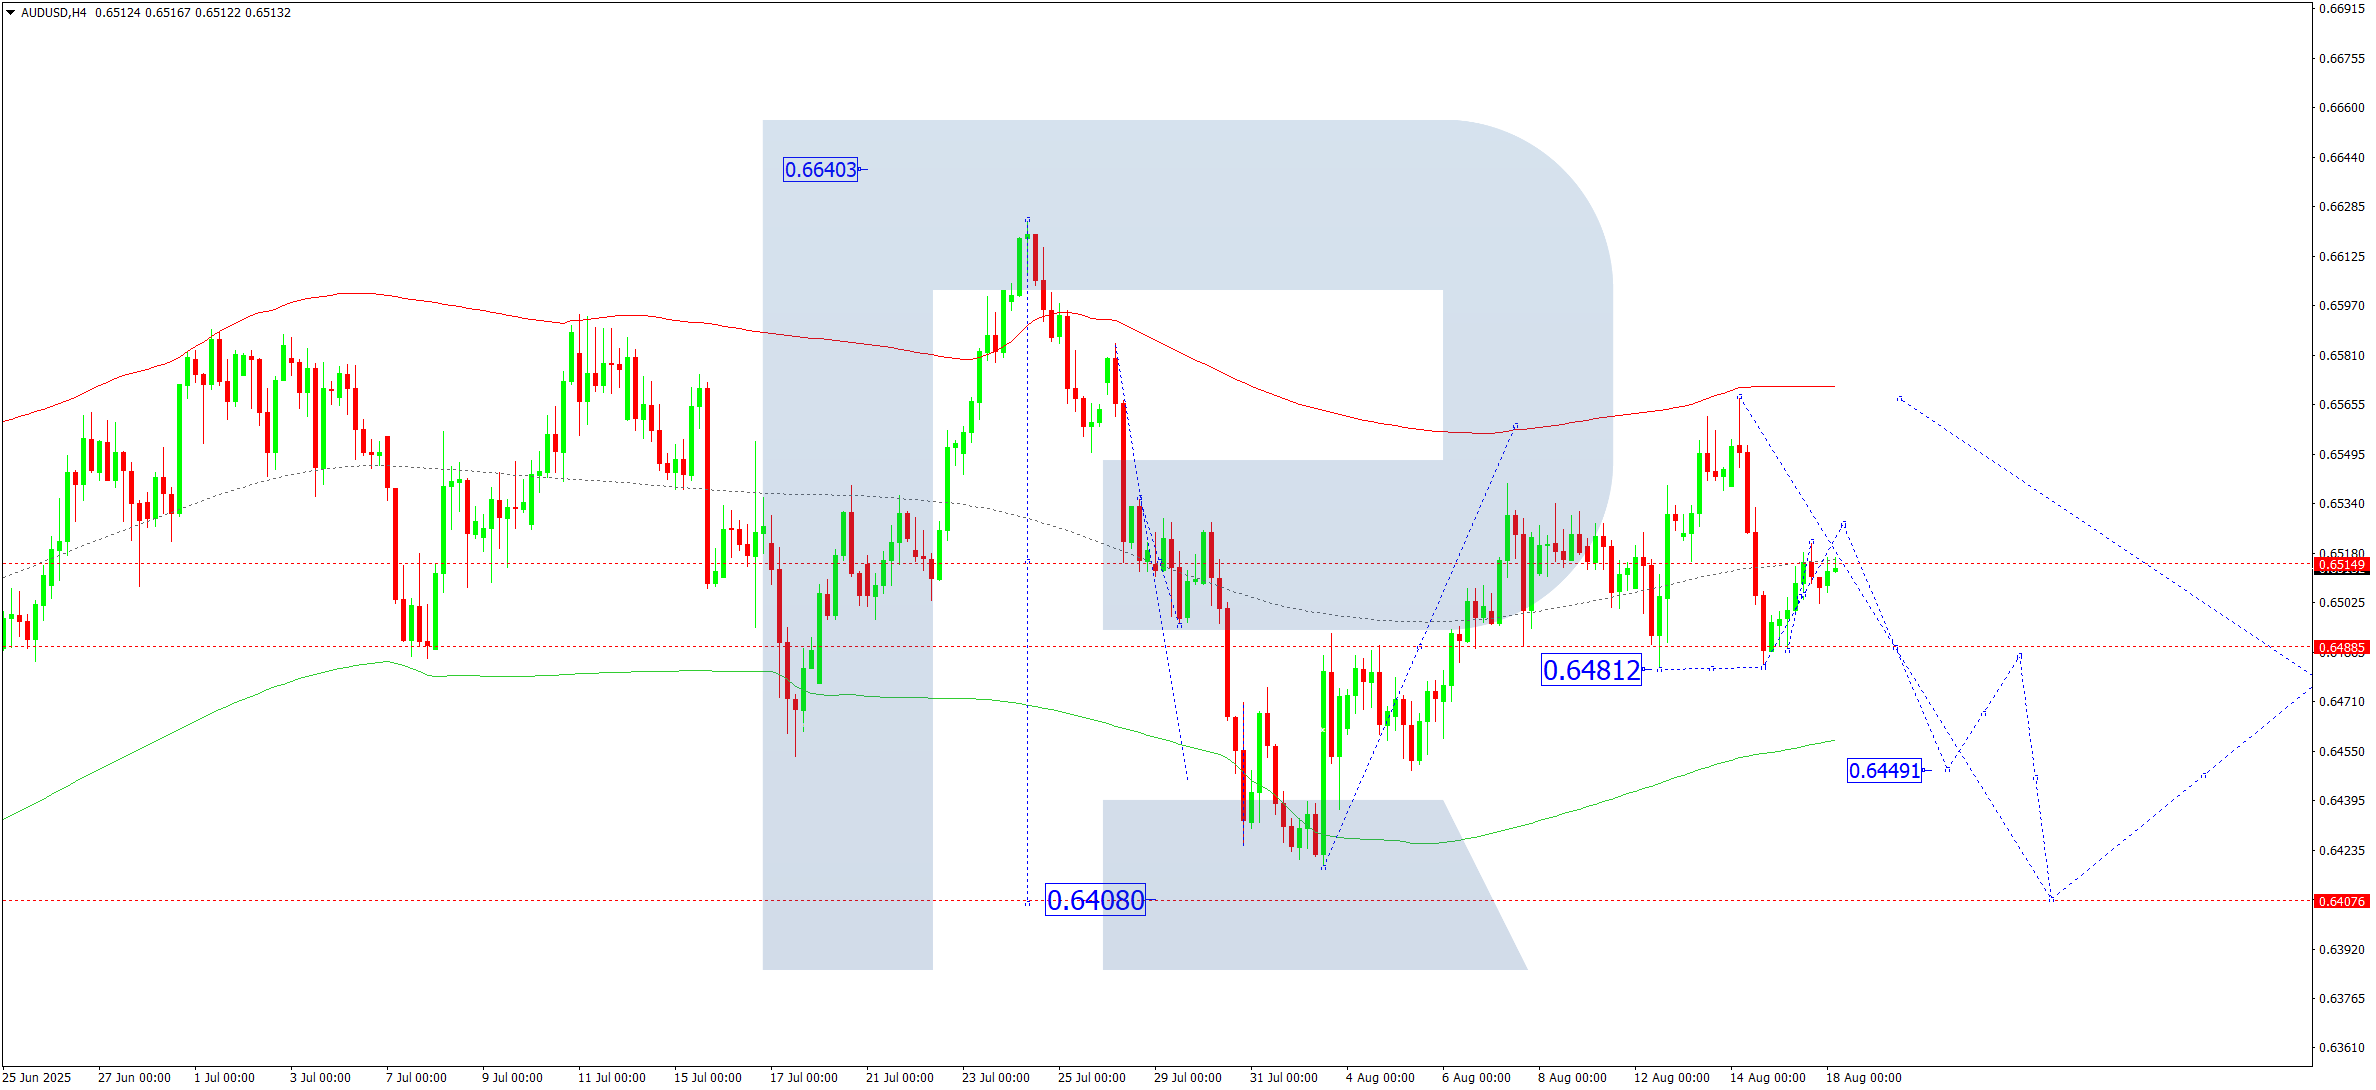
AUDUSD is undergoing a corrective rise towards 0.6525 on the H4 timeframe. On 18 August 2025, this level is expected to be reached. From there, a reversal and a move down to 0.6480 may begin, with a further target at 0.6408 if support breaks.
This outlook is consistent with the Elliott Wave structure and the decline wave matrix, where the key pivot lies at 0.6515. The current movement points to a test of the midline of the Price Envelope at 0.6525 before a bearish continuation to the lower boundary at 0.6408.
Technical indicators suggest a bearish outlook toward 0.6408.
USDCAD Forecast
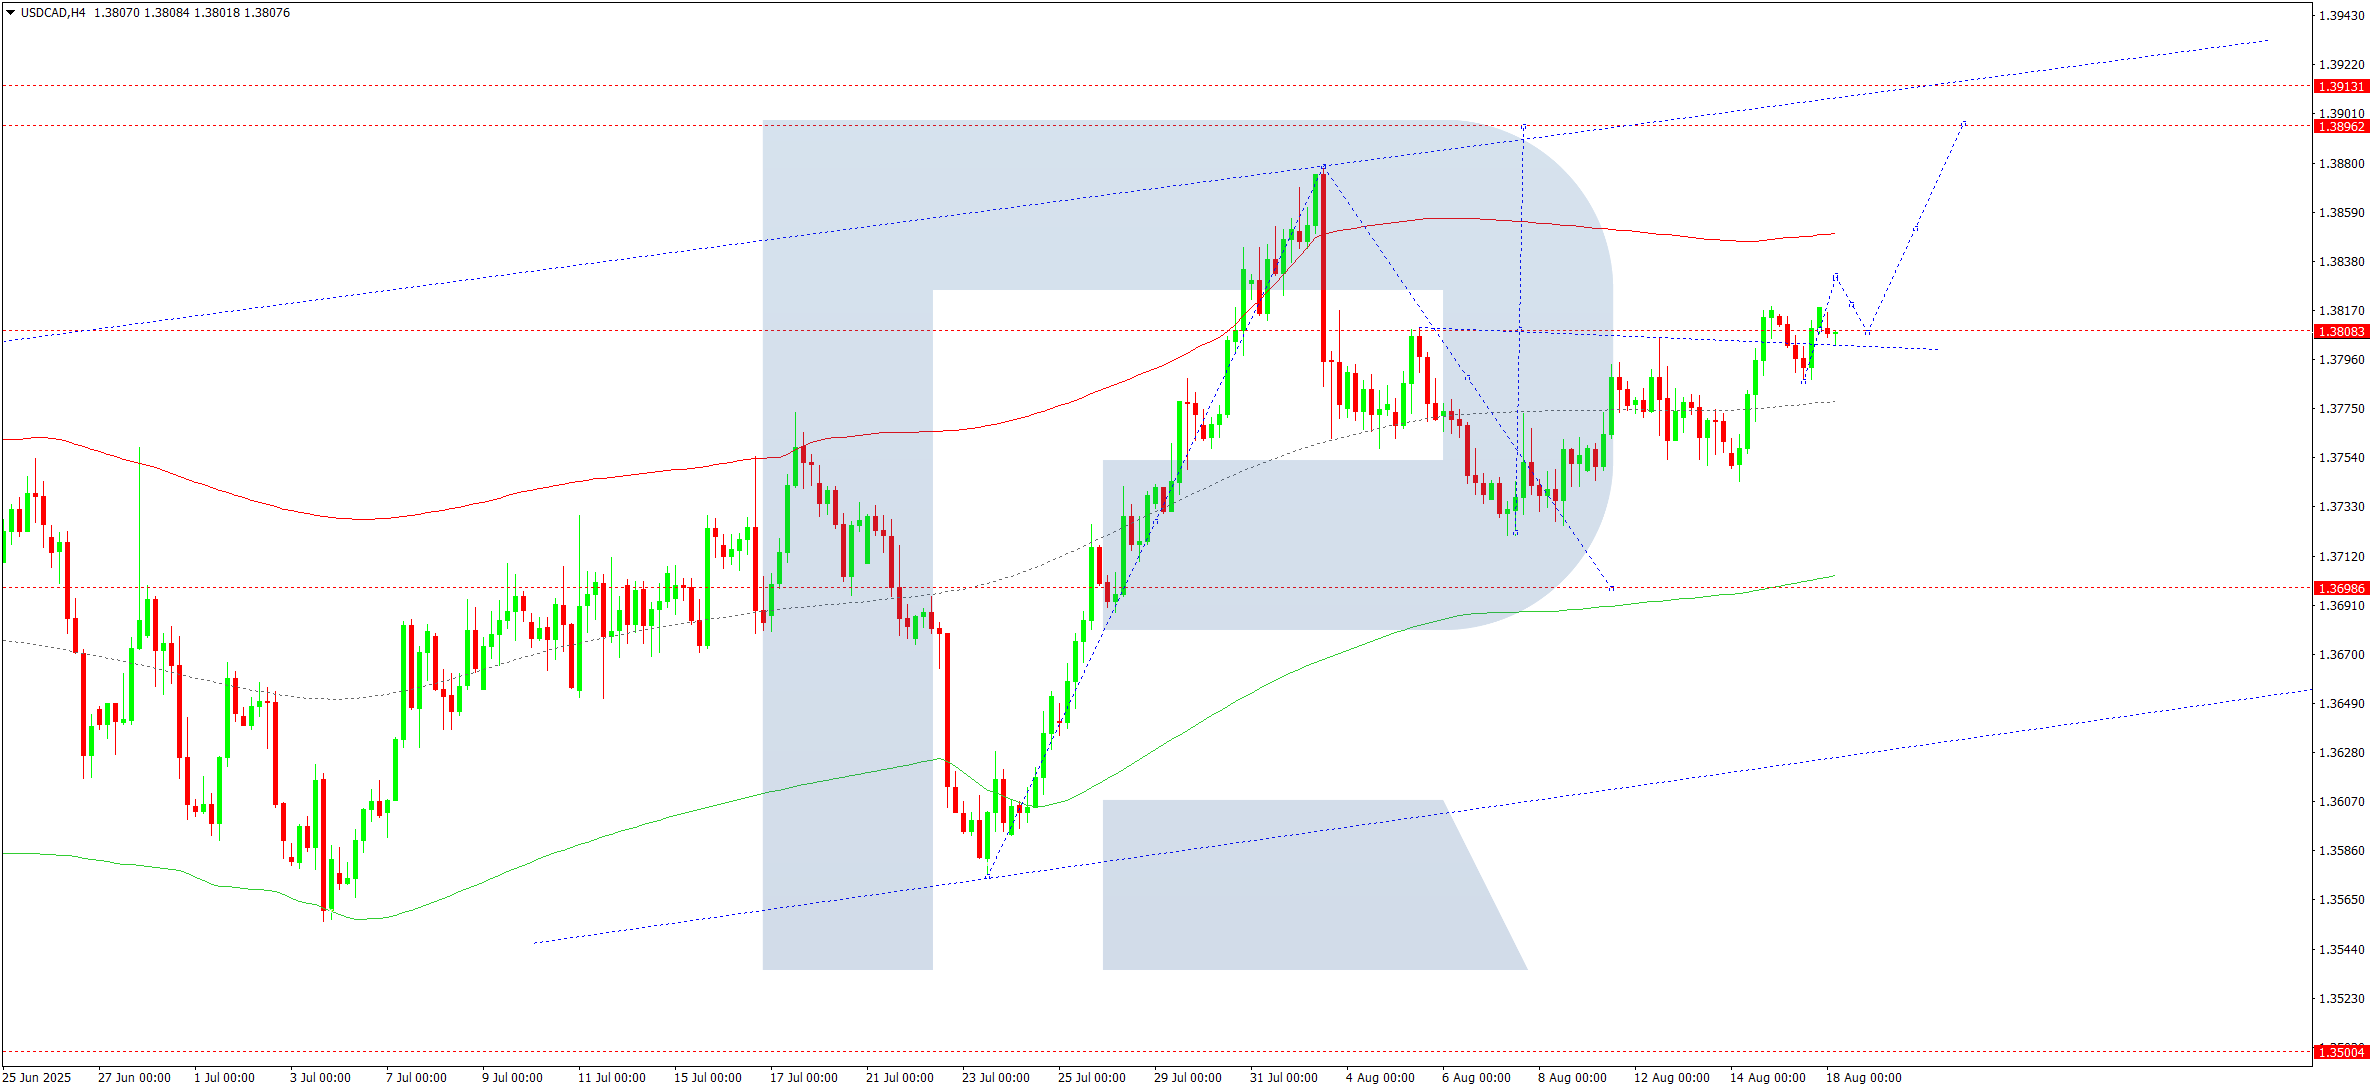
USDCAD completed a correction to 1.3750 and has since surged to 1.3800. A consolidation range is forming around this level on 18 August 2025. If the pair breaks upward, a continued move toward 1.3890 is likely. Conversely, a break below the range could see a decline to 1.3700, followed by renewed upward momentum toward 1.3890.
This scenario is reinforced by Elliott Wave analysis and the bullish wave matrix, with the pivot at 1.3715 playing a key role. Currently, the price is positioned near the central line of the Price Envelope at 1.3787 and appears to be breaking higher.
Technical indicators favor a continued upward move to 1.3890.
XAUUSD (Gold) Forecast
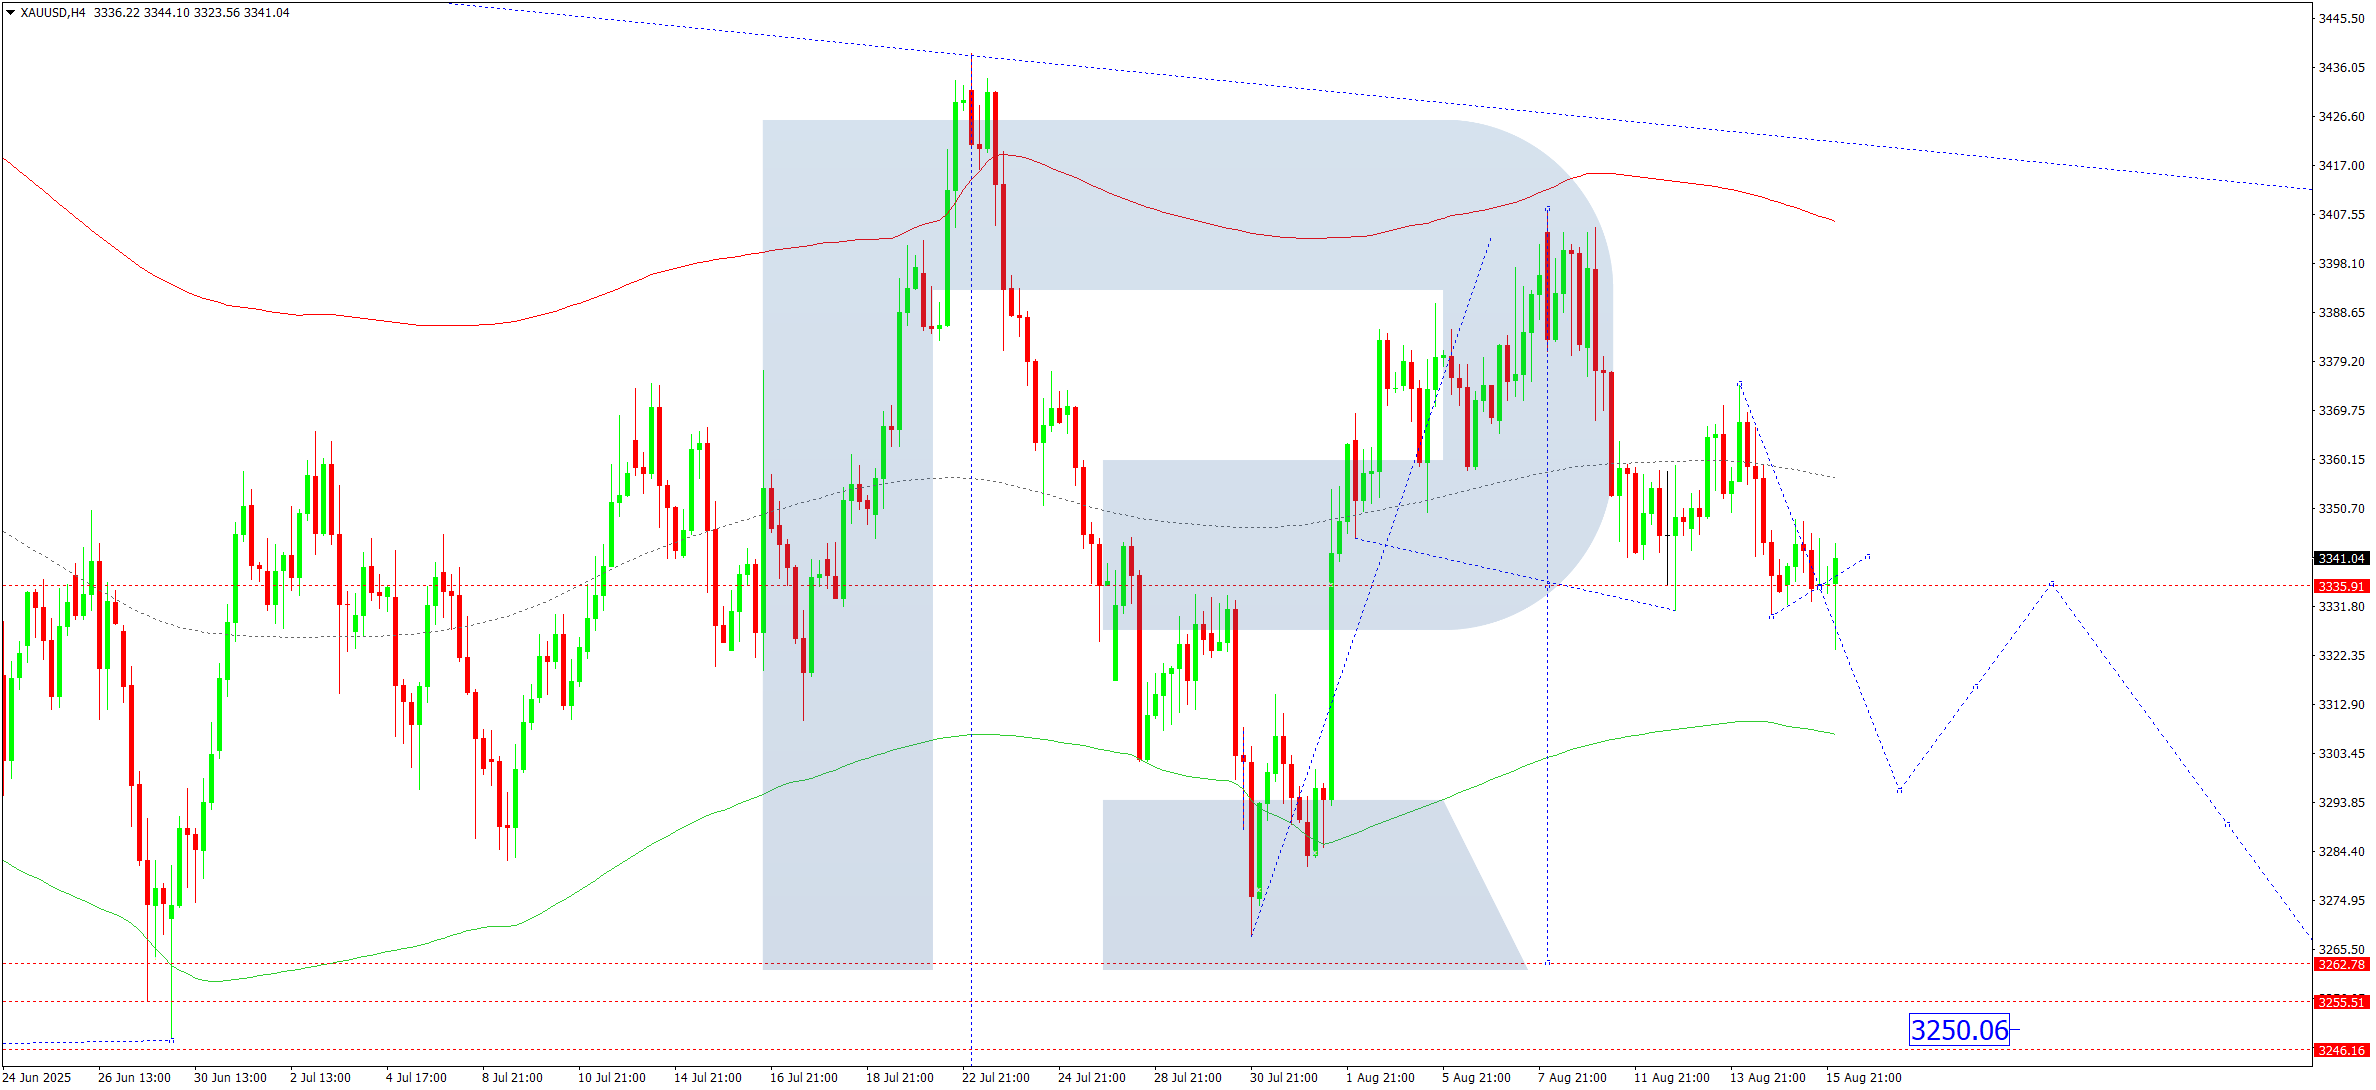
Gold is currently forming a consolidation range near 3,335 on the H4 chart. On 18 August 2025, a downward breakout is anticipated, potentially driving the price to 3,295, with further downside potential to 3,255.
This projection aligns with the Elliott Wave structure and bearish wave matrix, identifying 3,335 as a key pivot level. The current movement targets the lower boundary of the Price Envelope at 3,295, with possible recovery to the midline at 3,335 afterwards.
Technical indicators signal continued correction toward 3,295.
Brent Crude Oil Forecast
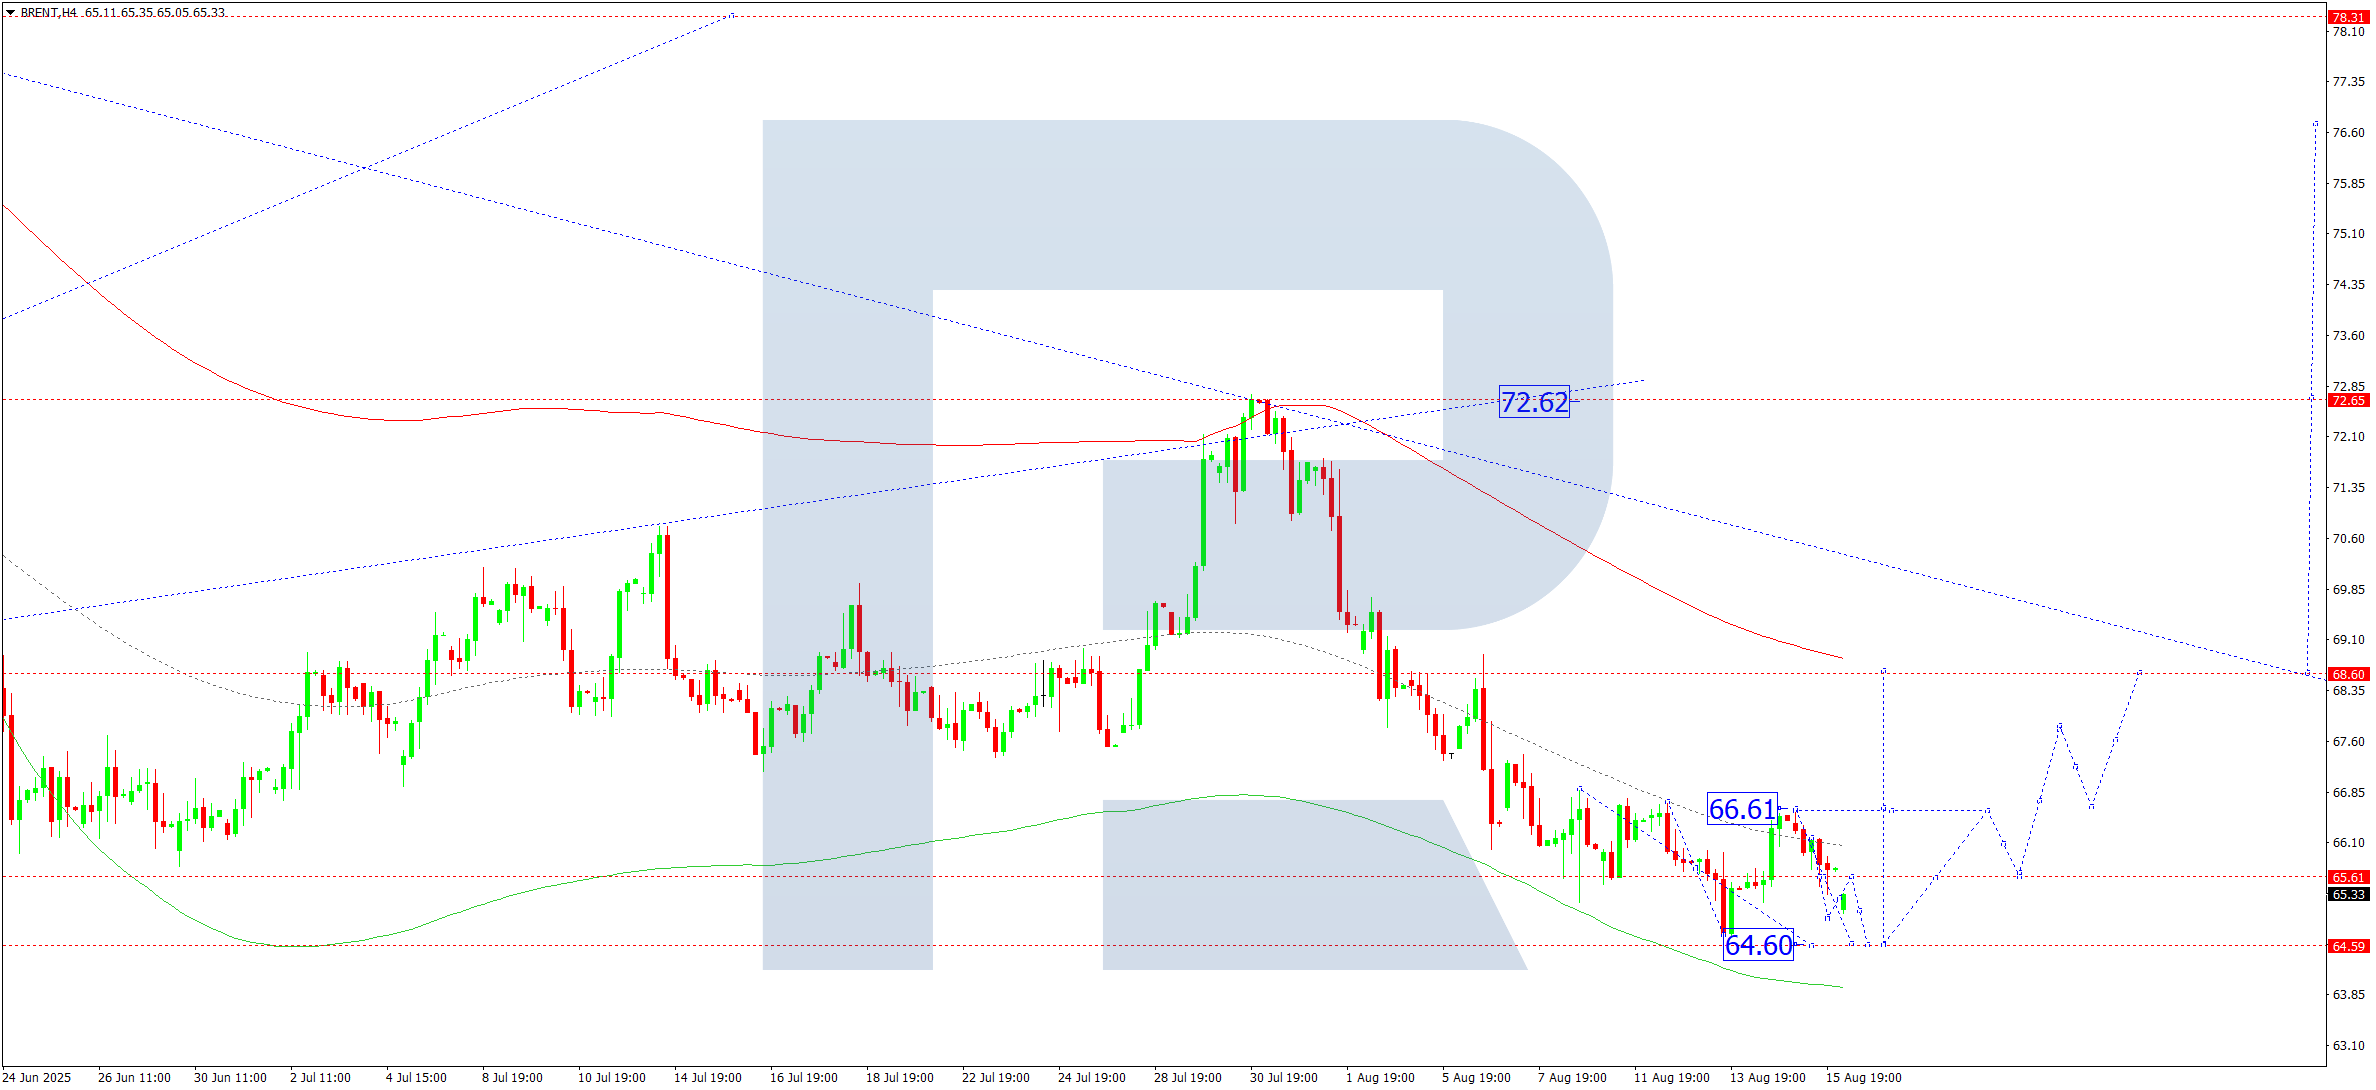
Brent is consolidating around 65.60 on the H4 chart. On 18 August 2025, the range may extend downward to 64.60 before a rebound toward 66.60 is expected. A breakout above 66.60 could initiate a bullish wave toward 68.60, with an extended target at 72.60.
This outlook is supported by the Elliott Wave structure and wave matrix, where 68.60 serves as the pivotal level. Currently, Brent is approaching the lower boundary of the Price Envelope at 64.60, with a potential upward move to the upper boundary at 68.60 and beyond.
Technical indicators indicate a bullish trend toward 68.88.
Risk Disclaimer:
Past performance is not indicative of future results. Trading financial instruments carries a high level of risk and may not be suitable for all investors. Please ensure you fully understand the risks involved.
Leave a Reply