
Daily Technical Analysis and Forecast – 25 August 2025
EURUSD Forecast – 25 August 2025
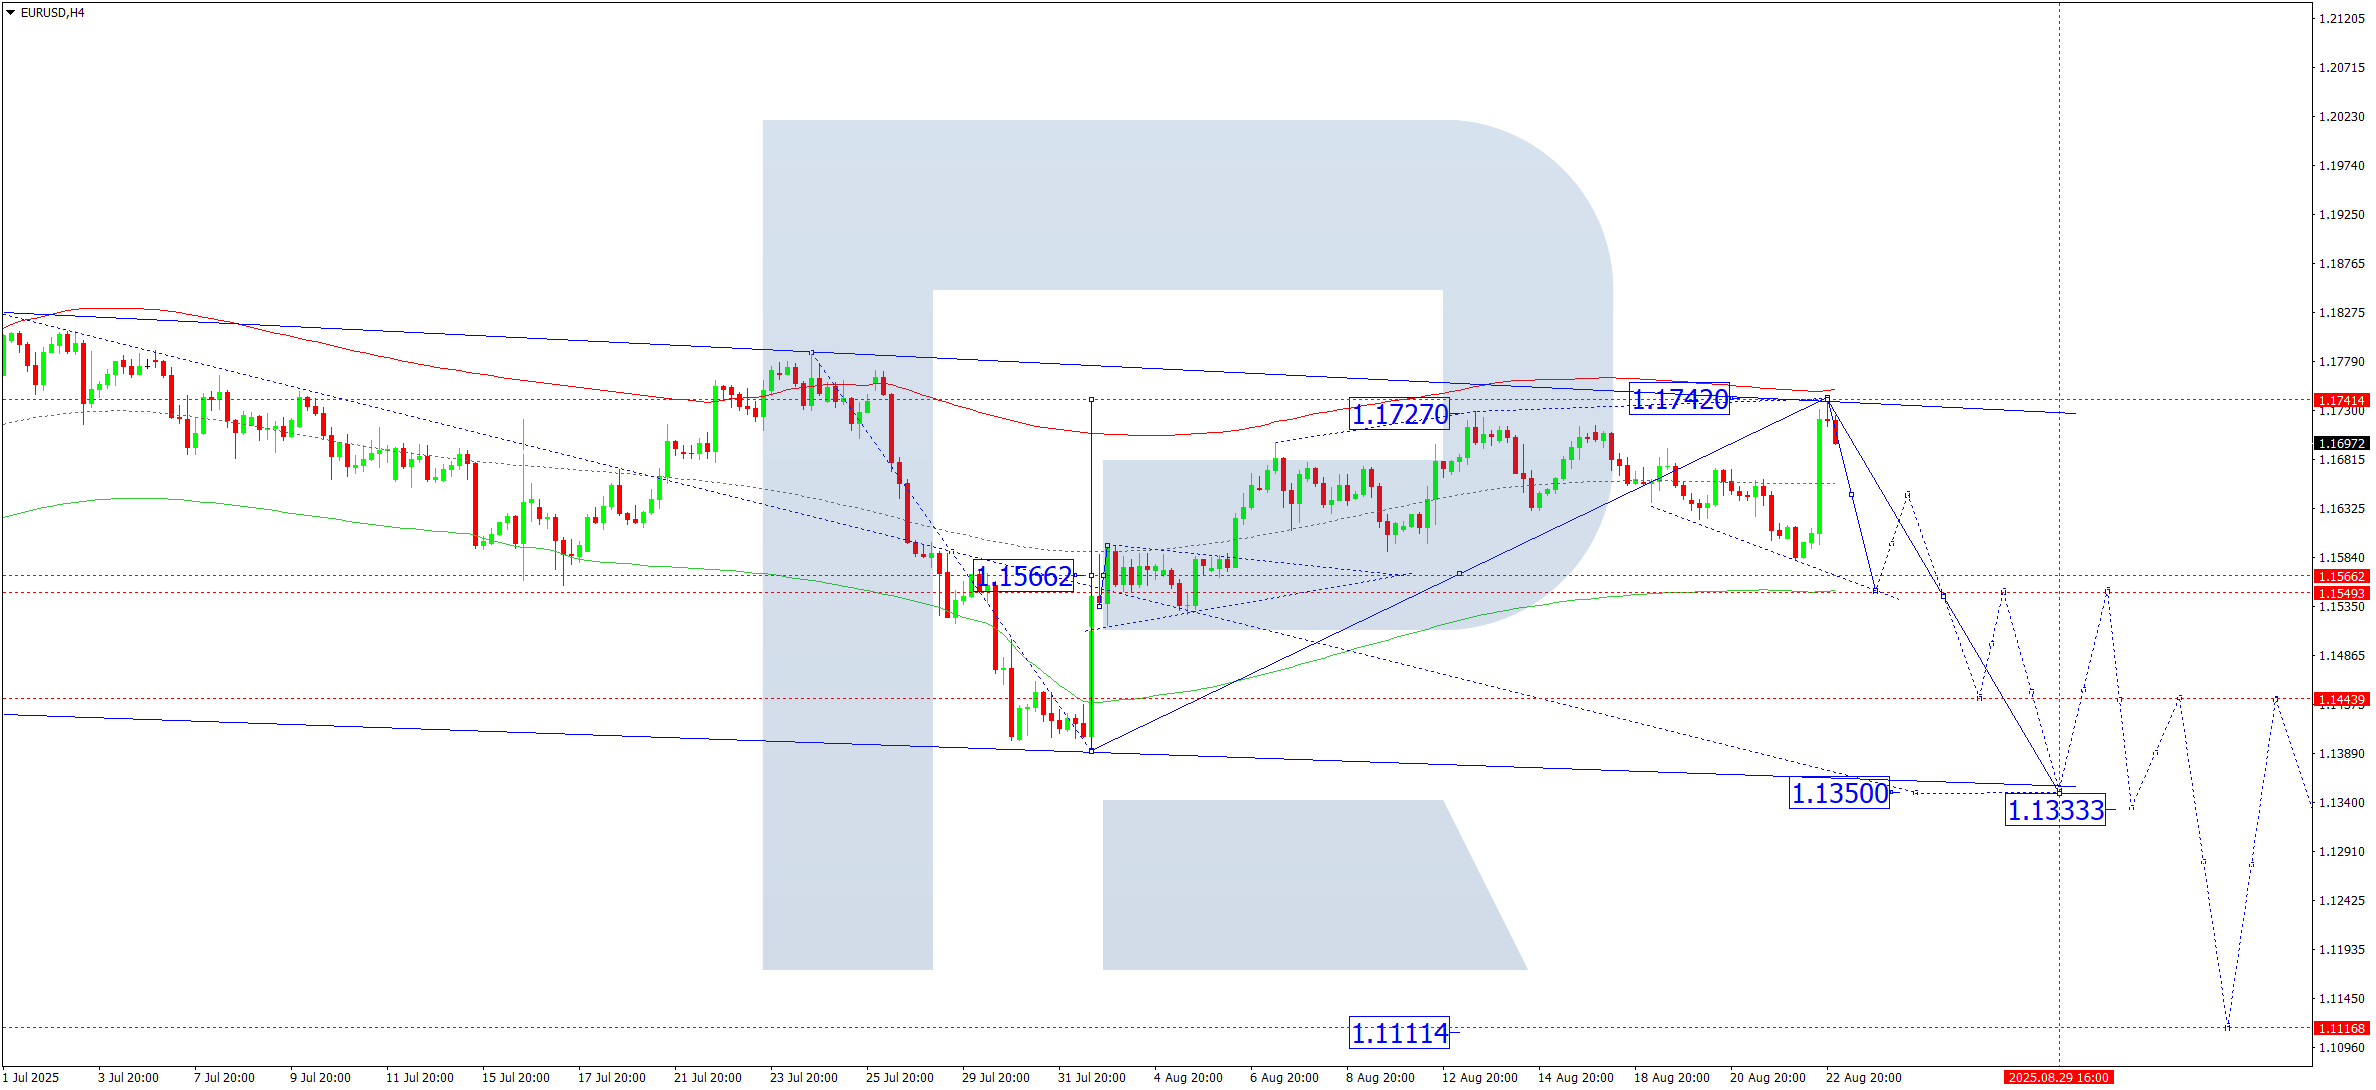
On the H4 chart, EURUSD found support near 1.1583 and recently completed a corrective move up to 1.1742. For today, a new downward wave is anticipated, targeting 1.1550. After reaching this support, a rebound toward 1.1646 could follow, keeping the pair within a broad consolidation range centered around this level.
From a technical perspective, the Elliott Wave structure and downward wave matrix with a pivot near 1.1566 support this outlook. The price is currently near the upper edge of the Price Envelope and is expected to head toward the lower boundary around 1.1550.
Summary: Indicators suggest further downside movement toward 1.1550 remains likely.
USDJPY Forecast – 25 August 2025
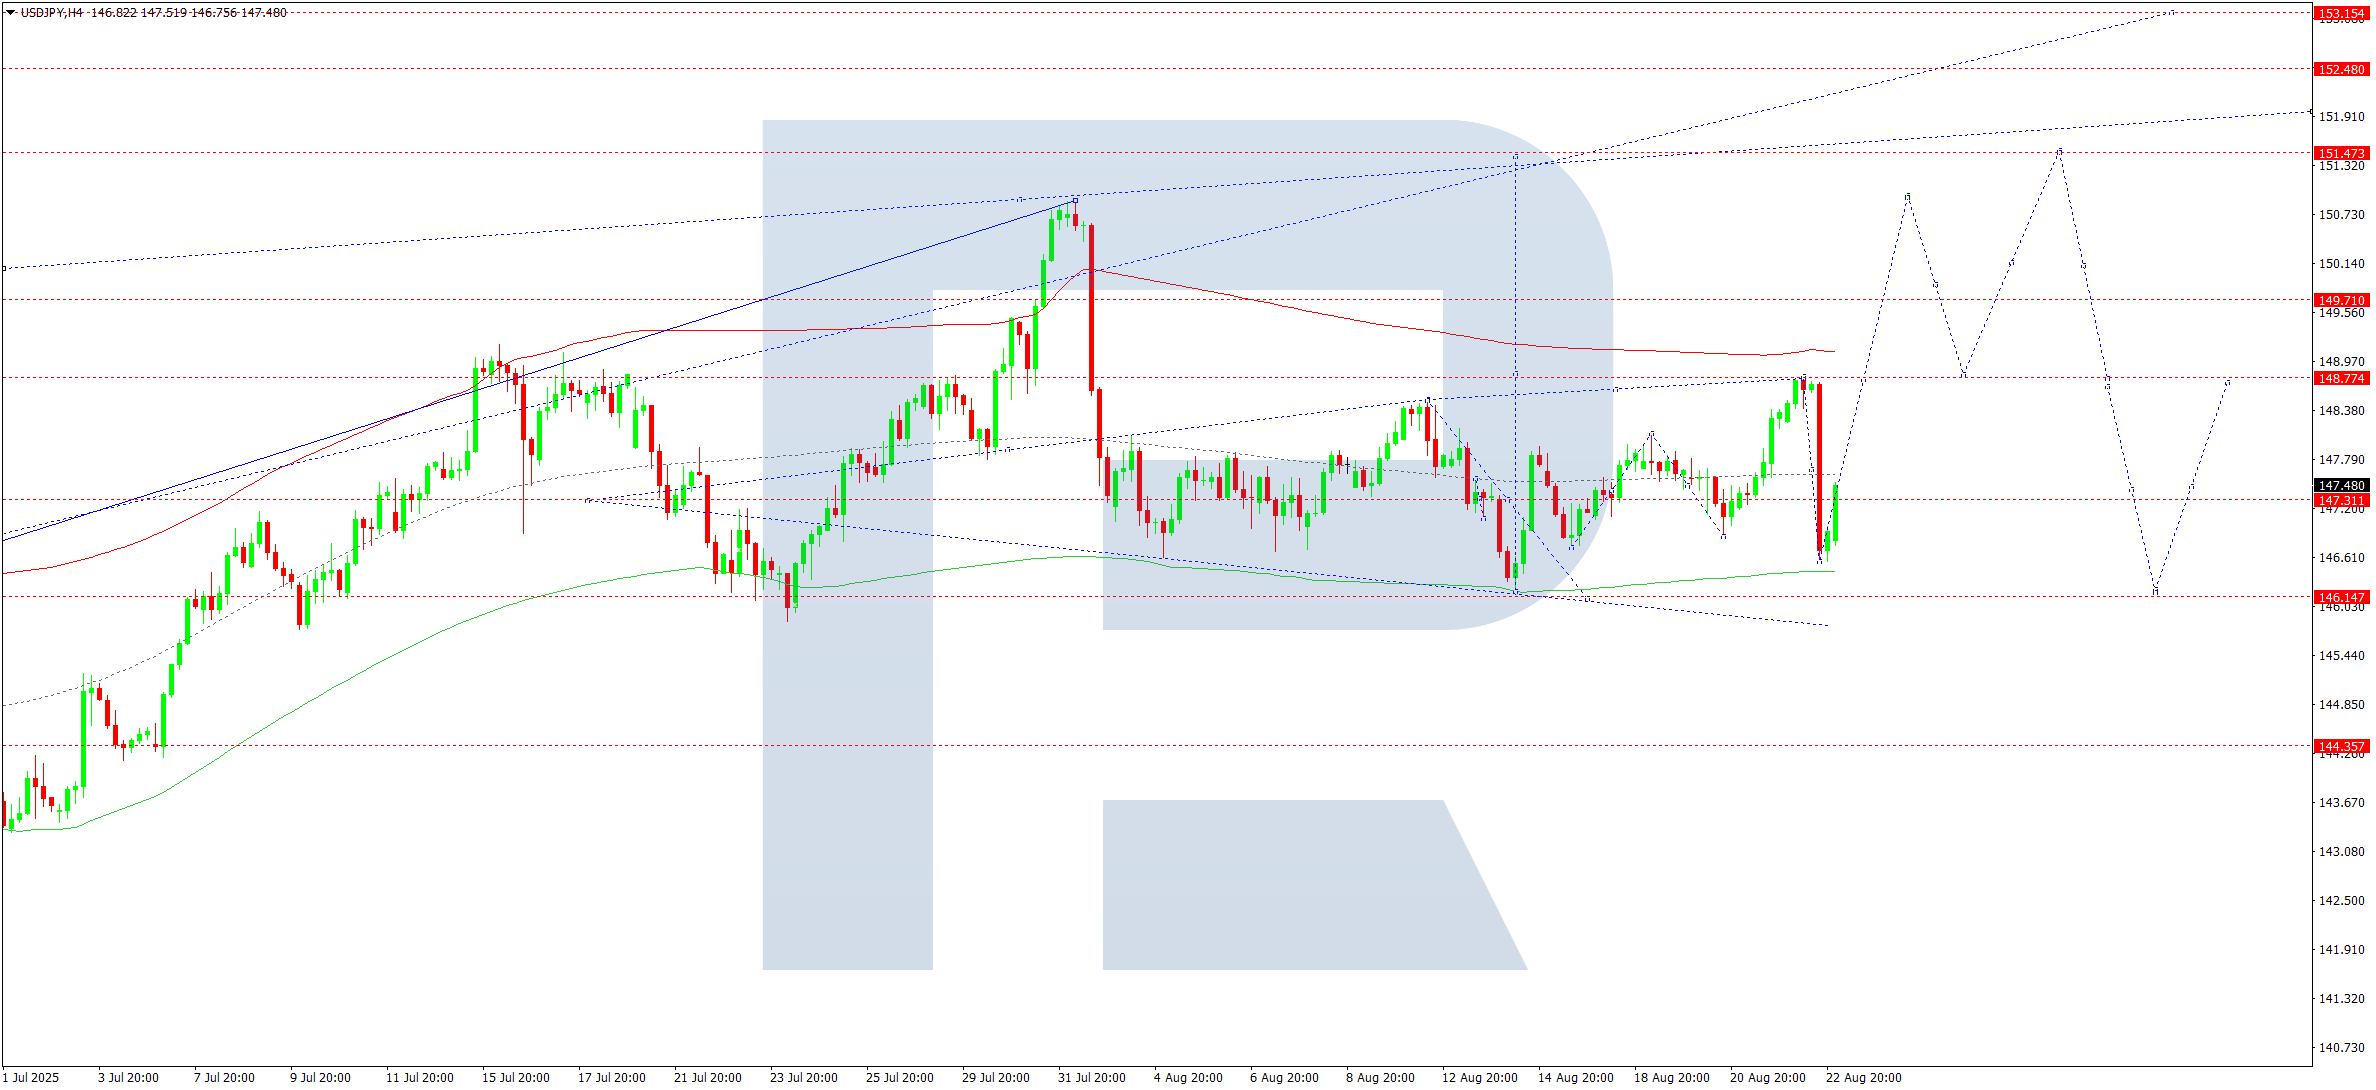
On the H4 chart, USDJPY is consolidating around 147.32, with the range extending between 148.77 (resistance) and 146.55 (support). A dip to 146.15 is possible in the short term. A breakout above the range could lead to a rally toward 150.75, while a breakdown may push the pair down to 144.44.
The Elliott Wave pattern and an upward-biased matrix with a pivot at 146.55 support a bullish scenario. The pair is trending toward the upper boundary of the Price Envelope at 151.47, although some short-term downside may occur first.
Summary: Technicals indicate a likely upward move toward 150.75, despite near-term volatility.
GBPUSD Forecast – 25 August 2025
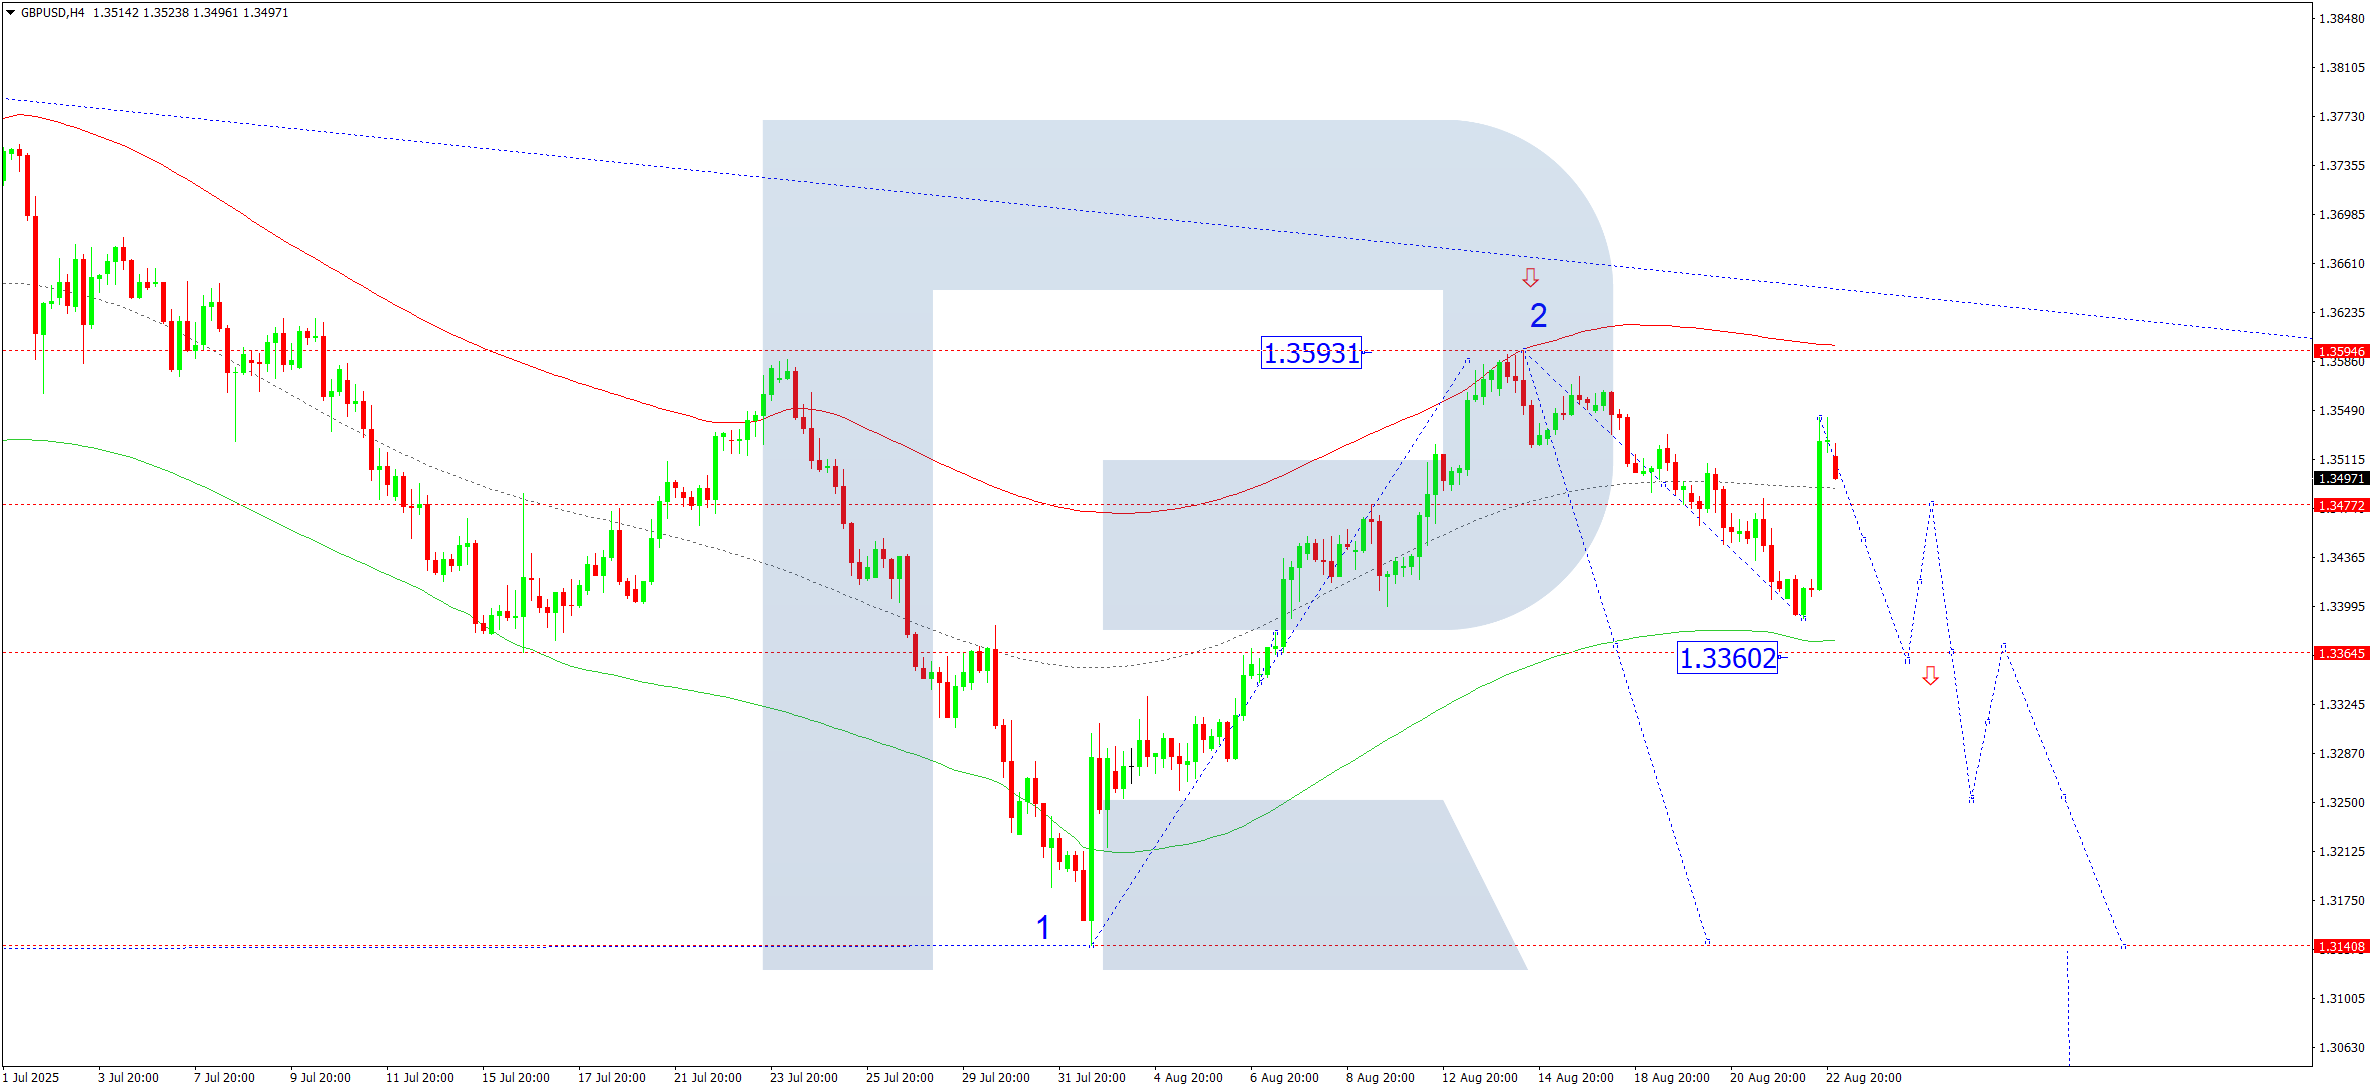
The H4 chart shows GBPUSD recently corrected to 1.3540. Today, a decline is expected to develop toward 1.3360. A minor pullback to 1.3500 could follow before further downward continuation. The pair is forming a broad consolidation zone, and a deeper drop to 1.3140 remains a longer-term target.
Wave analysis points to a bearish outlook, with the pivot located near 1.3475. The downward structure suggests movement toward the lower boundary of the Price Envelope around 1.3360 before any corrective bounce.
Summary: Indicators point toward a continuation of the bearish trend targeting 1.3360.
AUDUSD Forecast – 25 August 2025
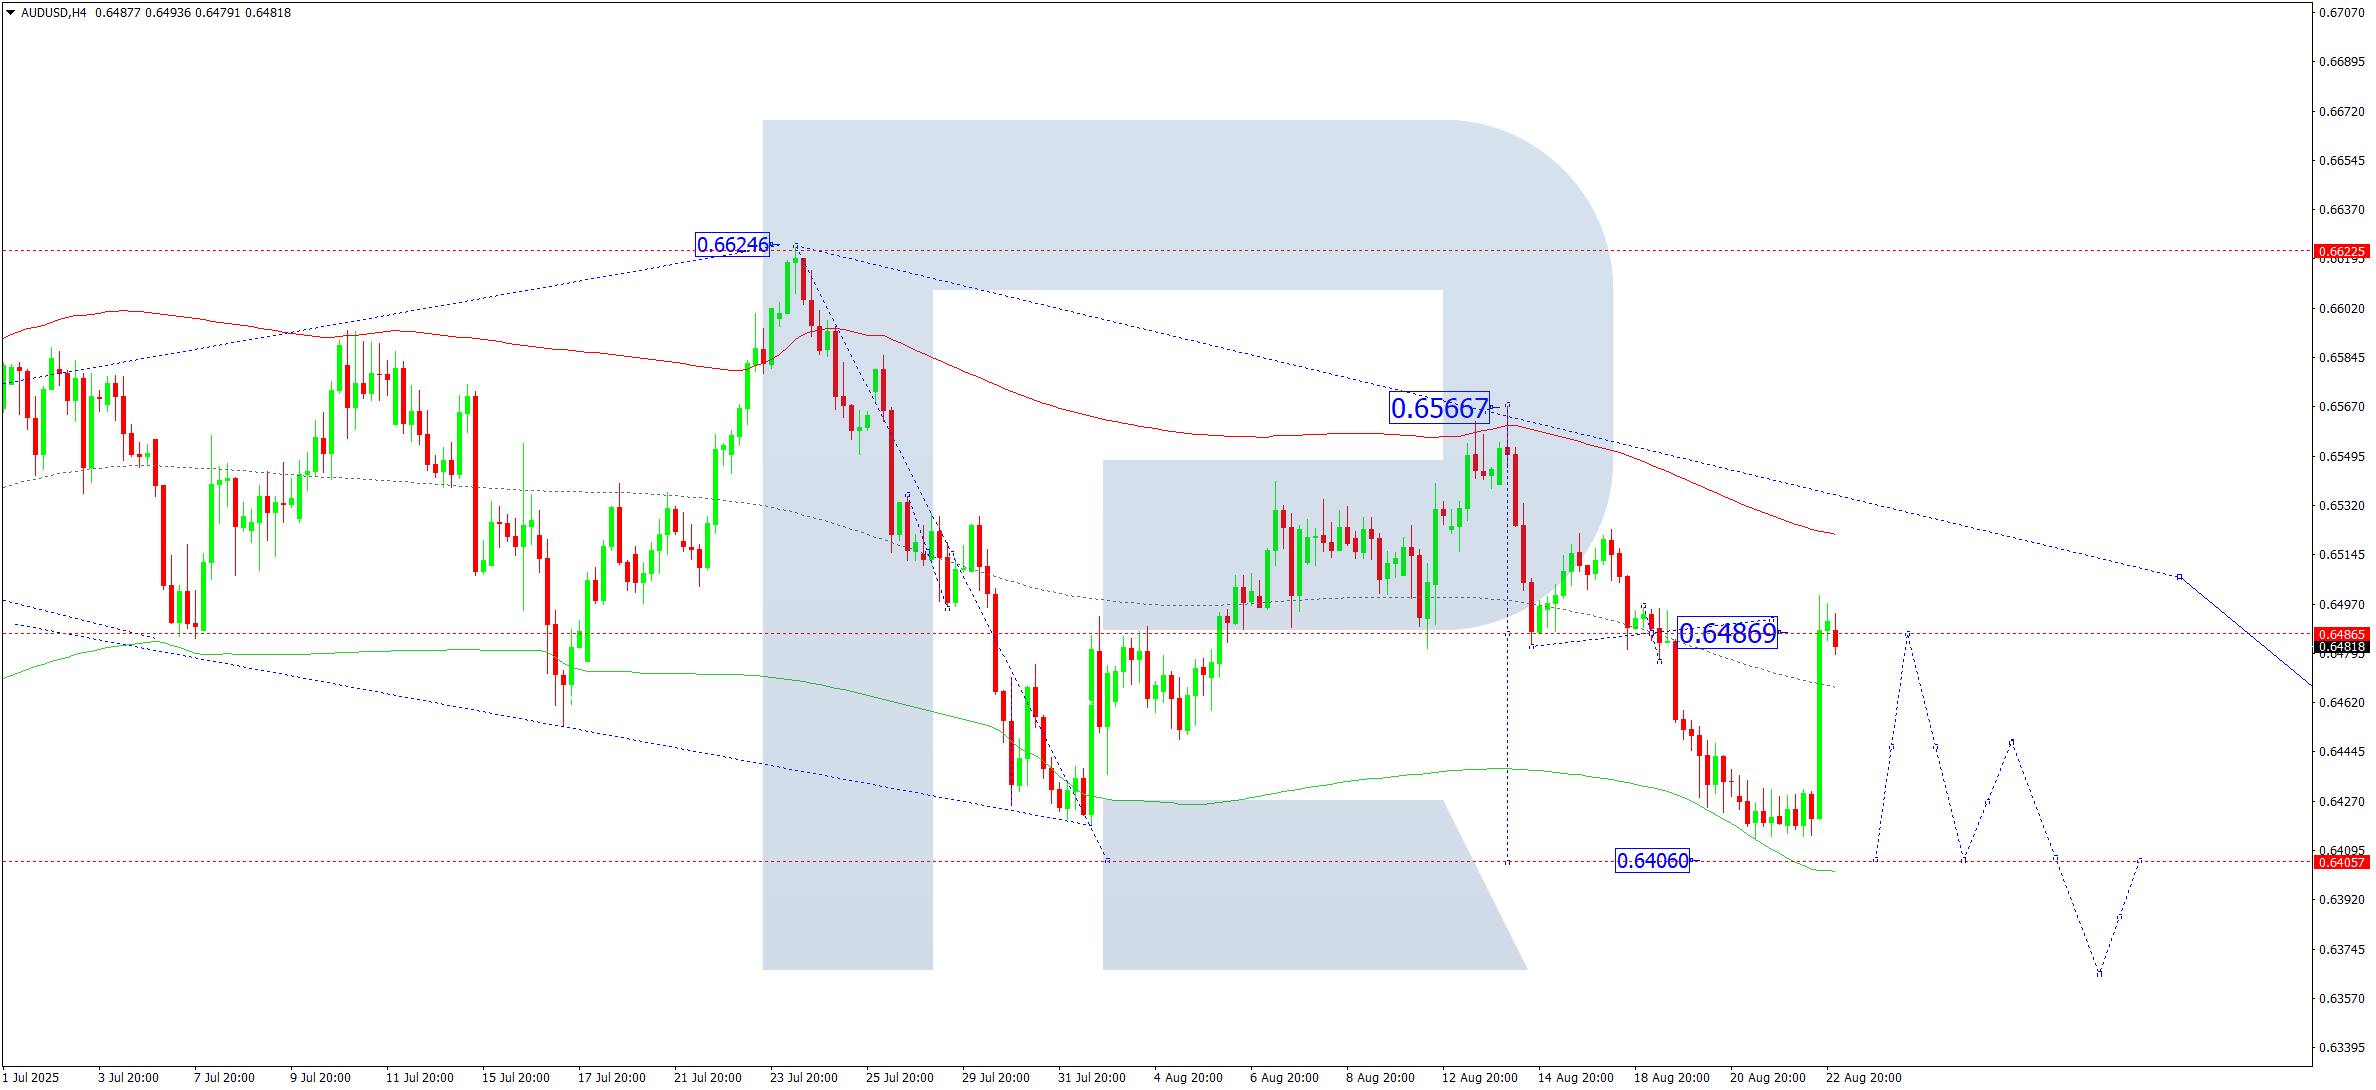
On the H4 timeframe, AUDUSD corrected upward to 0.6499, but the downward trend is expected to persist, with 0.6400 as the next target. A rebound toward 0.6490 may occur after hitting this support level.
The Elliott Wave structure, combined with a bearish wave matrix centered at 0.6515, supports continued weakness. The current move represents the fifth wave in the sequence, targeting the lower Price Envelope limit.
Summary: Technicals favor a move lower to 0.6400.
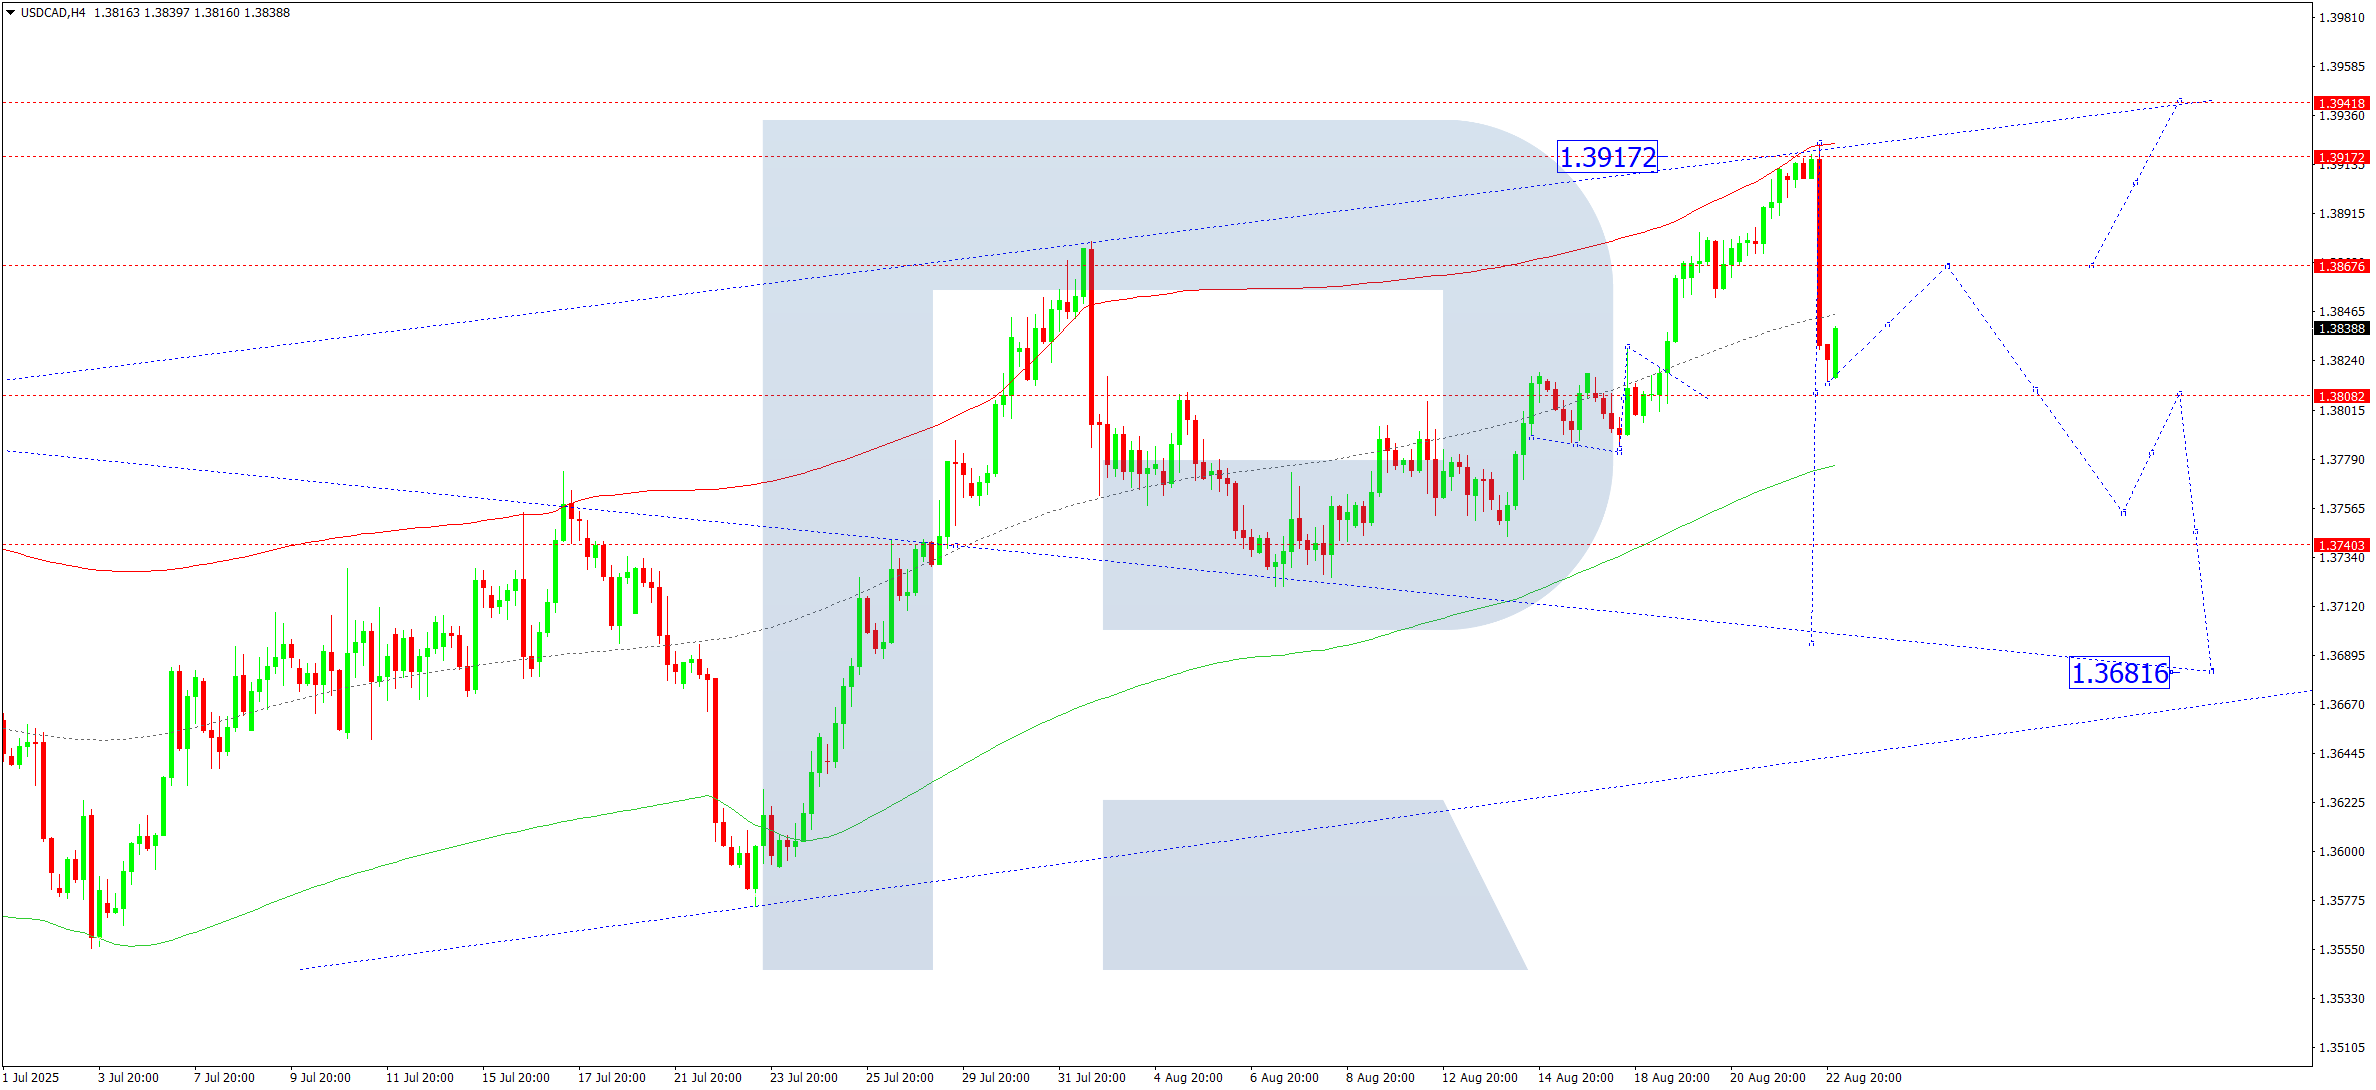
USDCAD Forecast – 25 August 2025
USDCAD recently corrected to 1.3814. Today, the price may climb to 1.3868, defining the current consolidation zone. A break above could trigger a move to 1.3942, while a downside breakout may lead to a deeper correction toward 1.3777.
Wave analysis with a pivot at 1.3727 supports a bullish scenario. The pair has already tested the upper Price Envelope at 1.3917. A pullback to 1.3800 remains possible, with deeper downside potential toward 1.3688.
Summary: Short-term outlook remains bullish with a target of 1.3868, unless support is broken.
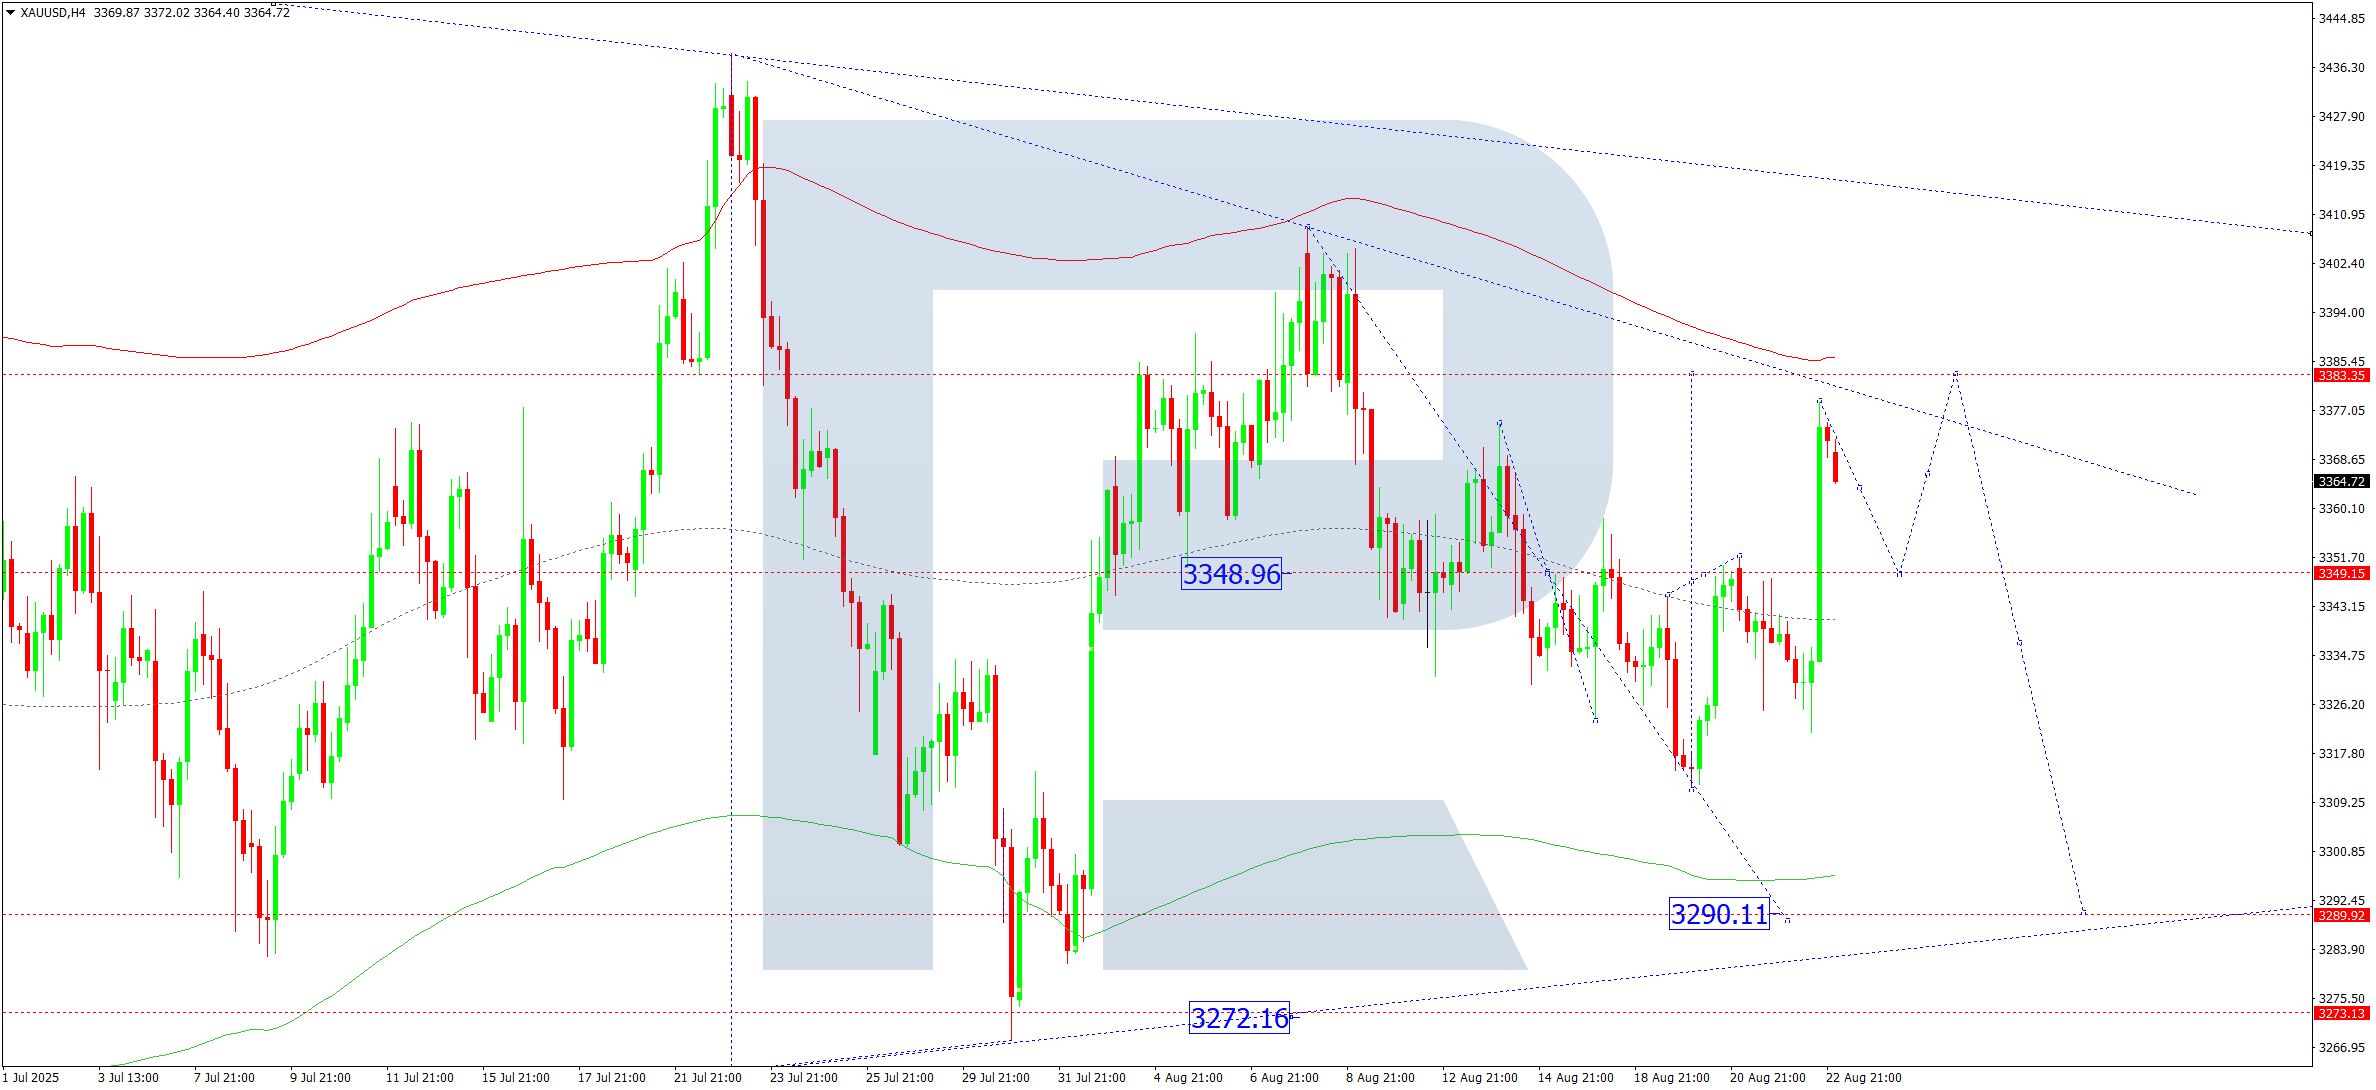
XAUUSD (Gold) Forecast – 25 August 2025
Gold (XAUUSD) continues to consolidate around $3,349 on the H4 chart. After recently rising to $3,377, a dip back to $3,349 is expected. The range could expand to $3,388, viewed as a corrective phase within a broader downtrend. A decline to $3,290 may follow after the correction.
The Elliott Wave analysis with a pivot at $3,349 confirms this outlook. Currently, gold is hovering near the central Price Envelope line, with potential for short-term upside before a deeper decline.
Summary: Expect a short-term rise to $3,388, followed by a possible move lower toward $3,290.
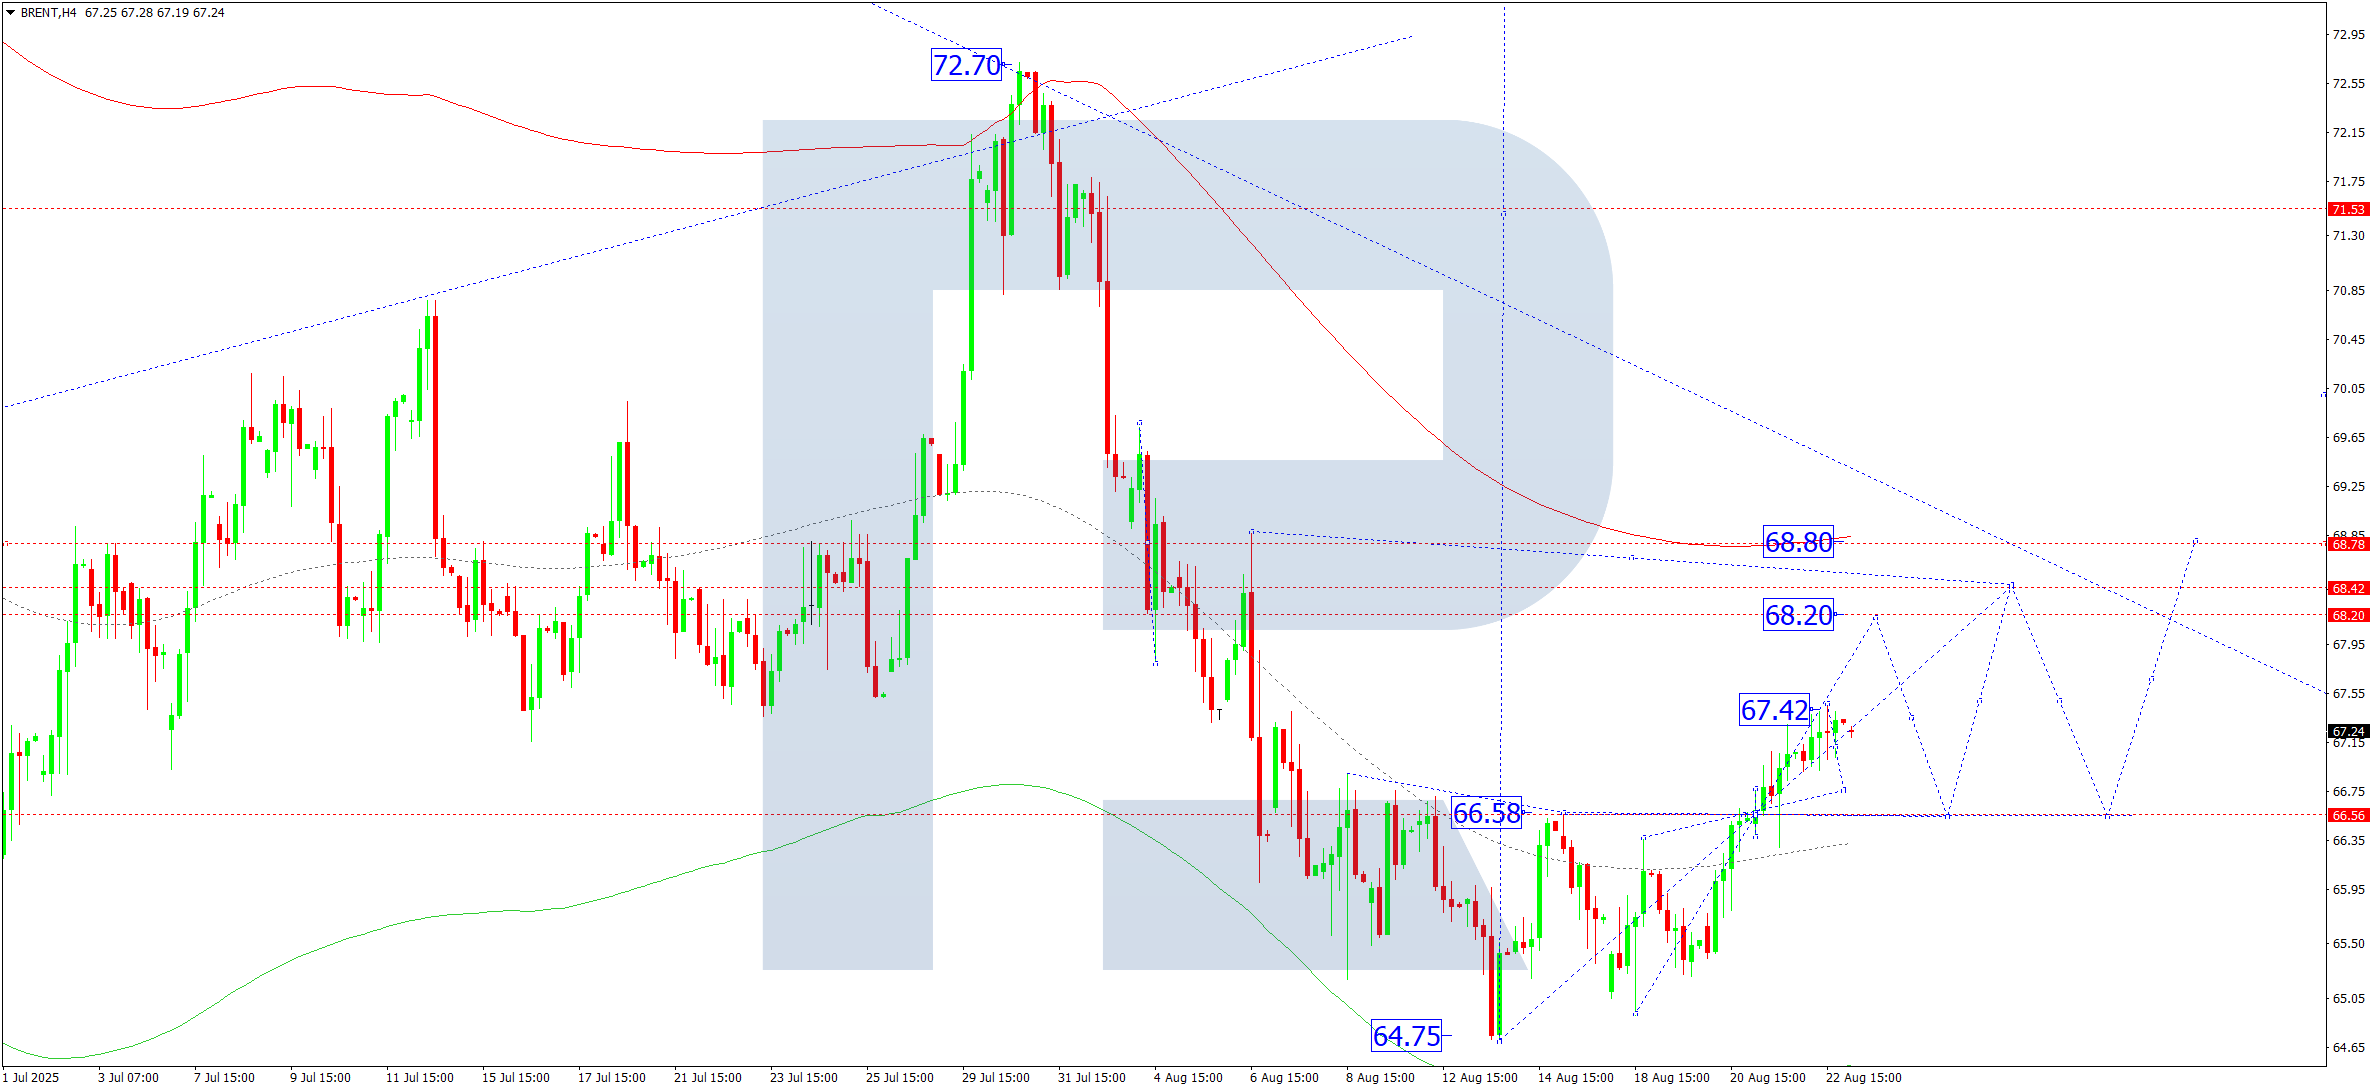
Brent Crude Oil Forecast – 25 August 2025
On the H4 chart, Brent crude completed an upward move to $67.42. A correction to $66.60 may follow. If support holds, the price is expected to resume its uptrend toward $68.20, with potential continuation to $68.40.
The Elliott Wave setup and upward wave matrix, pivoted at $66.60, support a bullish continuation. Brent is advancing toward the upper boundary of the Price Envelope at $68.40, with a pullback to the mid-range also possible afterward.
Summary: Technical indicators support further gains toward $68.40.
Disclaimer: Past performance is not indicative of future results. This analysis is for informational purposes only and does not constitute trading advice. Always conduct your own research and manage risk appropriately.
Leave a Reply