
Daily Technical Analysis and Forecast – 26 August 2025
EURUSD Forecast
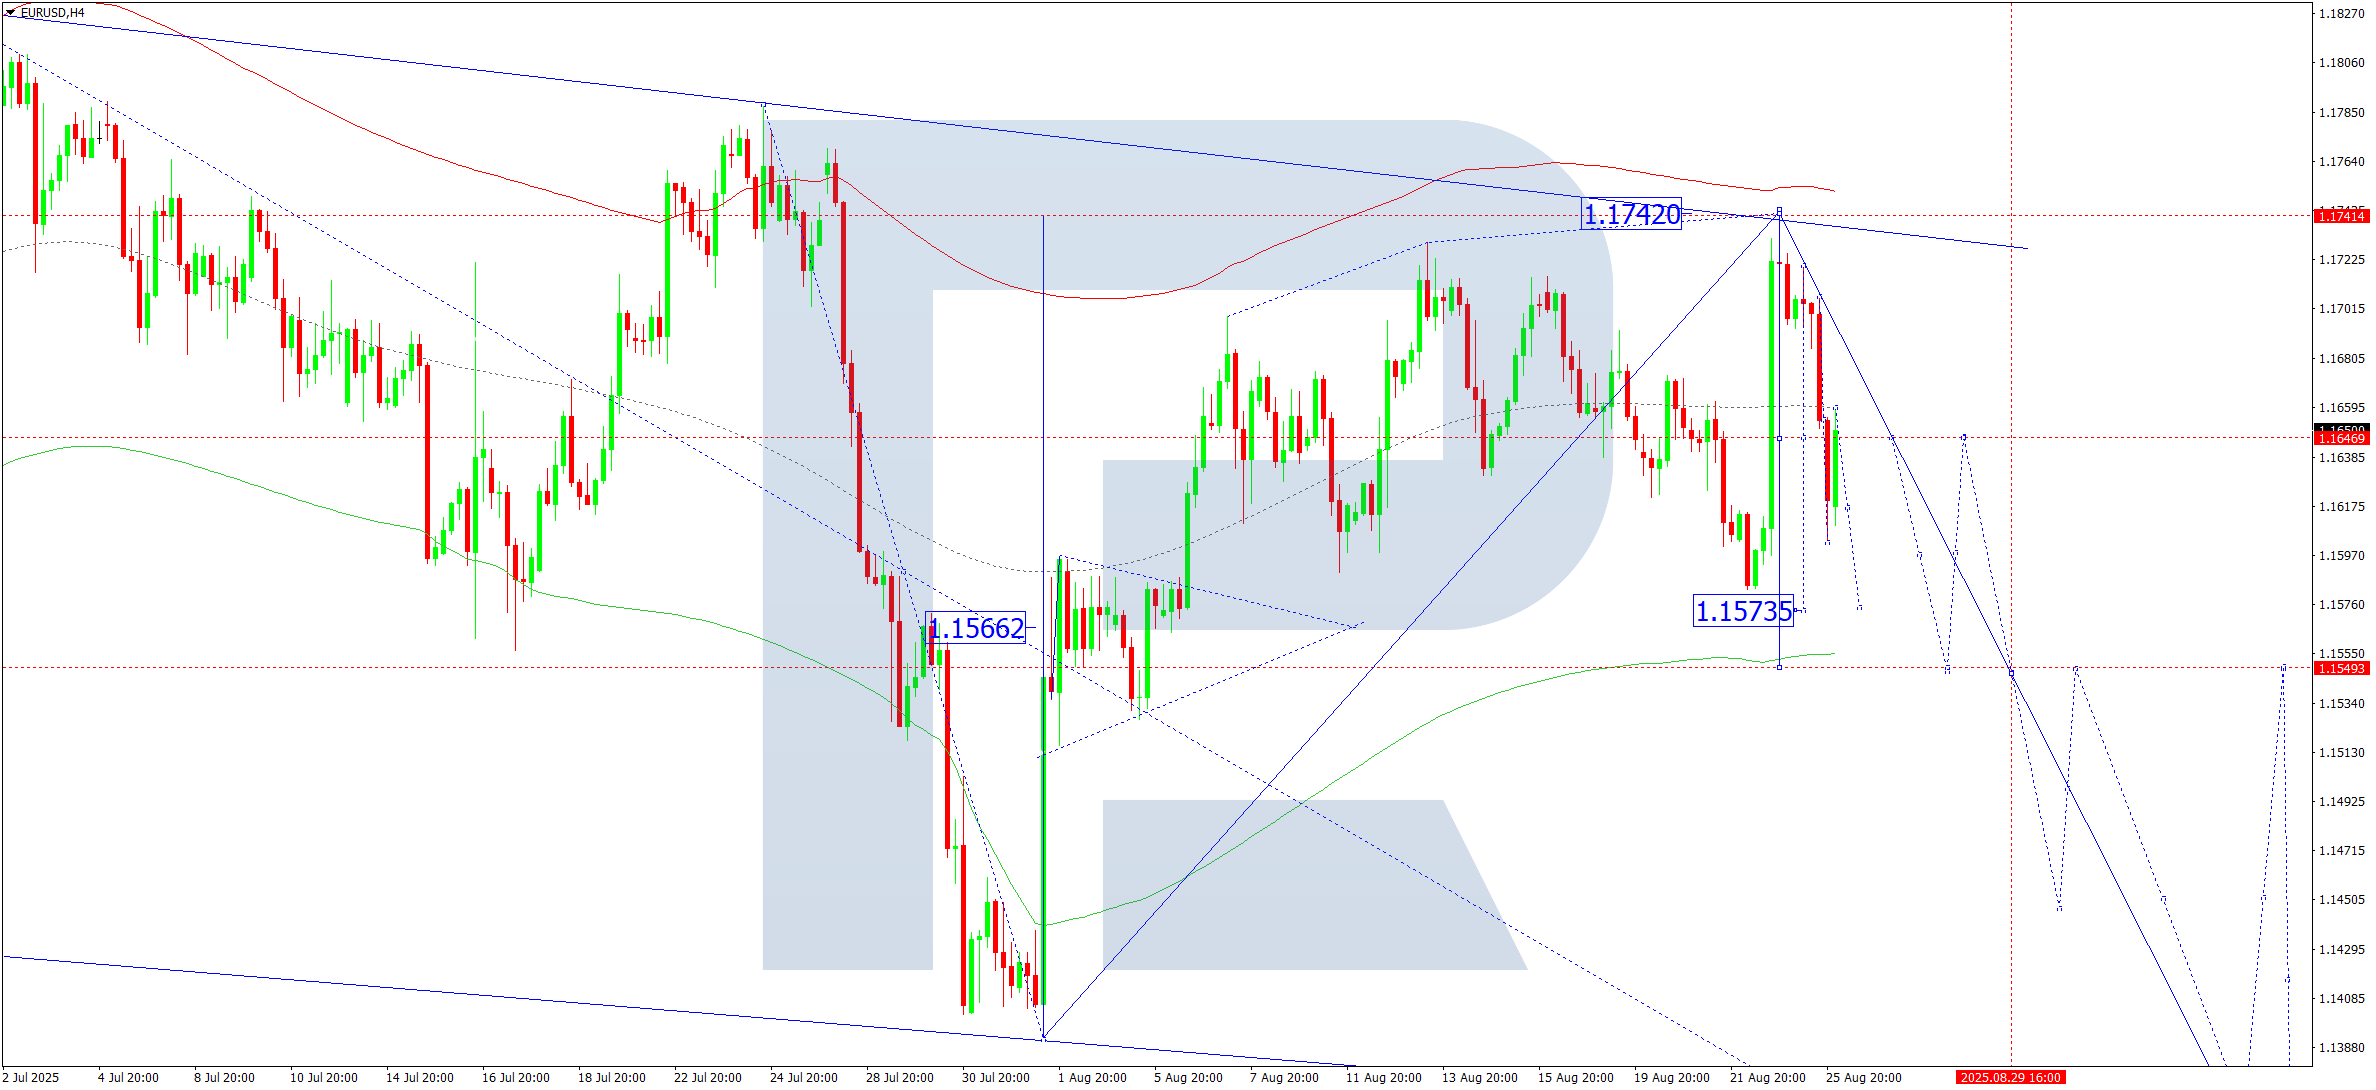
On the H4 chart, EURUSD has broken below the 1.1650 level, continuing its downward movement toward 1.1590. This target is expected to be reached today, 26 August 2025. A short-term correction to 1.1620 could follow, with a subsequent decline towards 1.1550 as the next downside objective.
The Elliott wave structure and the bearish wave matrix, with a pivot at 1.1650, support this scenario. The market is currently forming a downward wave towards the lower boundary of the Price Envelope at 1.1550.
Outlook: Technical indicators point to further downside, targeting 1.1550.
USDJPY Forecast
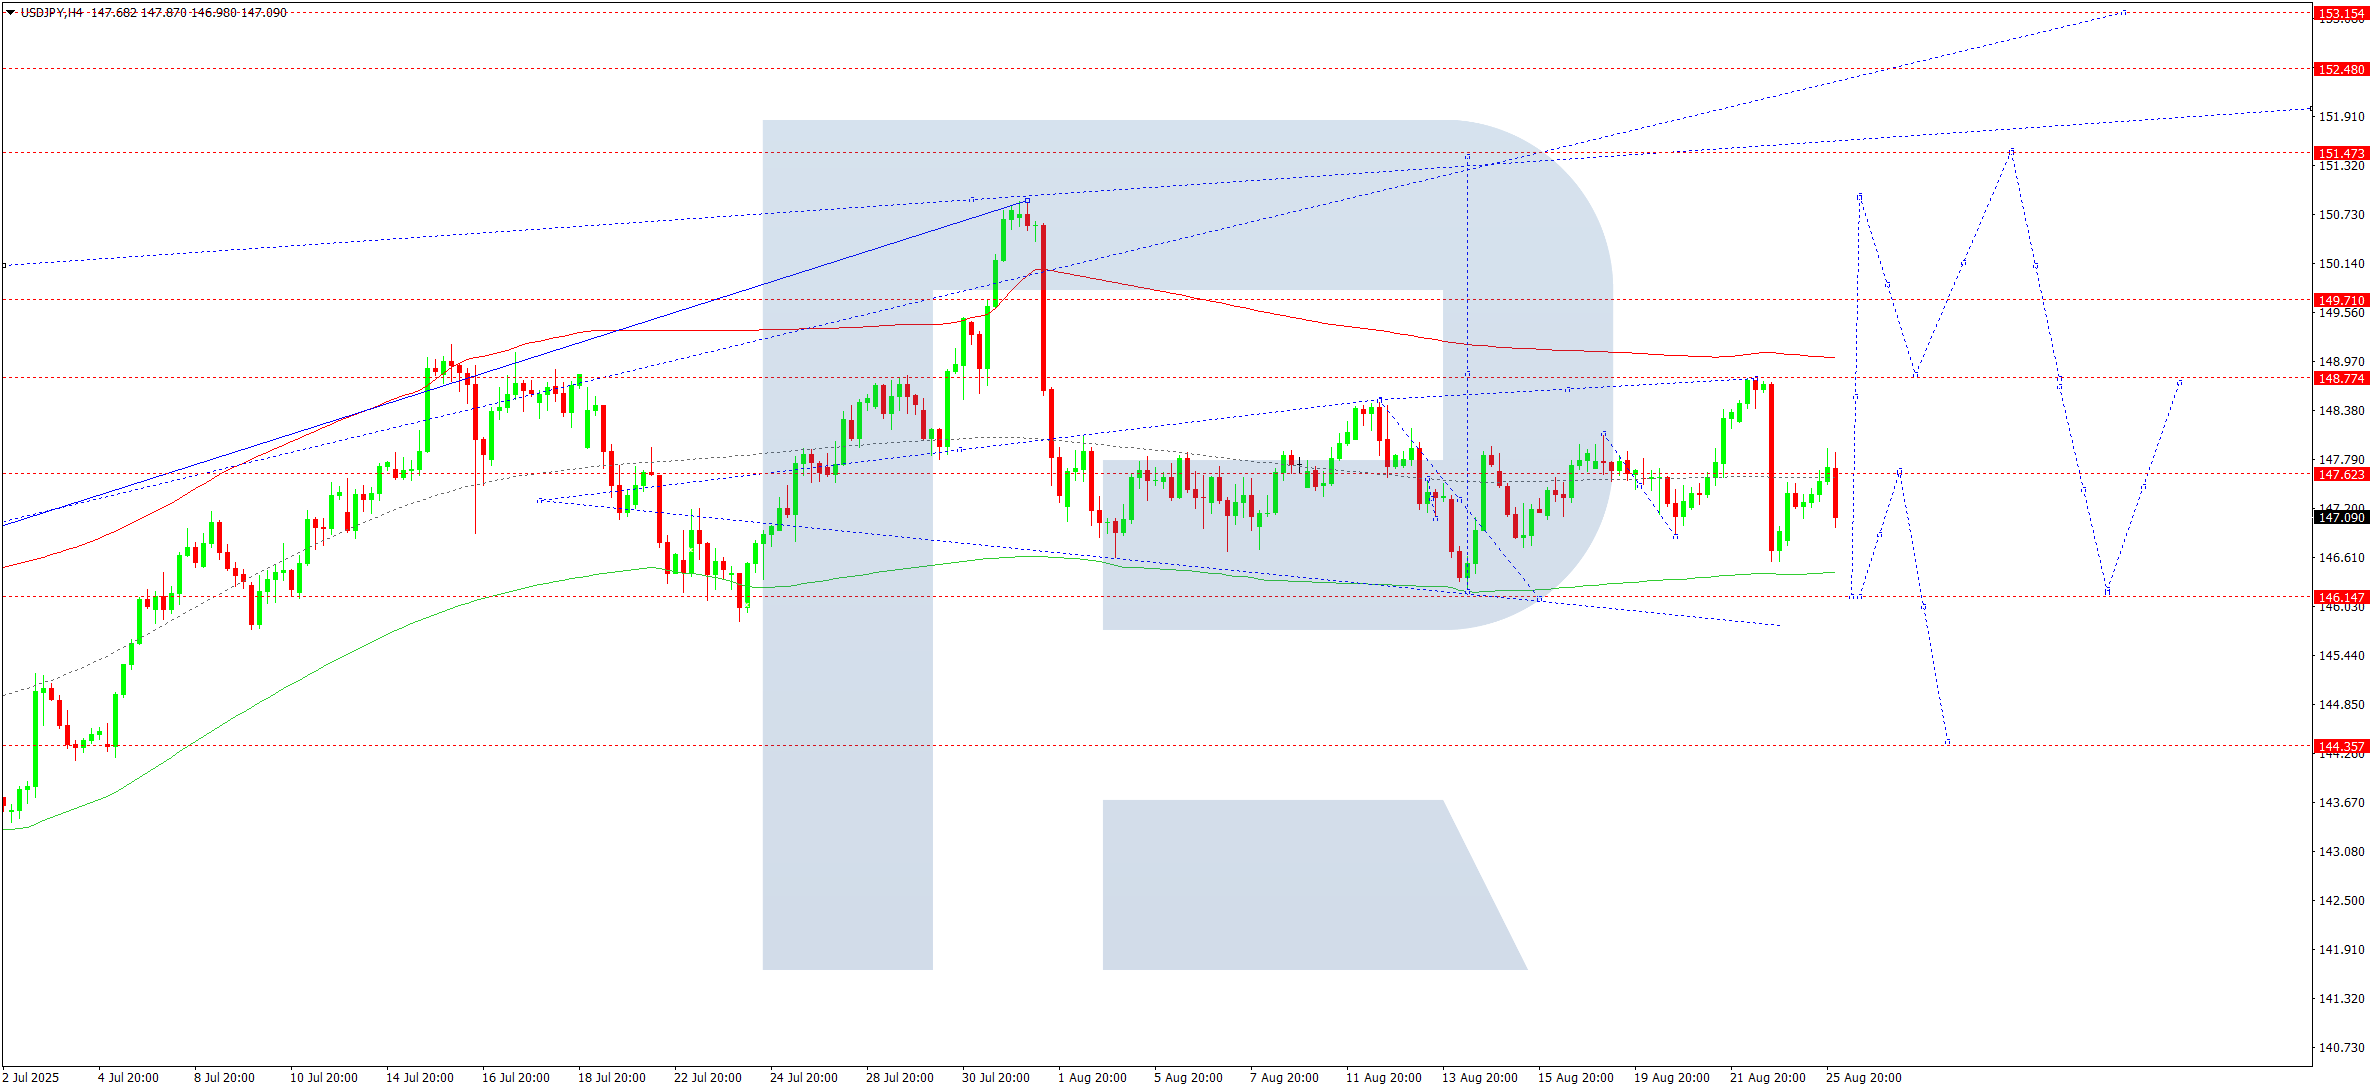
USDJPY remains in a consolidation phase around 147.32 on the H4 timeframe, fluctuating between 148.77 and 146.55. Today, a move lower towards 146.15 is anticipated, potentially followed by a rebound to 147.60.
The Elliott wave and upward wave matrix, with a pivot at 146.15, support the outlook for continued growth. The pair is currently building momentum towards the upper boundary of the Price Envelope at 151.47, with the central consolidation line near 147.60.
Outlook: Technical indicators suggest a potential upward move towards 150.75.
GBPUSD Forecast
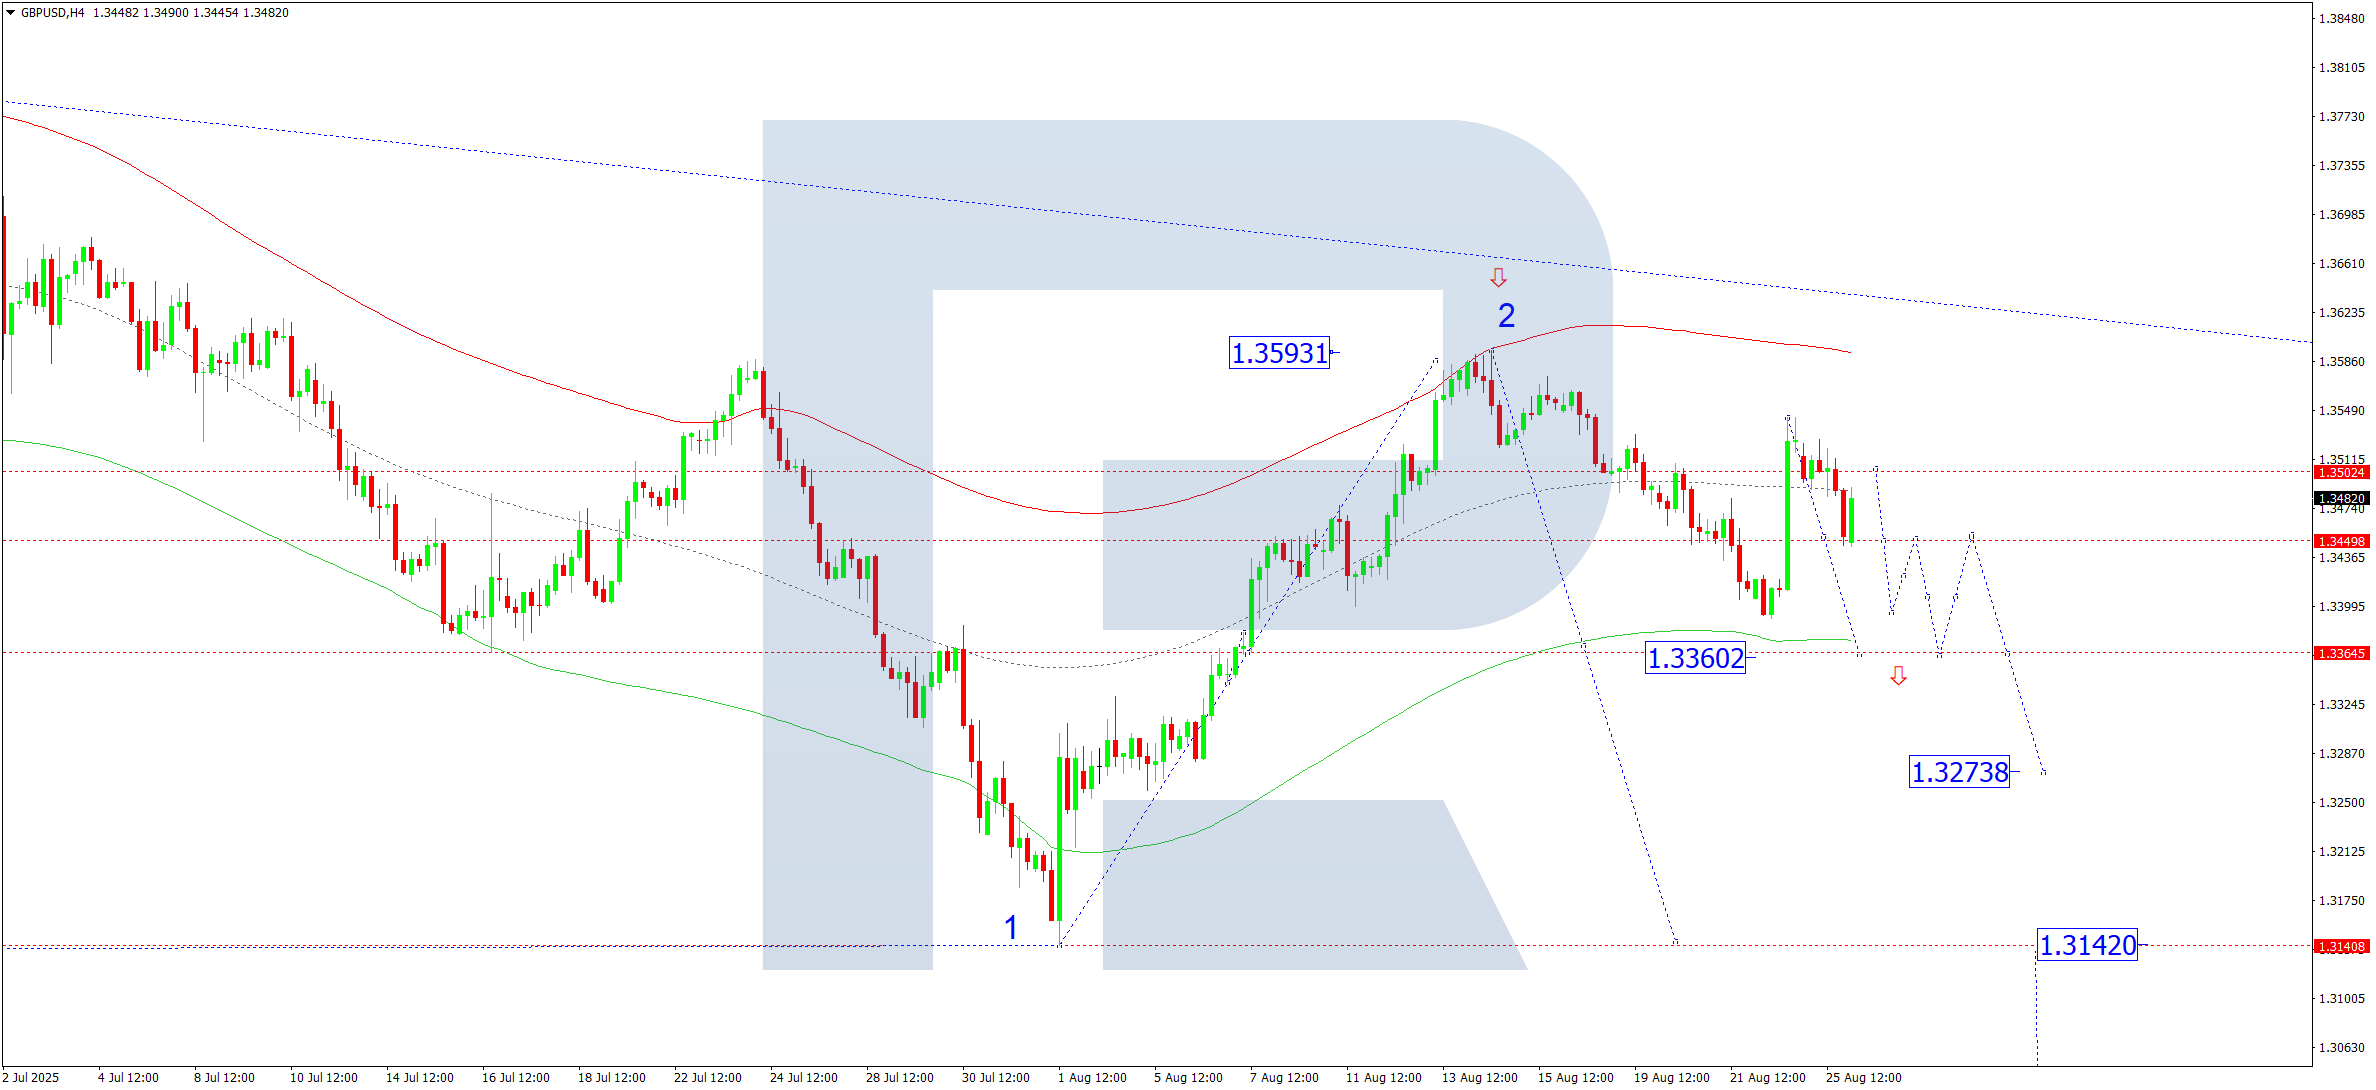
GBPUSD is progressing in a downward wave on the H4 chart, heading towards 1.3360. This level may be reached today. A corrective bounce to 1.3500 could follow. The broader picture shows continued consolidation, with a further drop to 1.3140 remaining a likely target.
The Elliott wave and bearish wave matrix, centered at 1.3475, confirm this scenario. The pair is trending towards the lower boundary of the Price Envelope at 1.3360, with possible retracement to the midline at 1.3475.
Outlook: Indicators favor continuation of the decline towards 1.3360.
AUDUSD Forecast
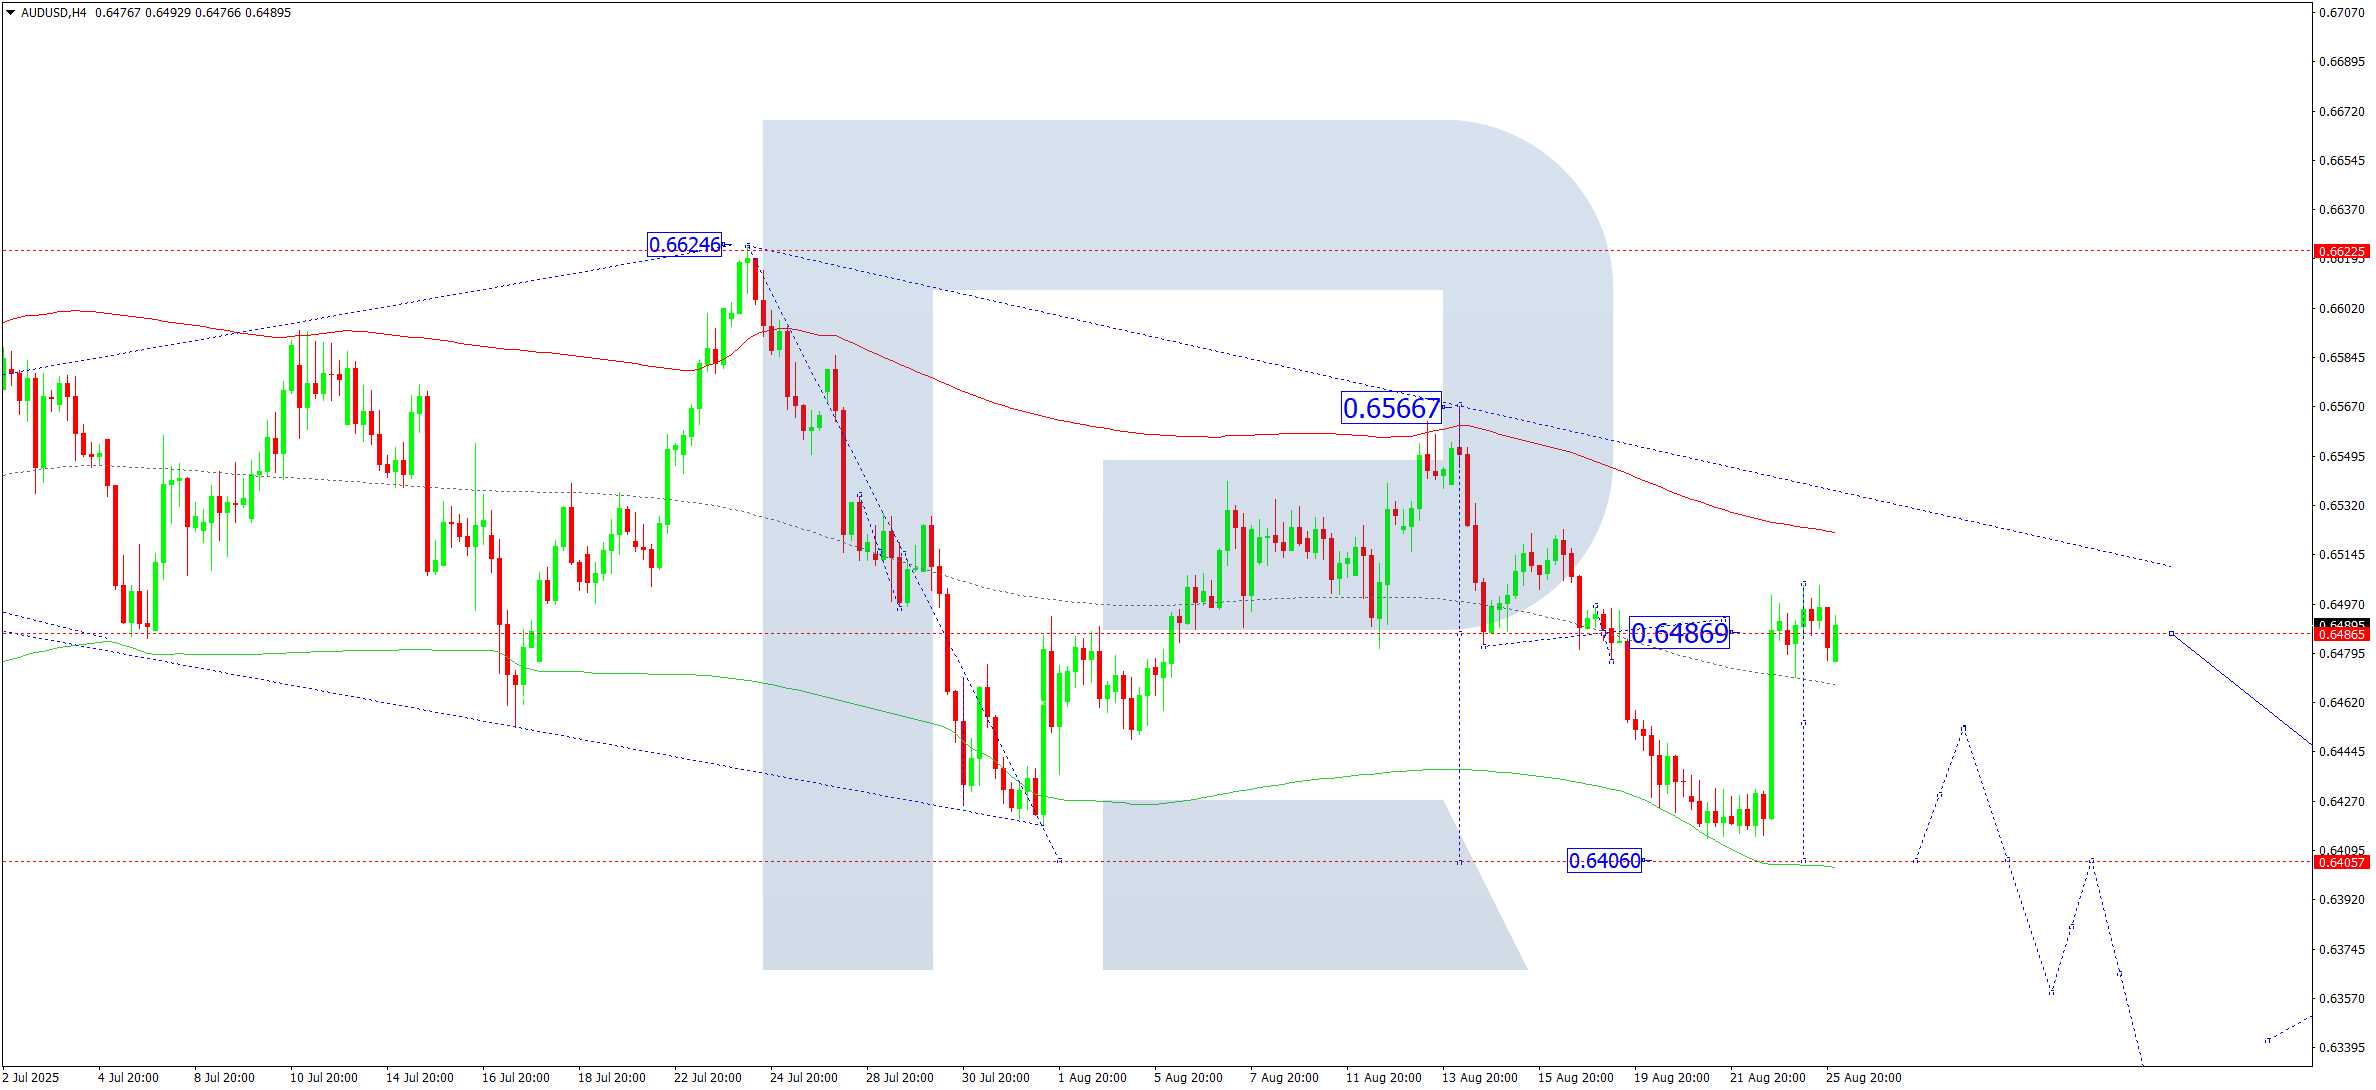
AUDUSD is consolidating around the 0.6486 level on the H4 timeframe. A downward breakout is anticipated today, with the pair likely to extend its move toward 0.6400. A corrective pullback to 0.6480 could follow afterward.
The Elliott wave structure and bearish wave matrix, pivoting at 0.6515, support this scenario. The market is forming the fifth leg of the downward wave targeting the lower boundary of the Price Envelope at 0.6400.
Outlook: Technical signals point to further downside toward 0.6400.
USDCAD Forecast
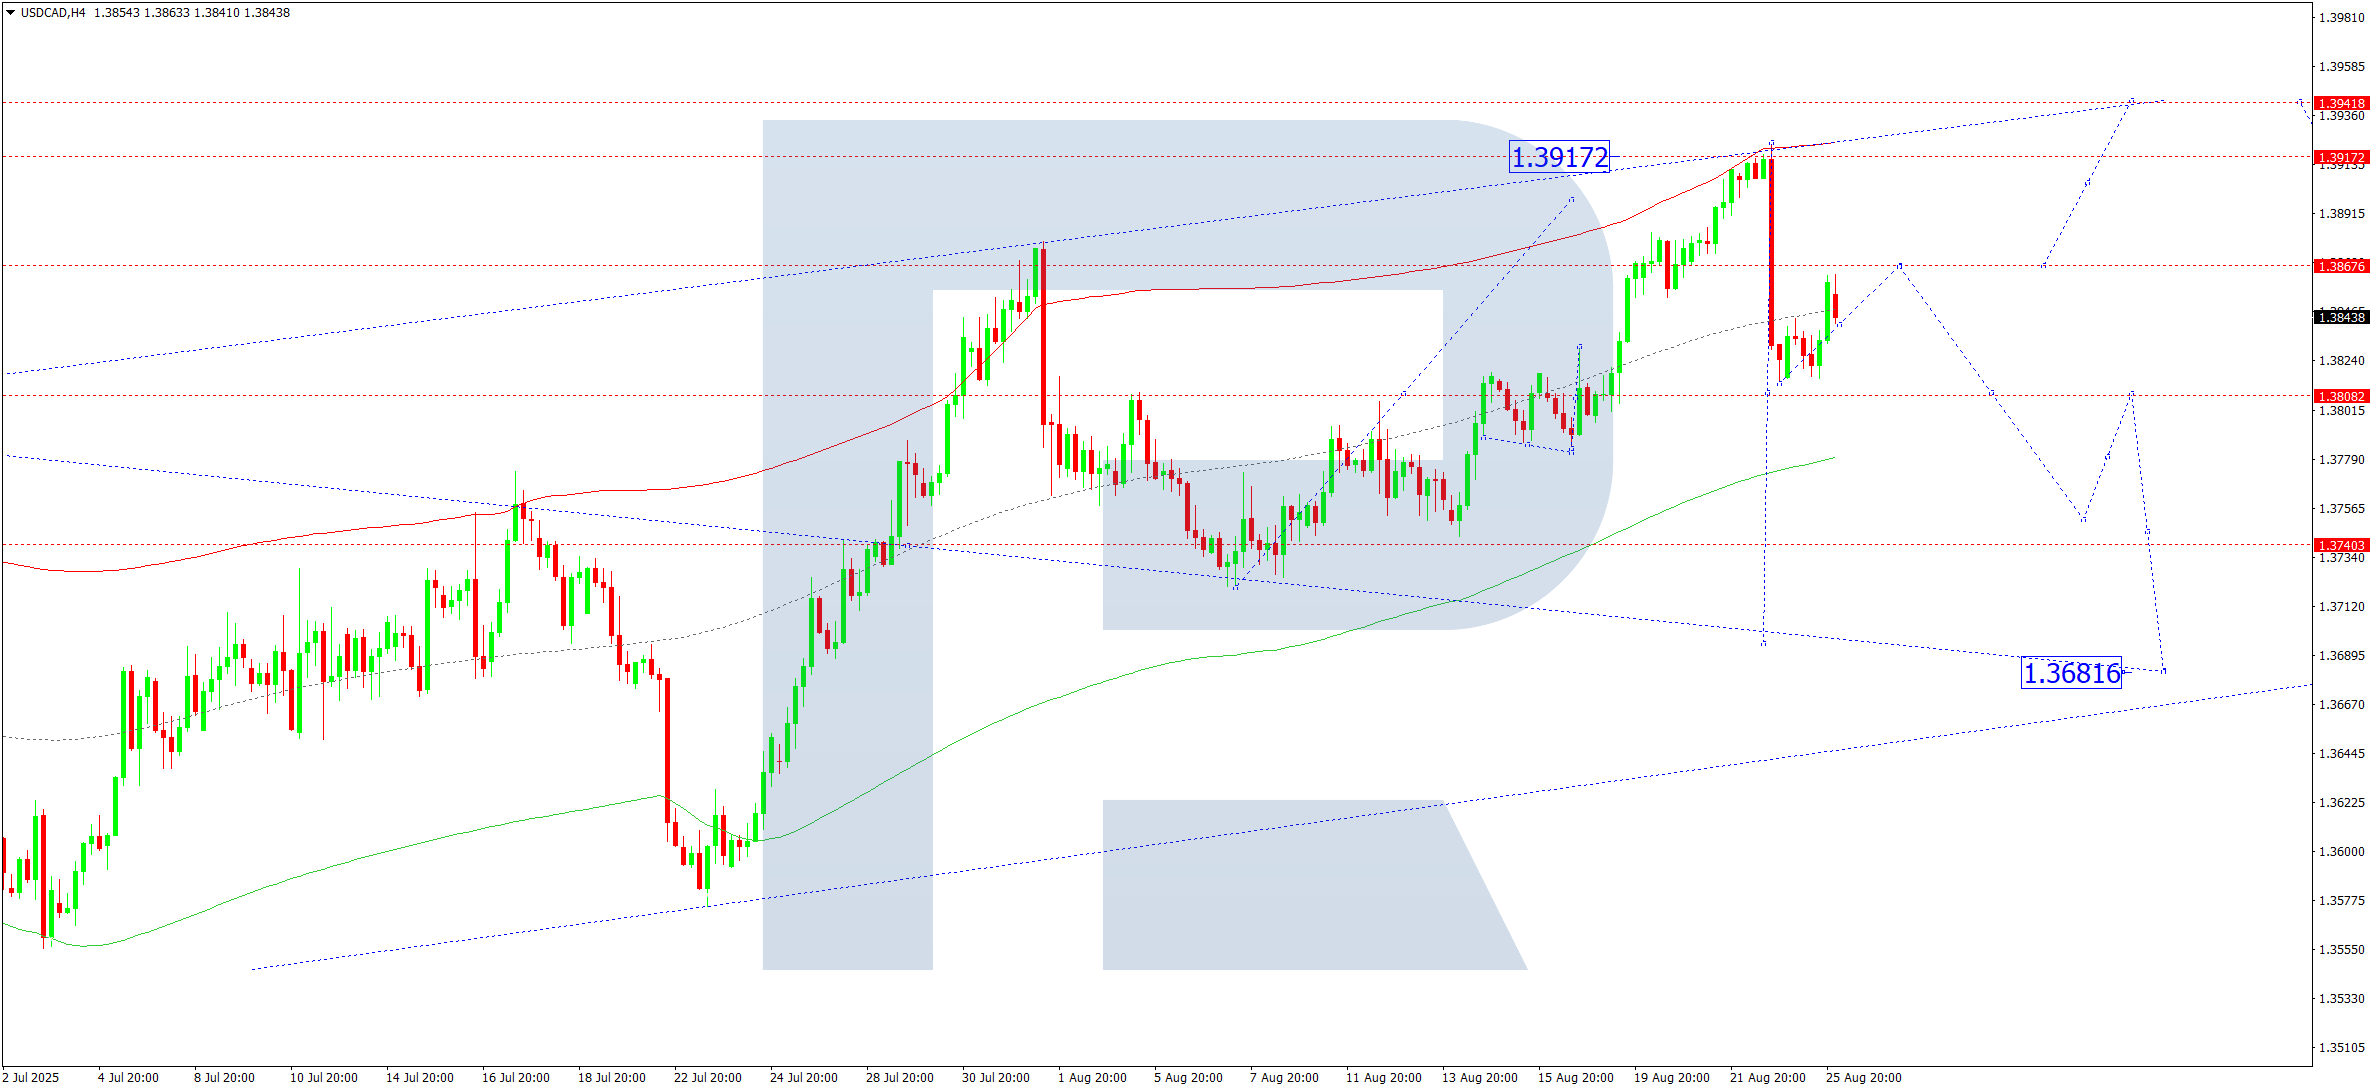
USDCAD has recently corrected to 1.3814 on the H4 chart. A move up to 1.3868 is possible today, forming a short-term consolidation range. A breakout above this level could push the pair to 1.3942, while a drop below support may lead to a correction towards 1.3777.
The Elliott wave and bullish wave matrix, with a pivot at 1.3740, support this upward scenario. The pair has tested the upper Price Envelope boundary at 1.3917, and a retracement to 1.3800 or even 1.3688 remains a possibility.
Outlook: Indicators support a rise toward 1.3868 in the near term.
XAUUSD (Gold) Forecast
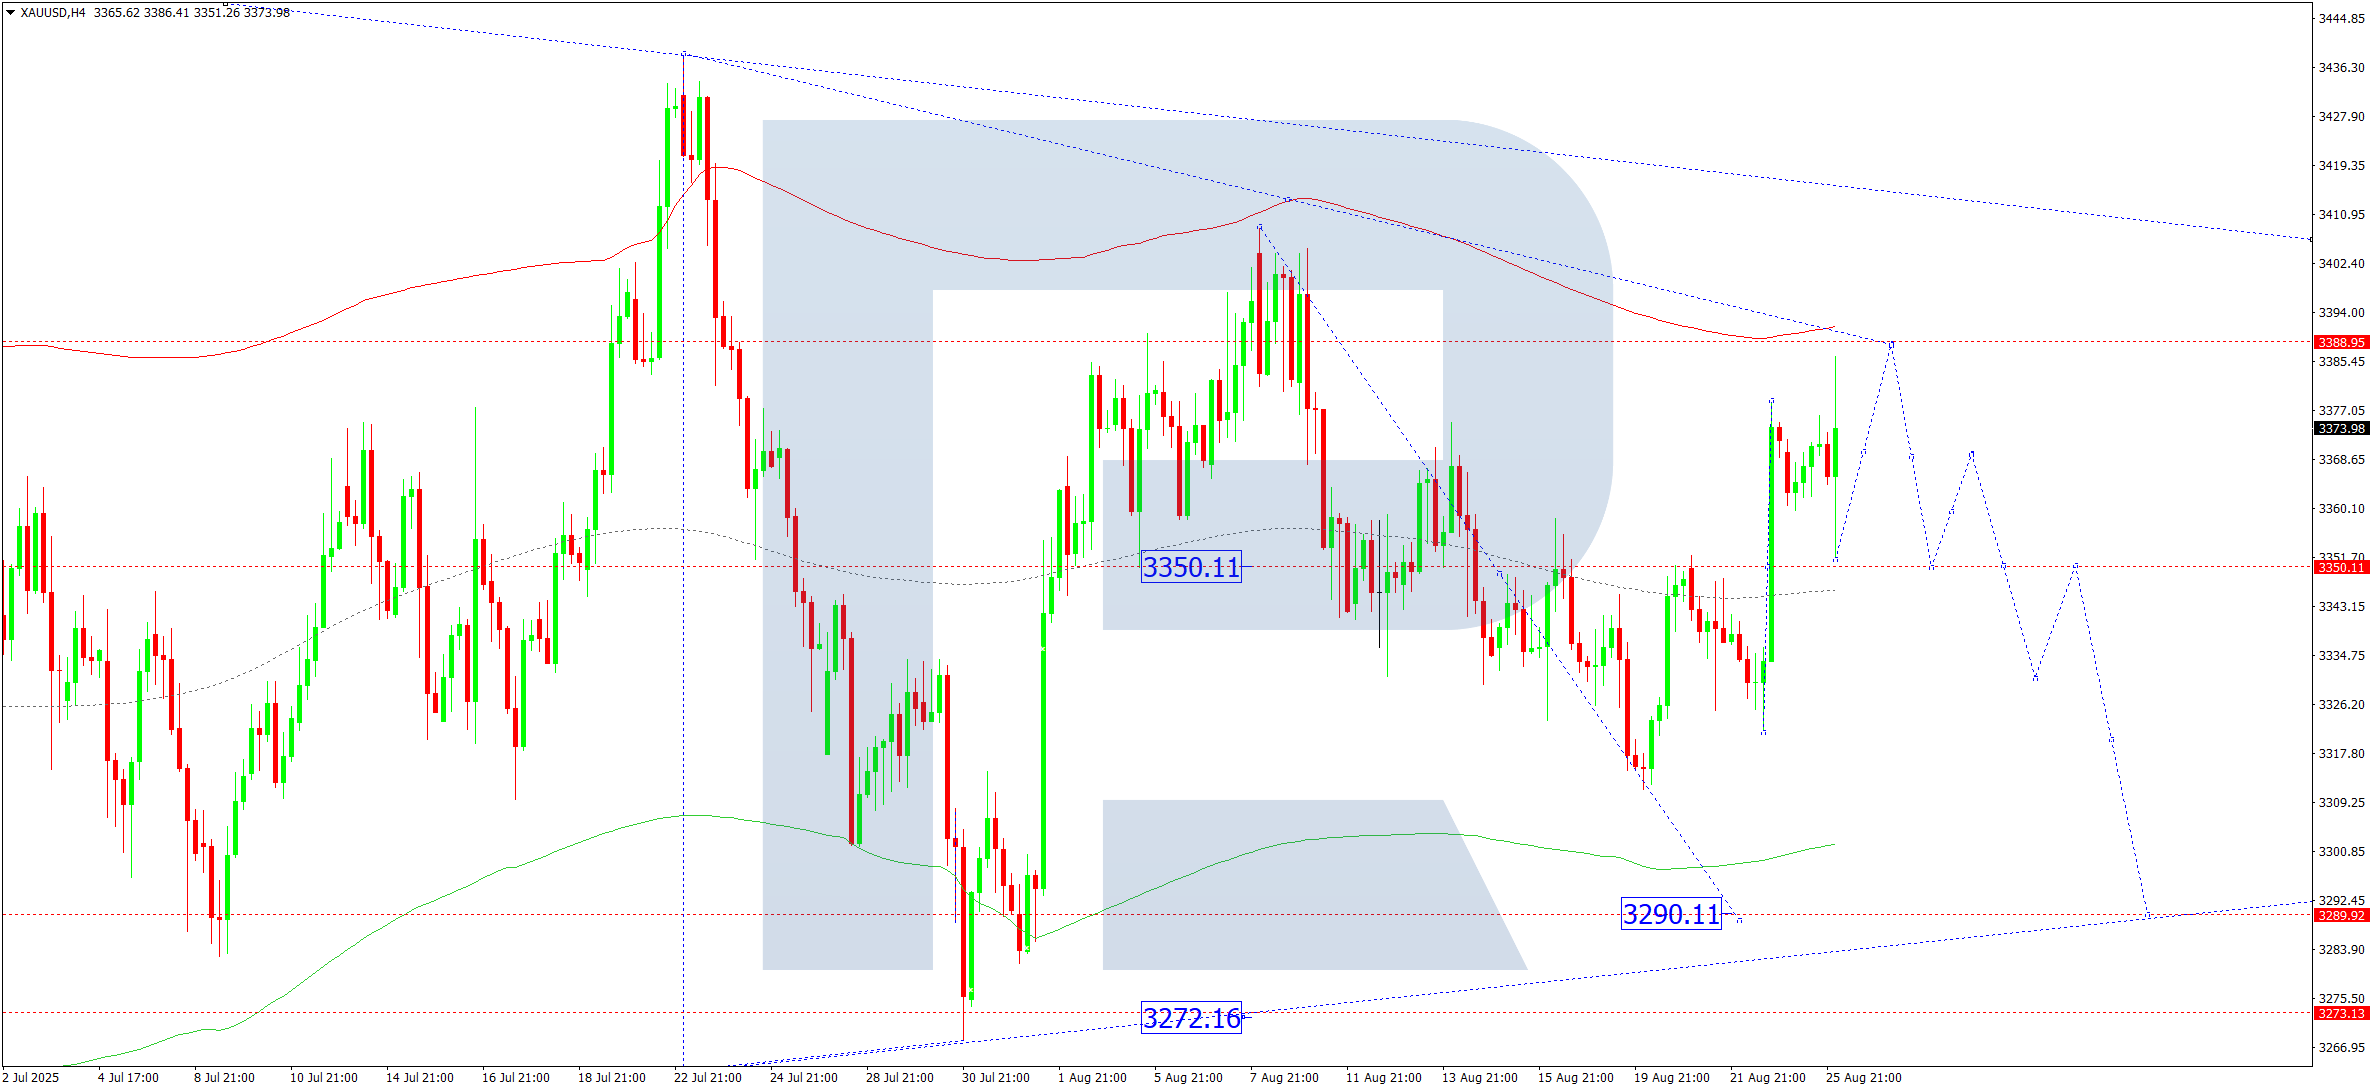
XAUUSD continues to consolidate near 3,350 on the H4 chart. After reaching 3,386, a further push to 3,388 is possible today. This may be followed by a downward correction to 3,290.
The Elliott wave and bearish matrix, centered at 3,349, support this scenario. Gold remains near the central line of the Price Envelope and could see expansion towards 3,388 before a reversal to the lower boundary at 3,290.
Outlook: Indicators suggest a short-term rise to 3,388 before potential decline.
Brent Forecast
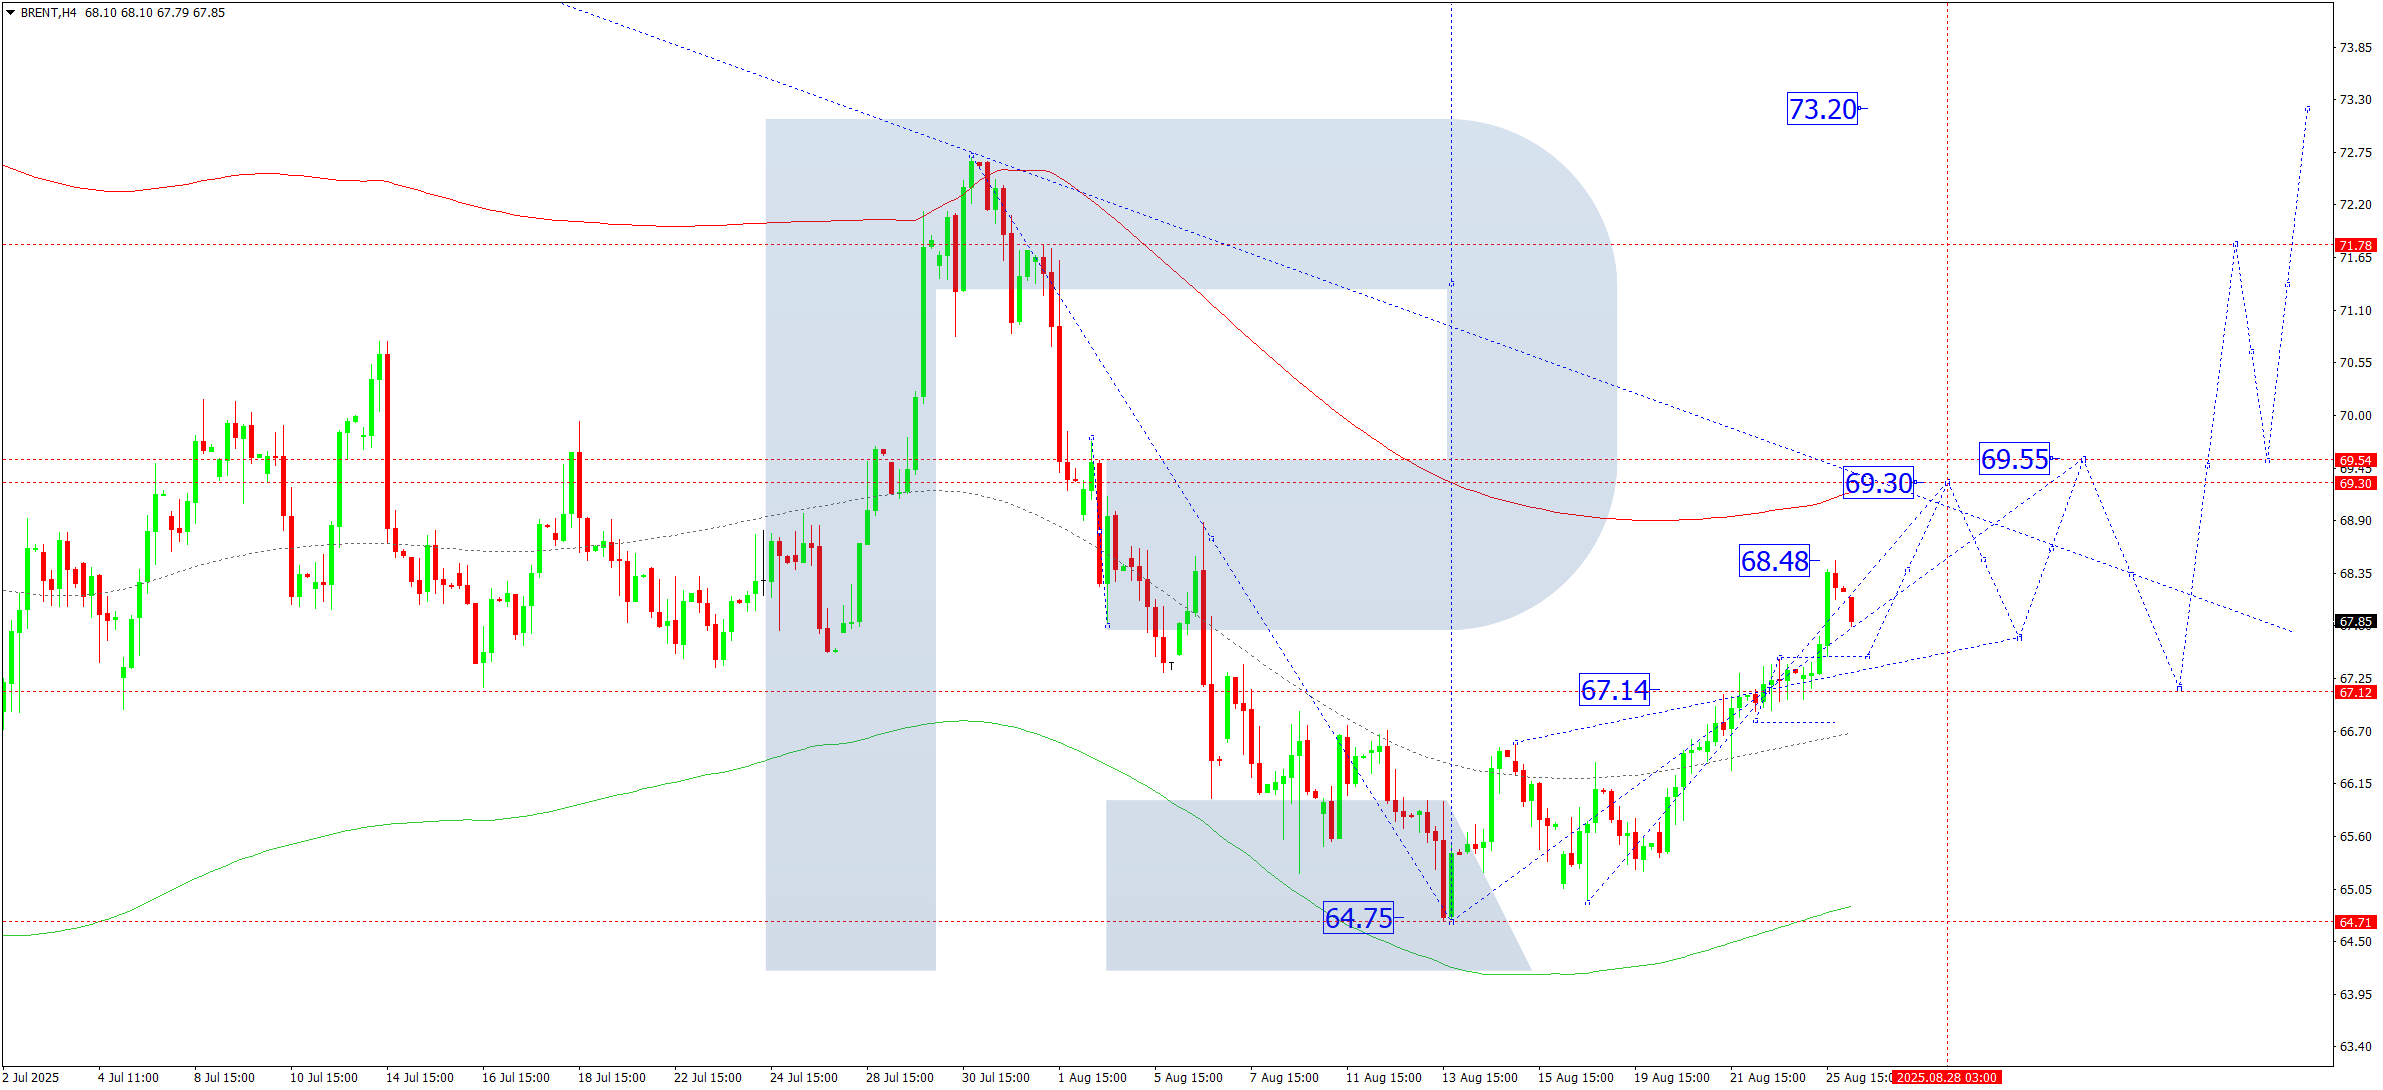
Brent crude has completed a bullish wave to 68.48. A correction to 67.45 may occur today, followed by continued growth toward 69.30. If bullish momentum persists, a move to the next target at 69.55 is possible.
The Elliott wave structure and bullish wave matrix, pivoting at 67.14, confirm this as the main scenario. The price is climbing toward the upper boundary of the Price Envelope at 69.55, with a potential corrective dip to the midline at 67.14.
Outlook: Technical indicators support further gains toward 69.30.
Risk Disclaimer:
Past performance does not guarantee future results. Technical analysis is based on historical price patterns and is not a definitive prediction of future market behavior. Always consider your risk tolerance and trading strategy before making investment decisions.
Leave a Reply