
Daily Technical Analysis and Forecast – 29 August 2025
EURUSD Forecast – 29 August 2025
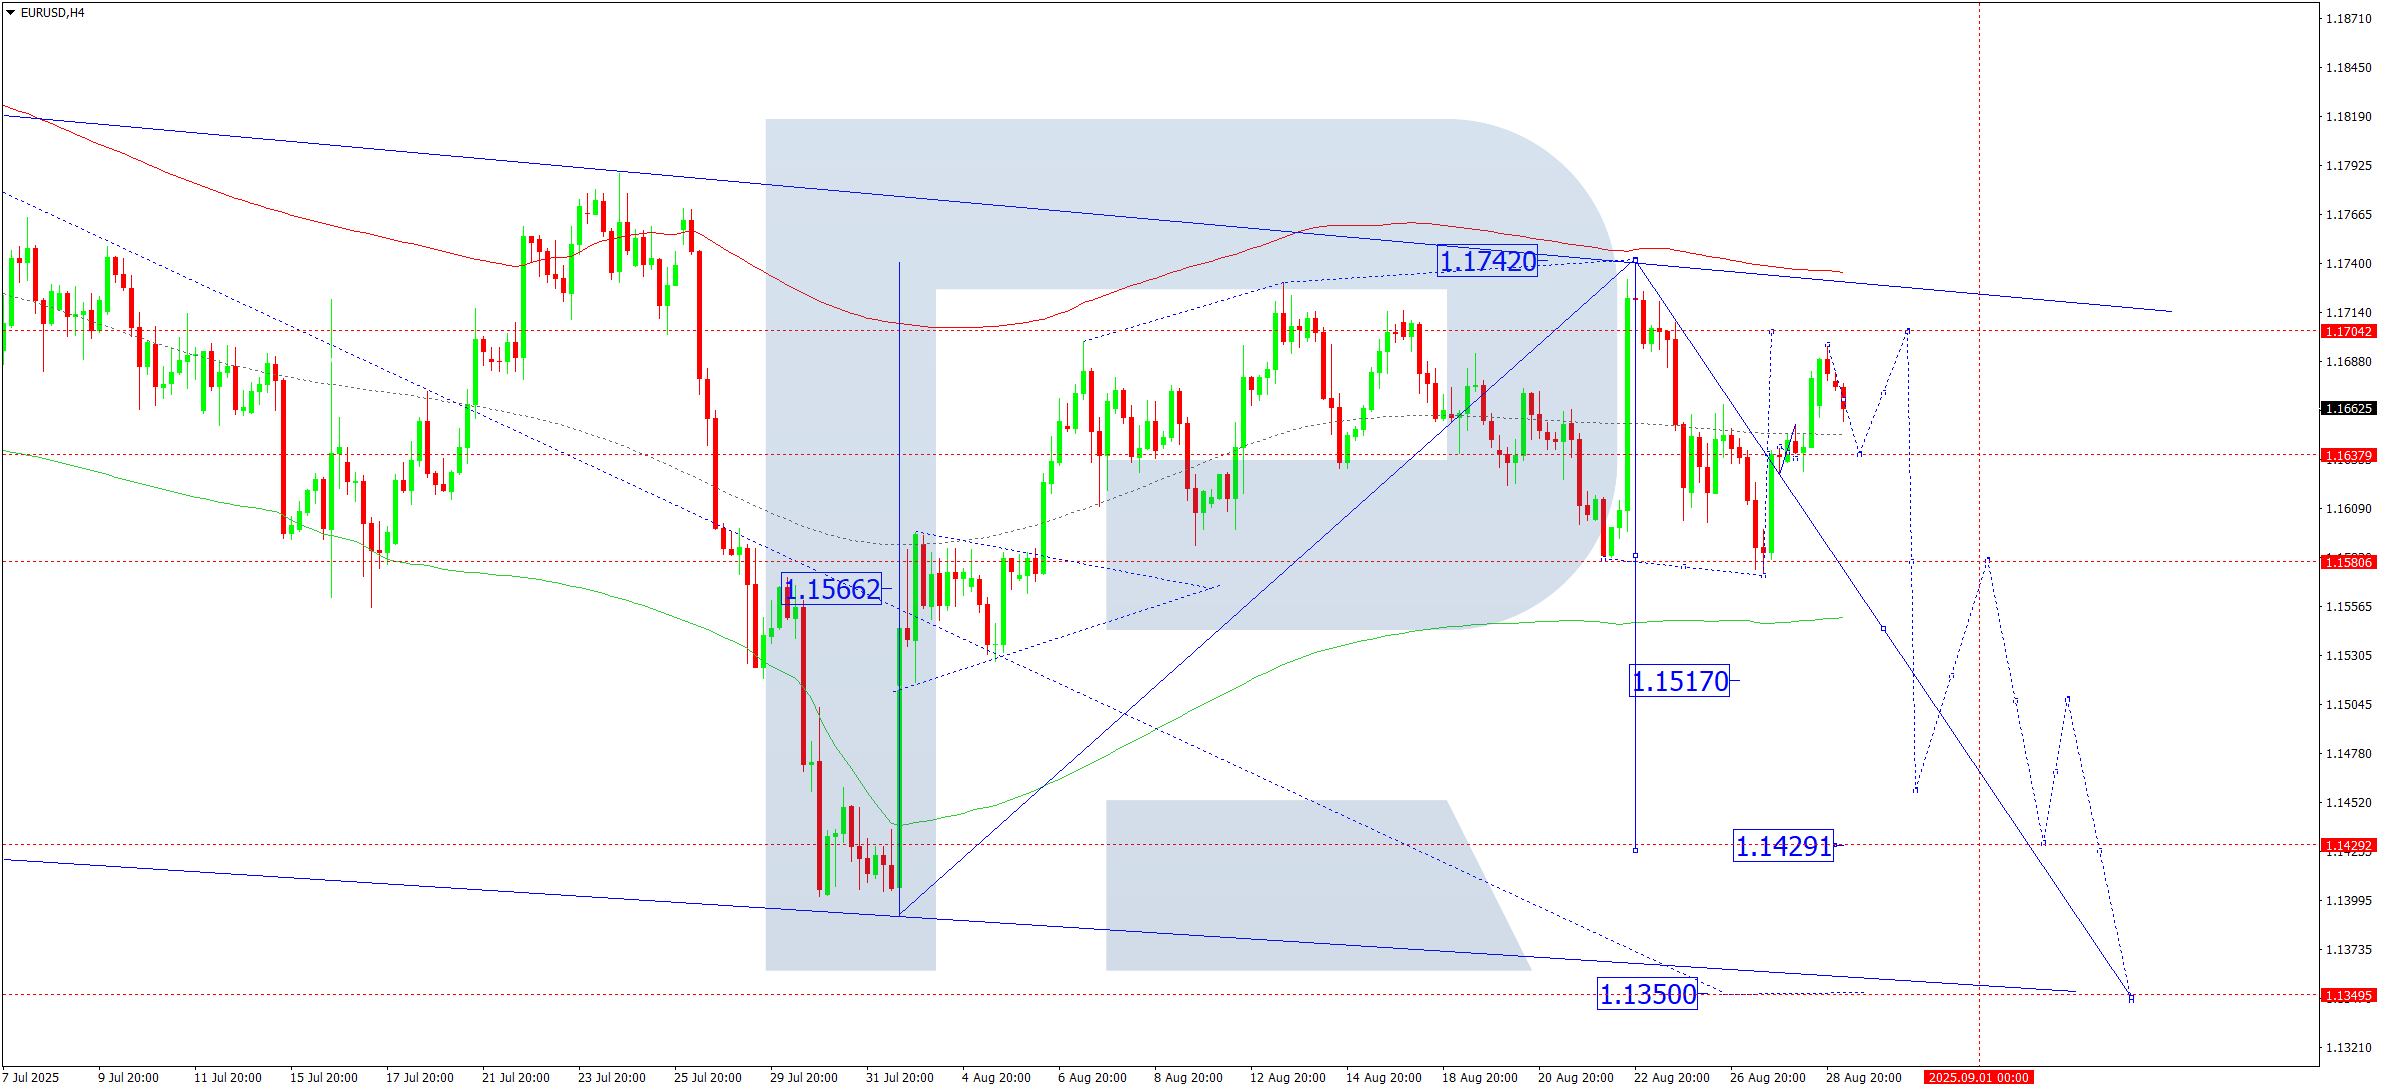
On the H4 chart, EURUSD recently formed a consolidation range around 1.1630. After breaking upward, it completed a growth wave reaching 1.1696. For today, a pullback to 1.1630 (to test the breakout level) is anticipated, followed by a potential upward continuation to 1.1704. This level may mark the completion of the current growth wave, after which a downward movement targeting 1.1580, and possibly extending to 1.1460, could begin.
Technical outlook:
The Elliott Wave structure and a bearish wave matrix pivoting at 1.1630 support this scenario. Currently, the price is moving toward the upper boundary of the Price Envelope near 1.1704.
Indicator Summary: Expect continued upward movement toward 1.1704.
USDJPY Forecast – 29 August 2025
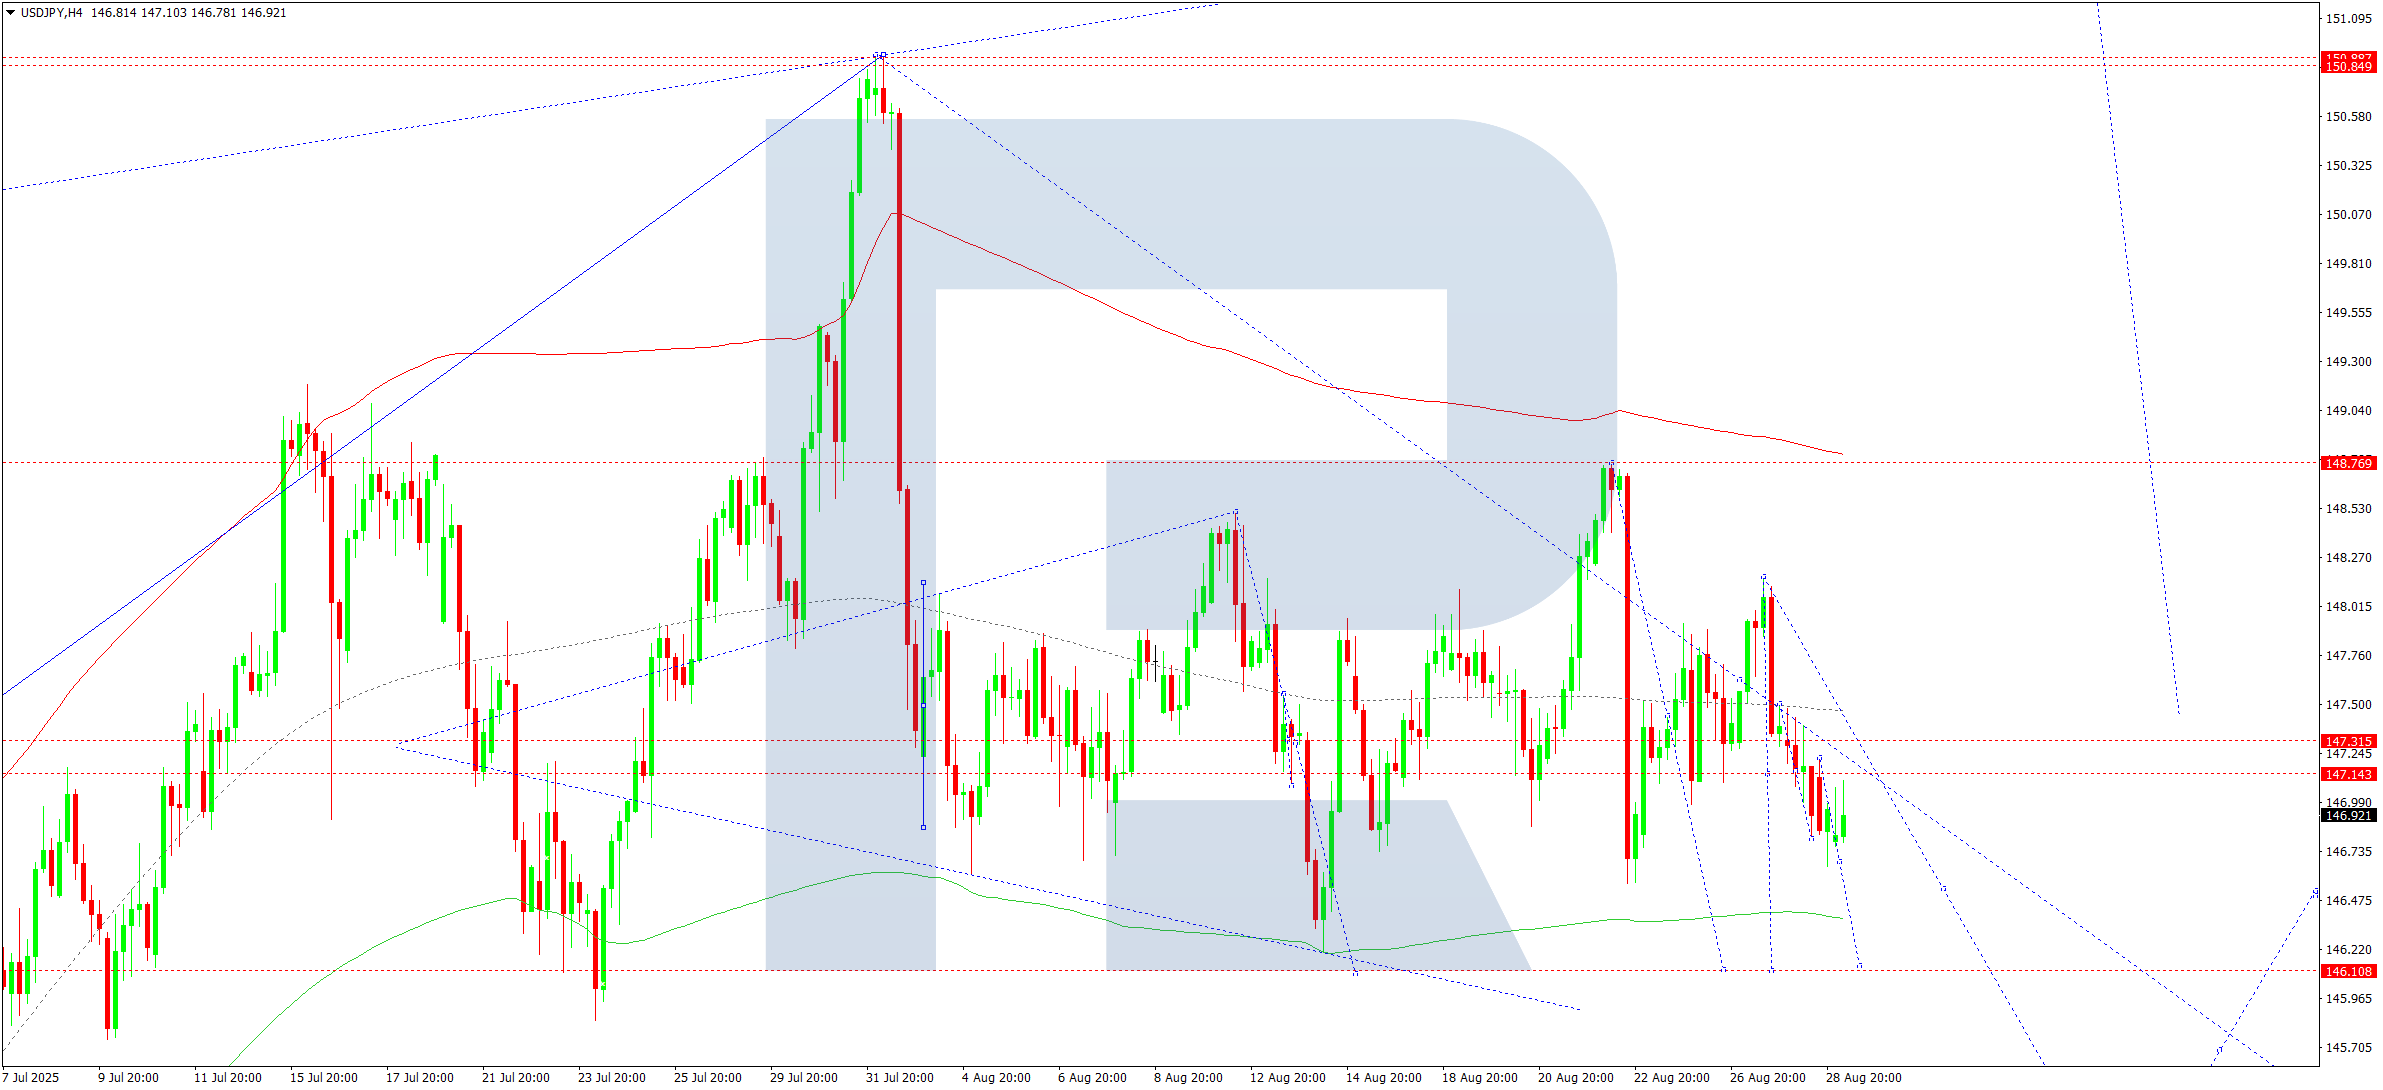
On the H4 timeframe, USDJPY has broken below 147.30, continuing its decline toward 146.11. Today, the pair is expected to reach that level before potentially rebounding to 147.30, with a possible extension to 148.80.
Technical outlook:
The Elliott Wave formation and bullish wave matrix pivoting around 147.44 support this scenario. The market is consolidating near the center of the Price Envelope at 147.44, with expectations of a downward move to 146.11.
Indicator Summary: Short-term decline to 146.11 likely.
GBPUSD Forecast – 29 August 2025
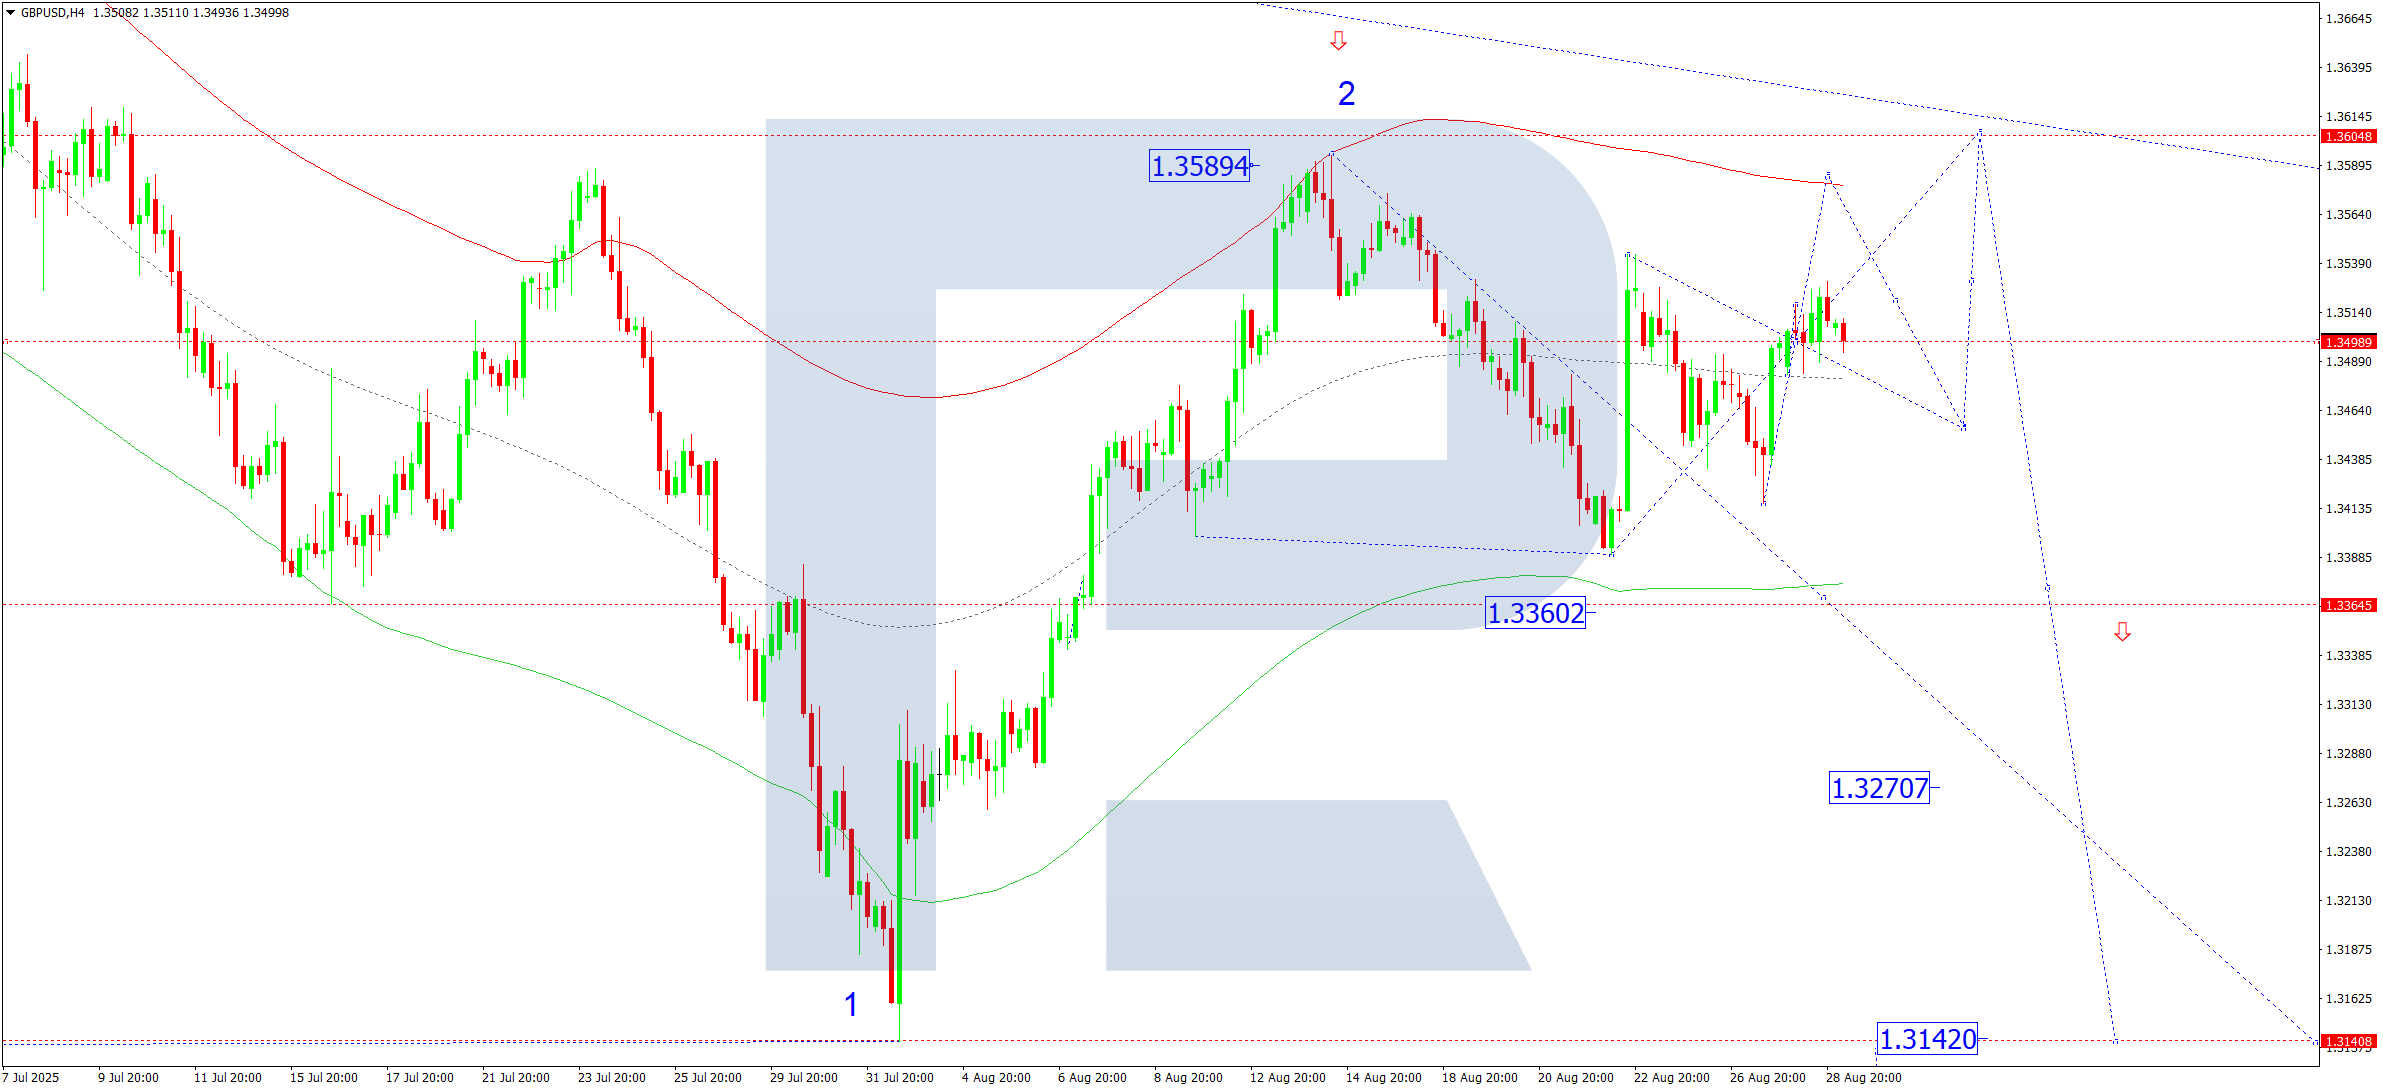
GBPUSD remains in a consolidation zone near 1.3500 on the H4 chart. A breakout to the upside could open the path toward 1.3600, while a break lower could lead to 1.3360, with potential continuation to 1.3142.
Technical outlook:
The Elliott Wave pattern and bearish wave matrix with a pivot at 1.3492 indicate a downward bias. Price is currently hovering around the center of the Price Envelope at 1.3492, and a drop toward 1.3360 appears likely.
Indicator Summary: Continued decline toward 1.3360 expected.
AUDUSD Forecast – 29 August 2025
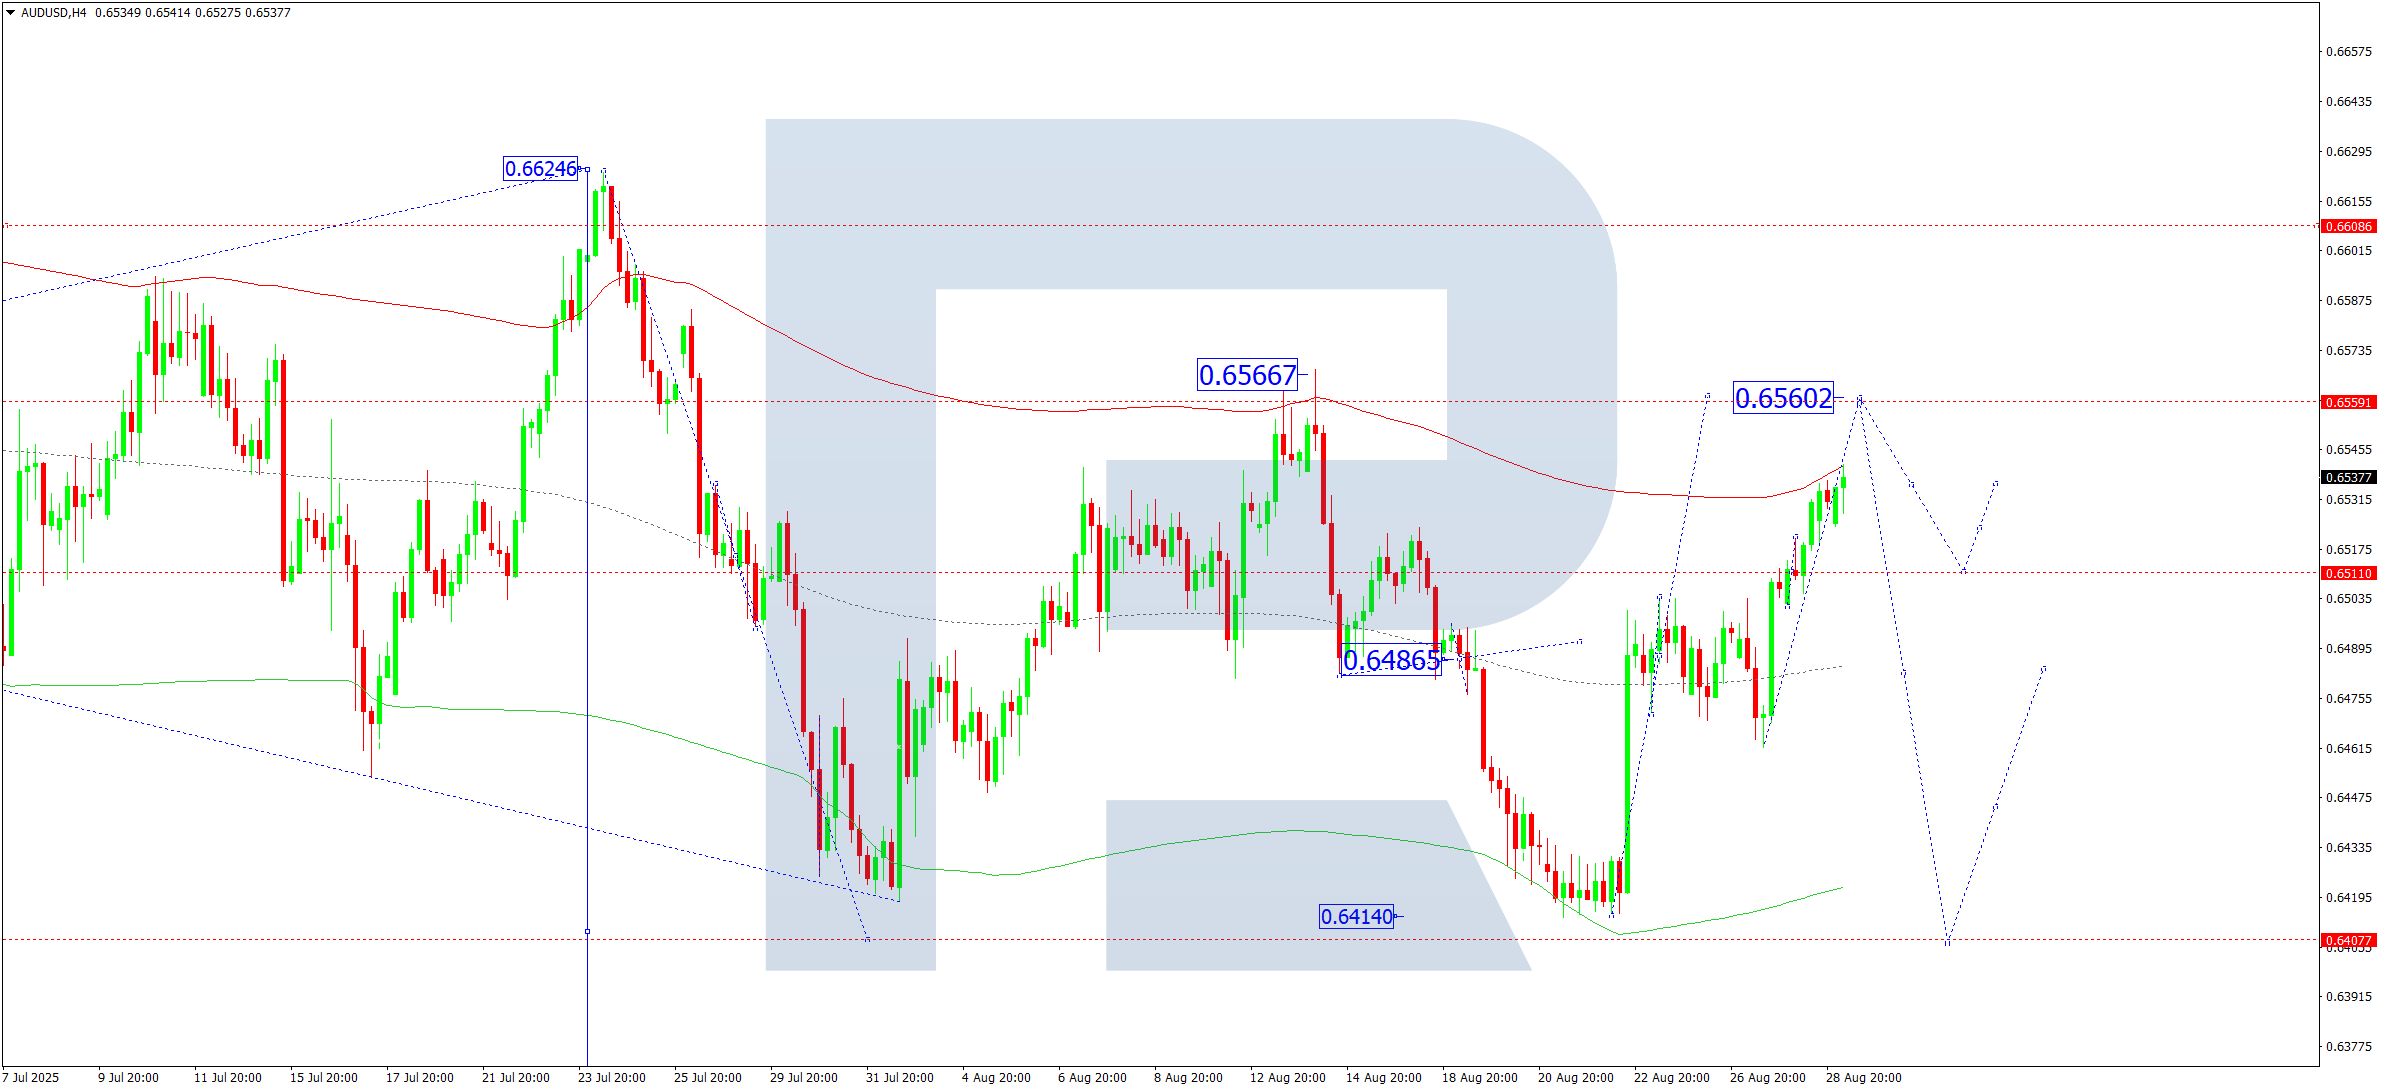
AUDUSD has broken out of a consolidation range on the H4 chart and is moving toward 0.6560. Once this level is reached, a pullback to 0.6486 is possible. If that level breaks, a continuation to 0.6400 could follow.
Technical outlook:
The Elliott Wave count and bearish wave matrix pivoting at 0.6515 support this scenario. The pair is correcting towards the upper limit of the Price Envelope at 0.6560.
Indicator Summary: Upward movement toward 0.6560 is likely.
USDCAD Forecast – 29 August 2025
USDCAD has broken below 1.3780, progressing toward 1.3700. Once this target is reached, a corrective rebound to 1.3800 may occur, followed by a further decline toward 1.3650.
Technical outlook:
The Elliott Wave structure and bearish wave matrix with a pivot at 1.3800 support this view. Price is currently targeting the lower boundary of the Price Envelope near 1.3700, with a possible rebound to 1.3800, then resuming downward to 1.3650.
Indicator Summary: Expect decline to 1.3700, followed by a corrective bounce.

XAUUSD (Gold) Forecast – 29 August 2025
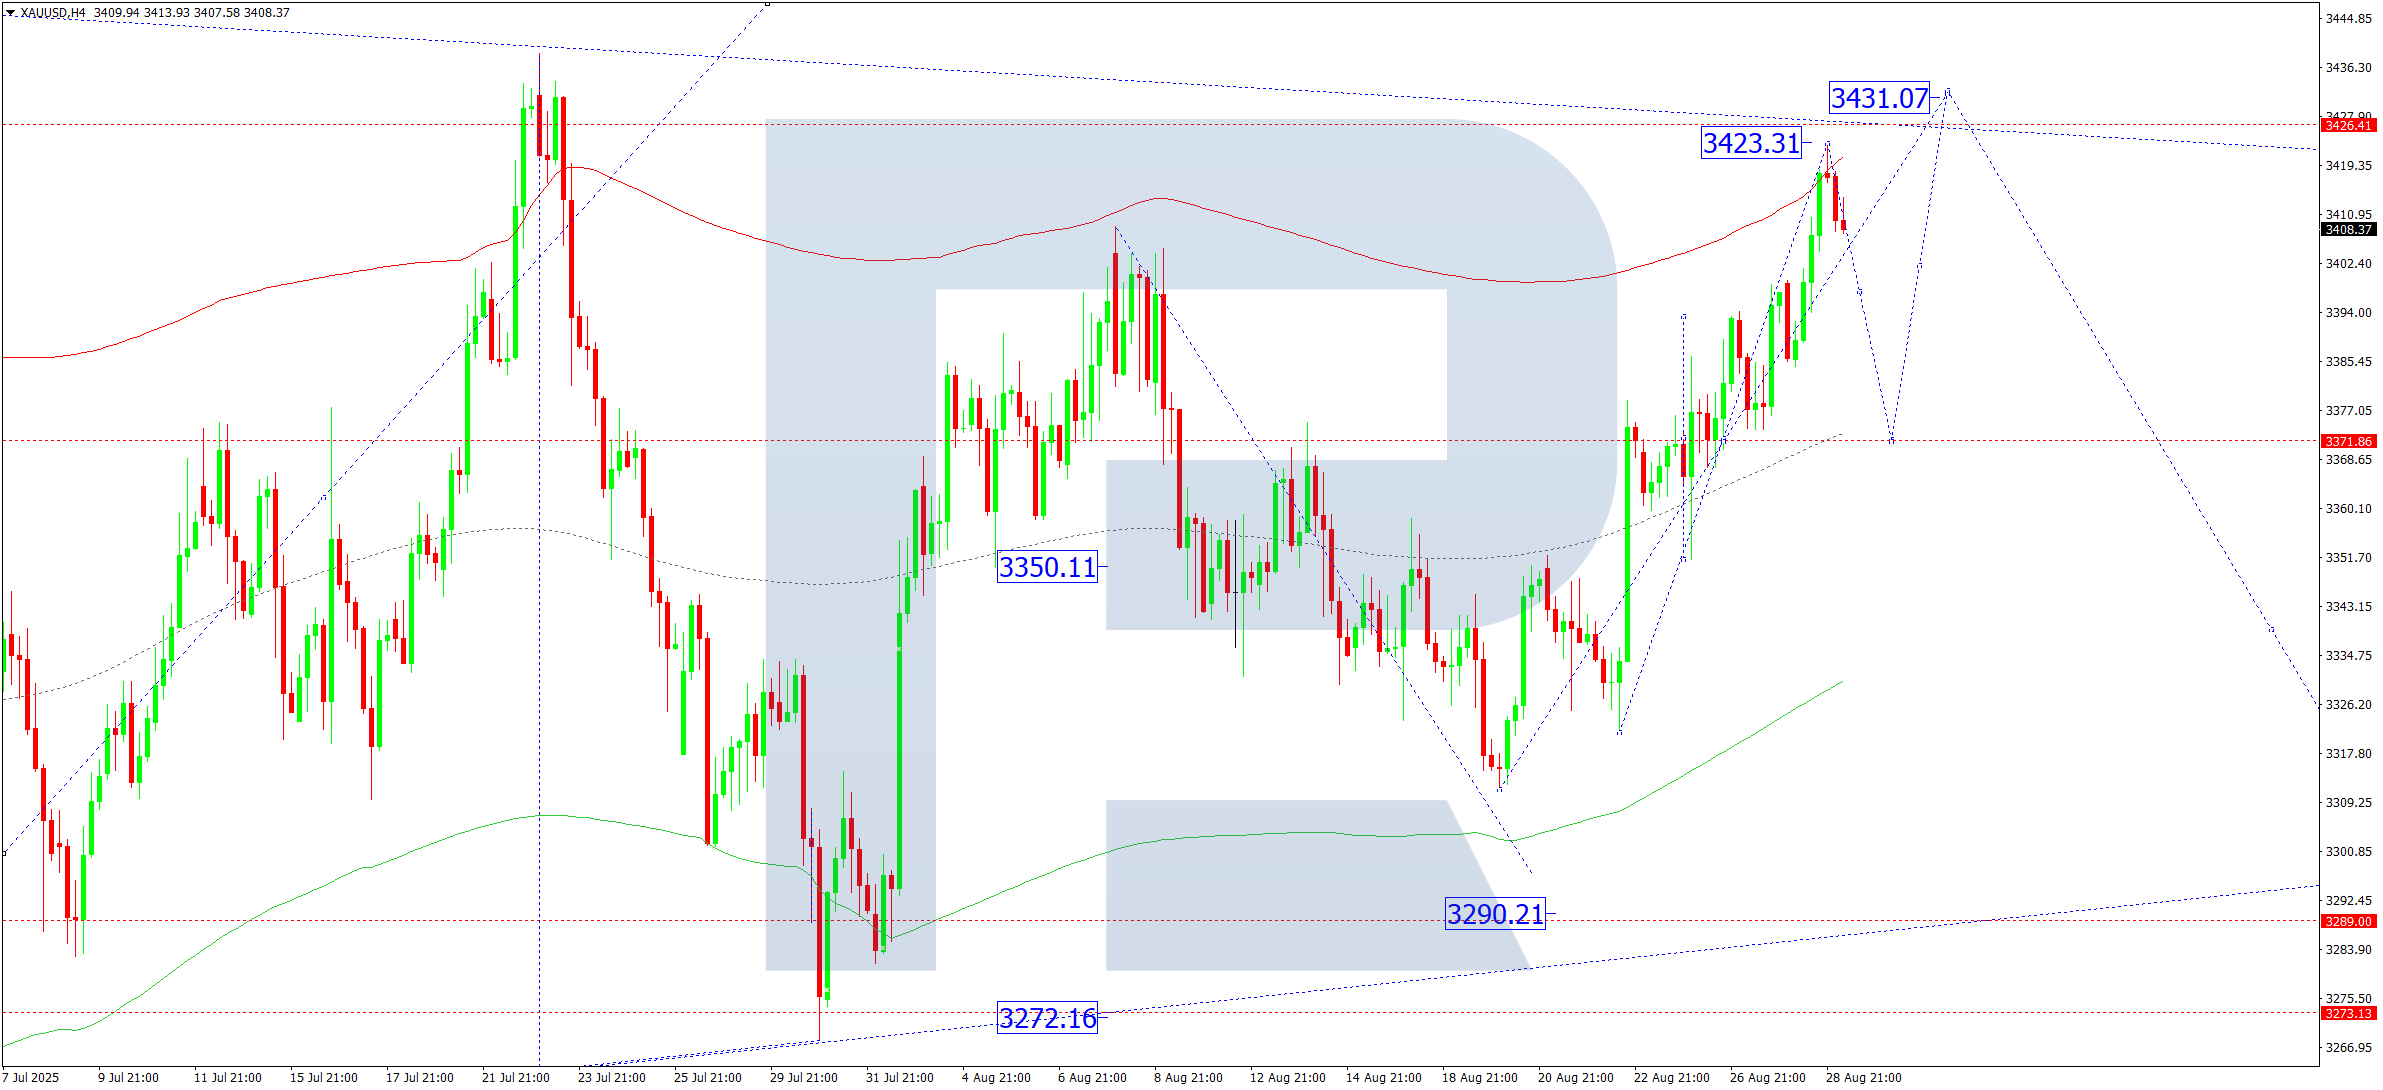
Gold completed a growth wave to $3,423 on the H4 chart. Today may see a correction to $3,370, followed by another upward movement to $3,431, likely exhausting the current rally. A subsequent decline to $3,290 is anticipated.
Technical outlook:
The Elliott Wave structure and bearish wave matrix pivoting around $3,350 support this forecast. The price recently reached the upper edge of the Price Envelope at $3,423 and is expected to pull back toward its central line at $3,371, with potential to drop further to $3,333.
Indicator Summary: Correction to $3,371 is likely.
Brent Crude Forecast – 29 August 2025
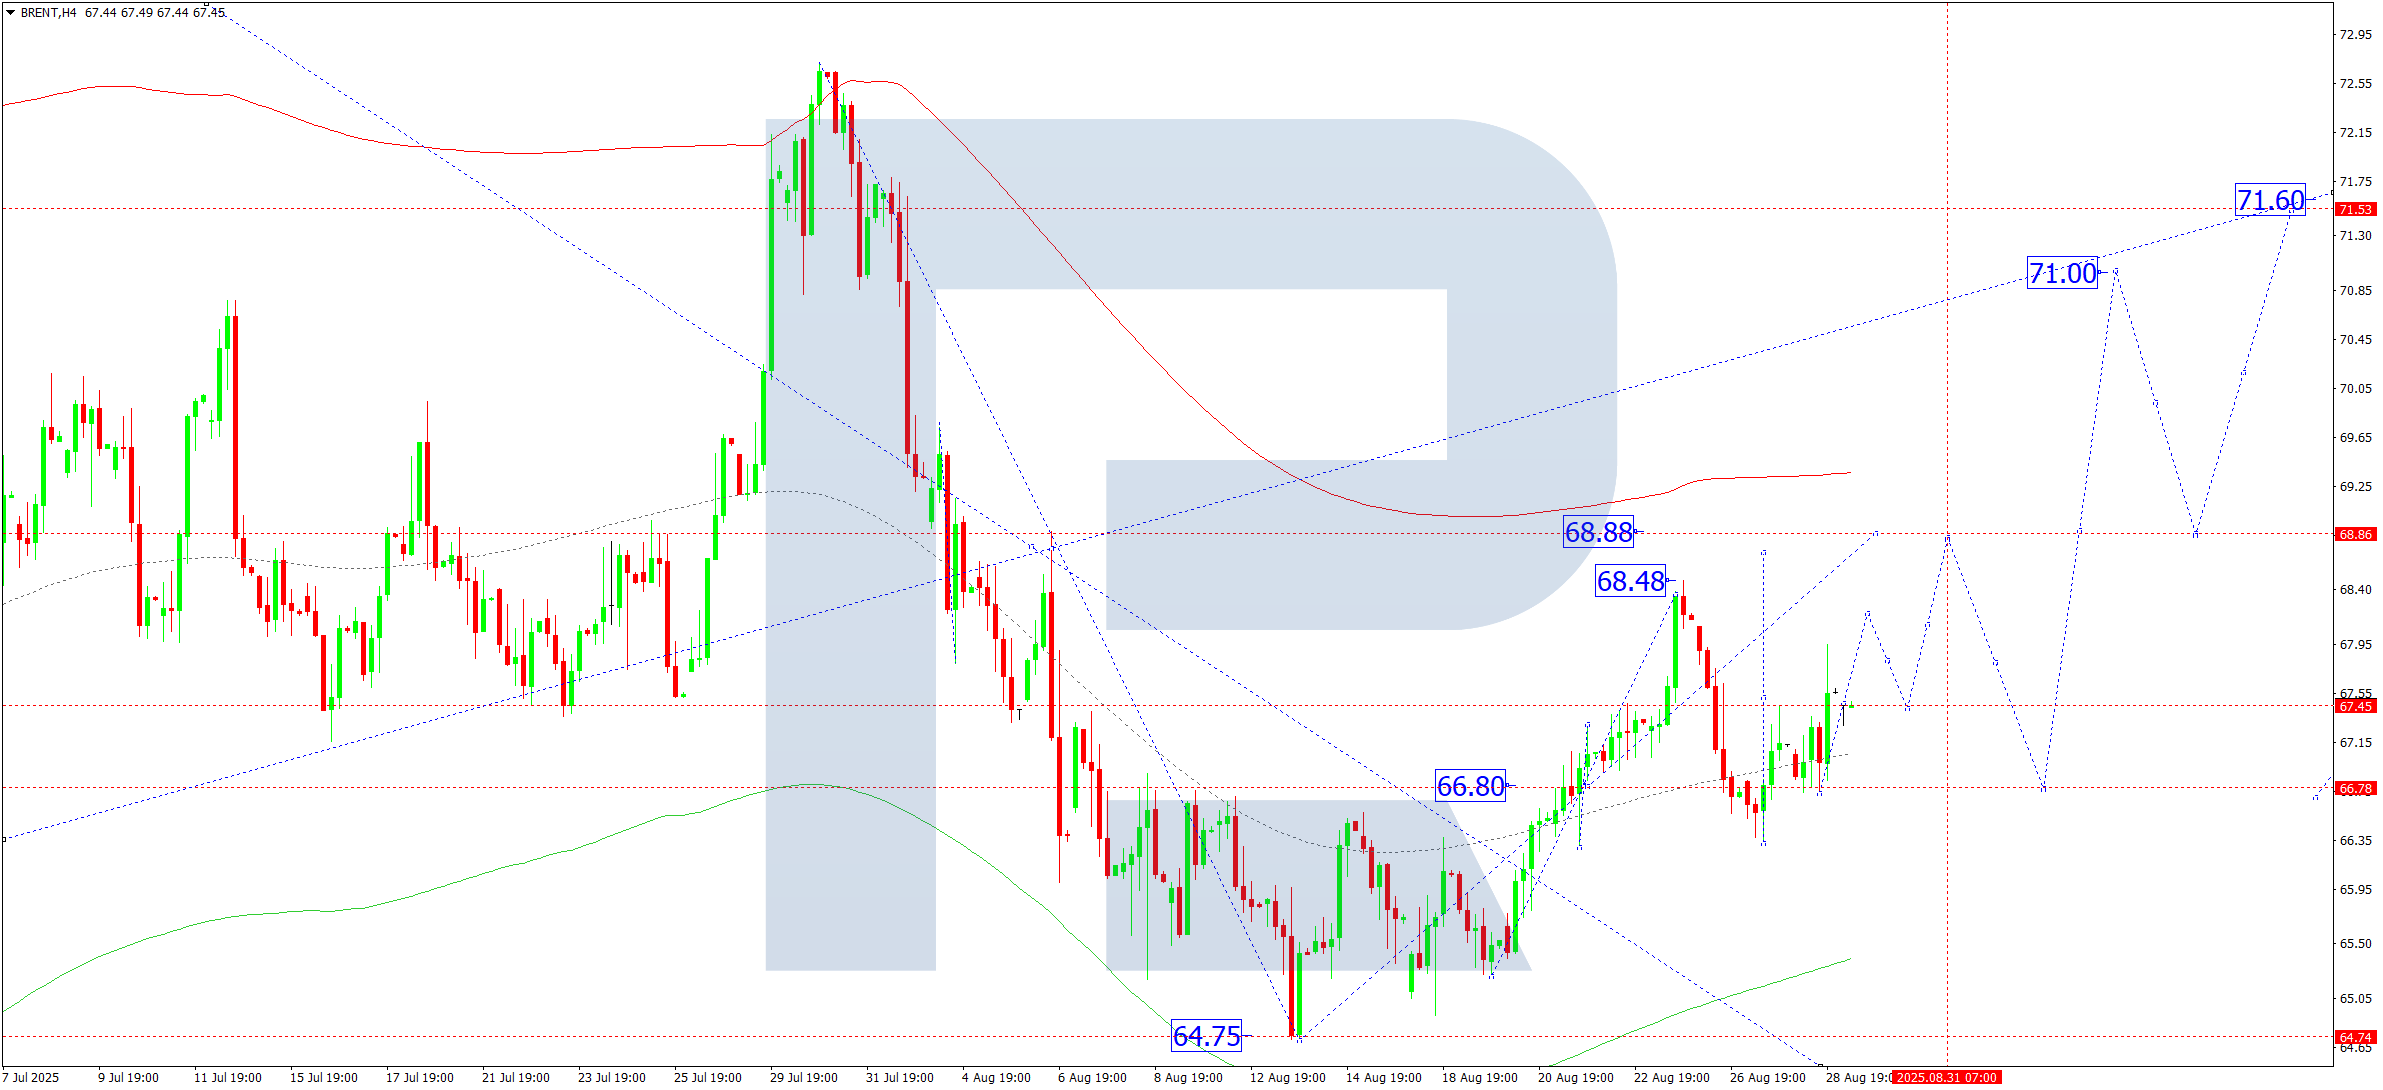
Brent broke above $67.45 and continues a bullish wave toward $68.88. This target may be reached today, followed by a correction to around $66.80.
Technical outlook:
The Elliott Wave structure and bullish matrix pivoting at $67.70 support this scenario. The price is currently heading toward the upper boundary of the Price Envelope near $68.88, with a possible correction to the central line around $66.60.
Indicator Summary: Upward movement to $68.88 is expected.
Disclaimer:
Past trading performance does not guarantee future results. Always conduct your own research or consult a financial advisor before making trading decisions.
Leave a Reply