
Daily technical analysis and forecast for 25 September 2025
EURUSD Forecast
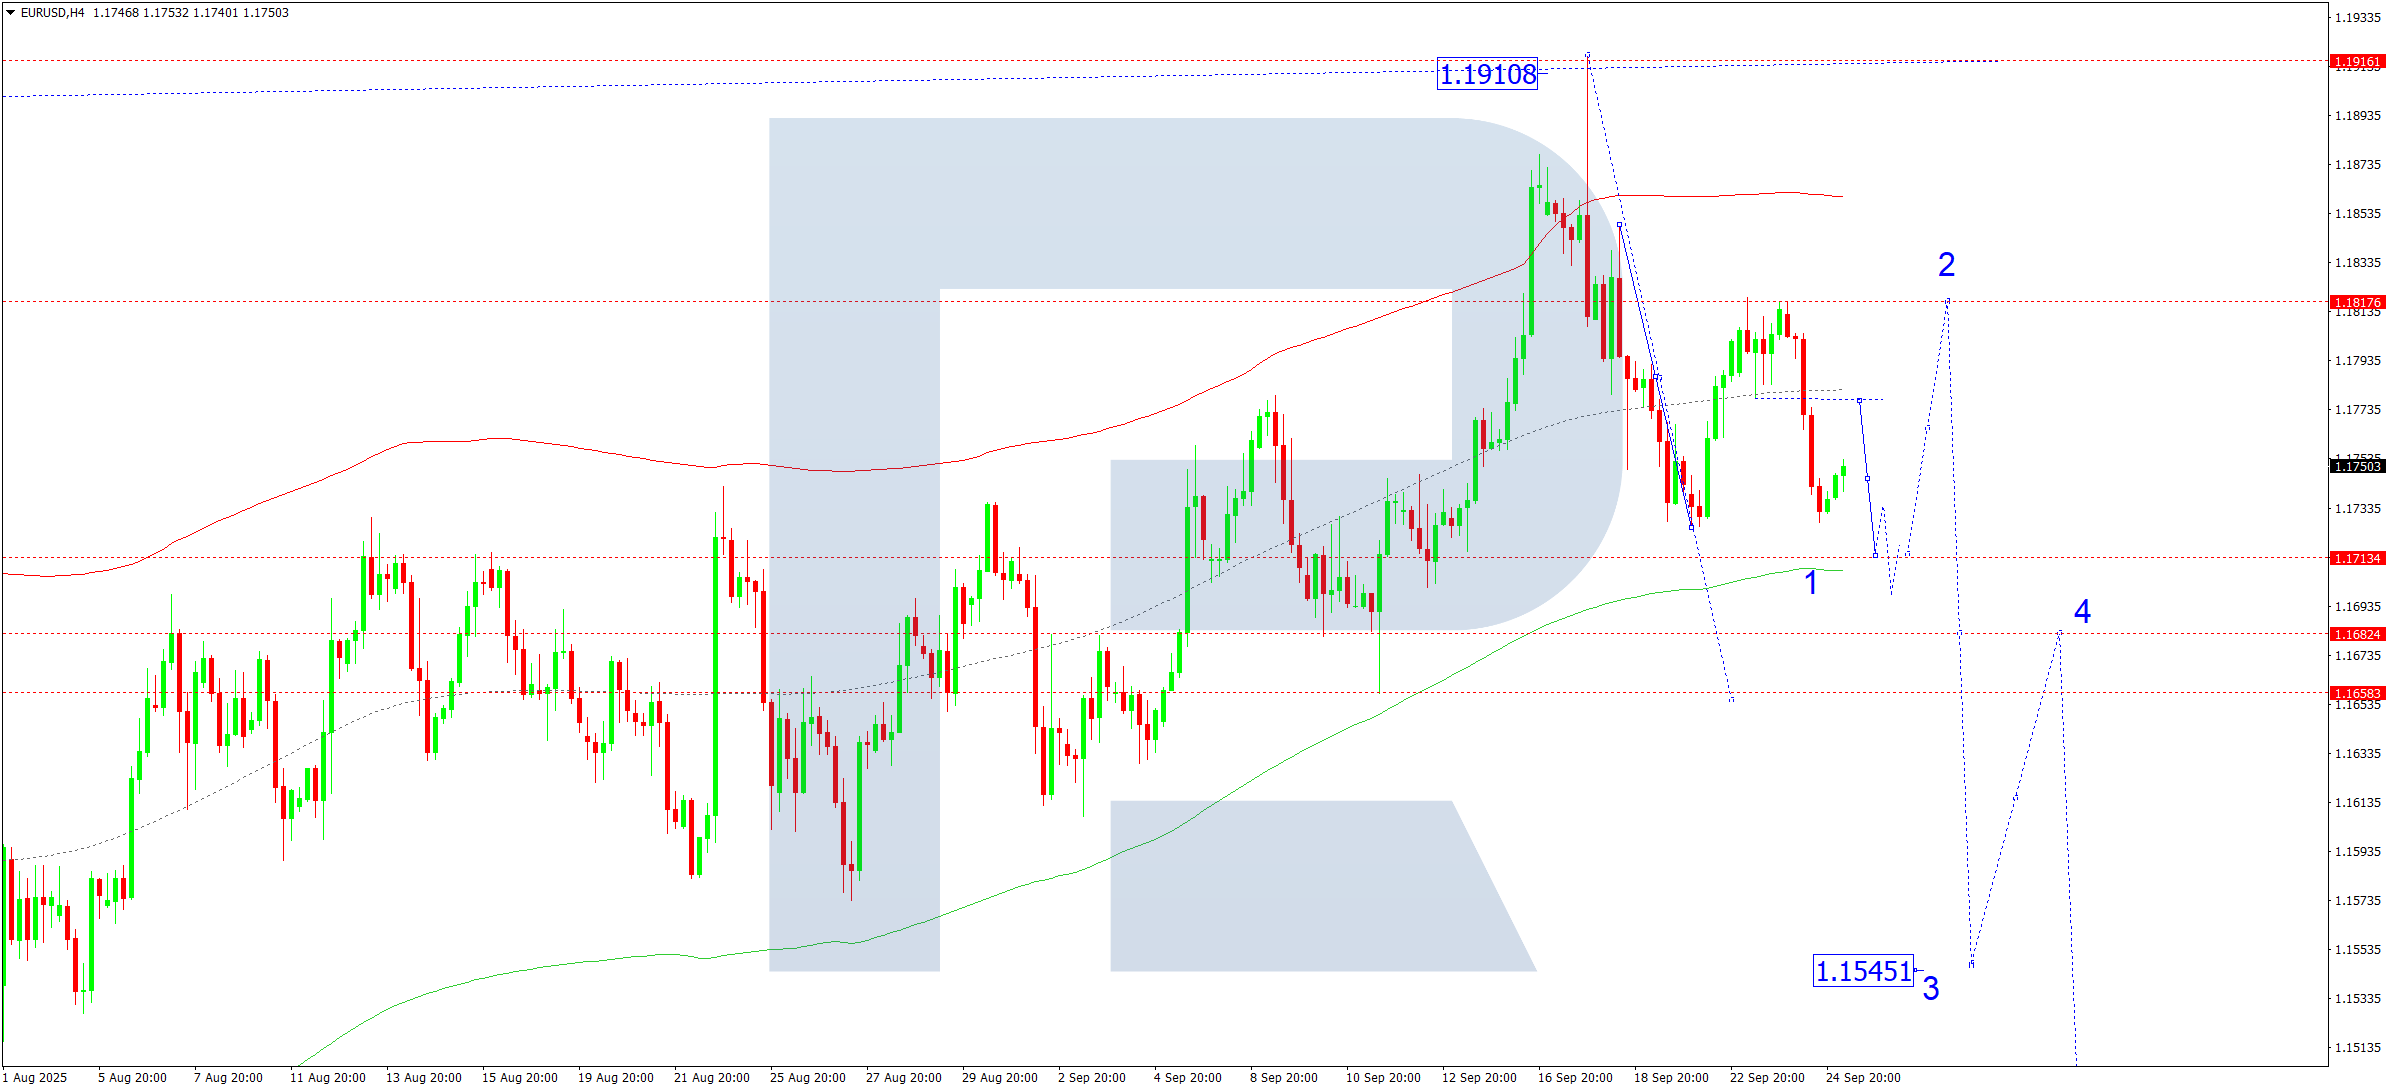
On the H4 chart, EURUSD formed a consolidation range below 1.1818 and broke down to 1.1727. For today, a corrective move upwards to 1.1777 is expected (to test the breakout level from below). After this, the pair may continue its decline towards 1.1714, which could serve as a consolidation zone. A breakdown from this level may extend the downward trend toward 1.1660.
This outlook aligns with the Elliott Wave structure, highlighting 1.1787 as the key pivot. The price is currently near a local target for the decline. A short-term rebound to the Price Envelope’s midline (1.1777) is expected before a move to the lower boundary at 1.1714.
Technical bias: Bearish towards 1.1714
USDJPY Forecast
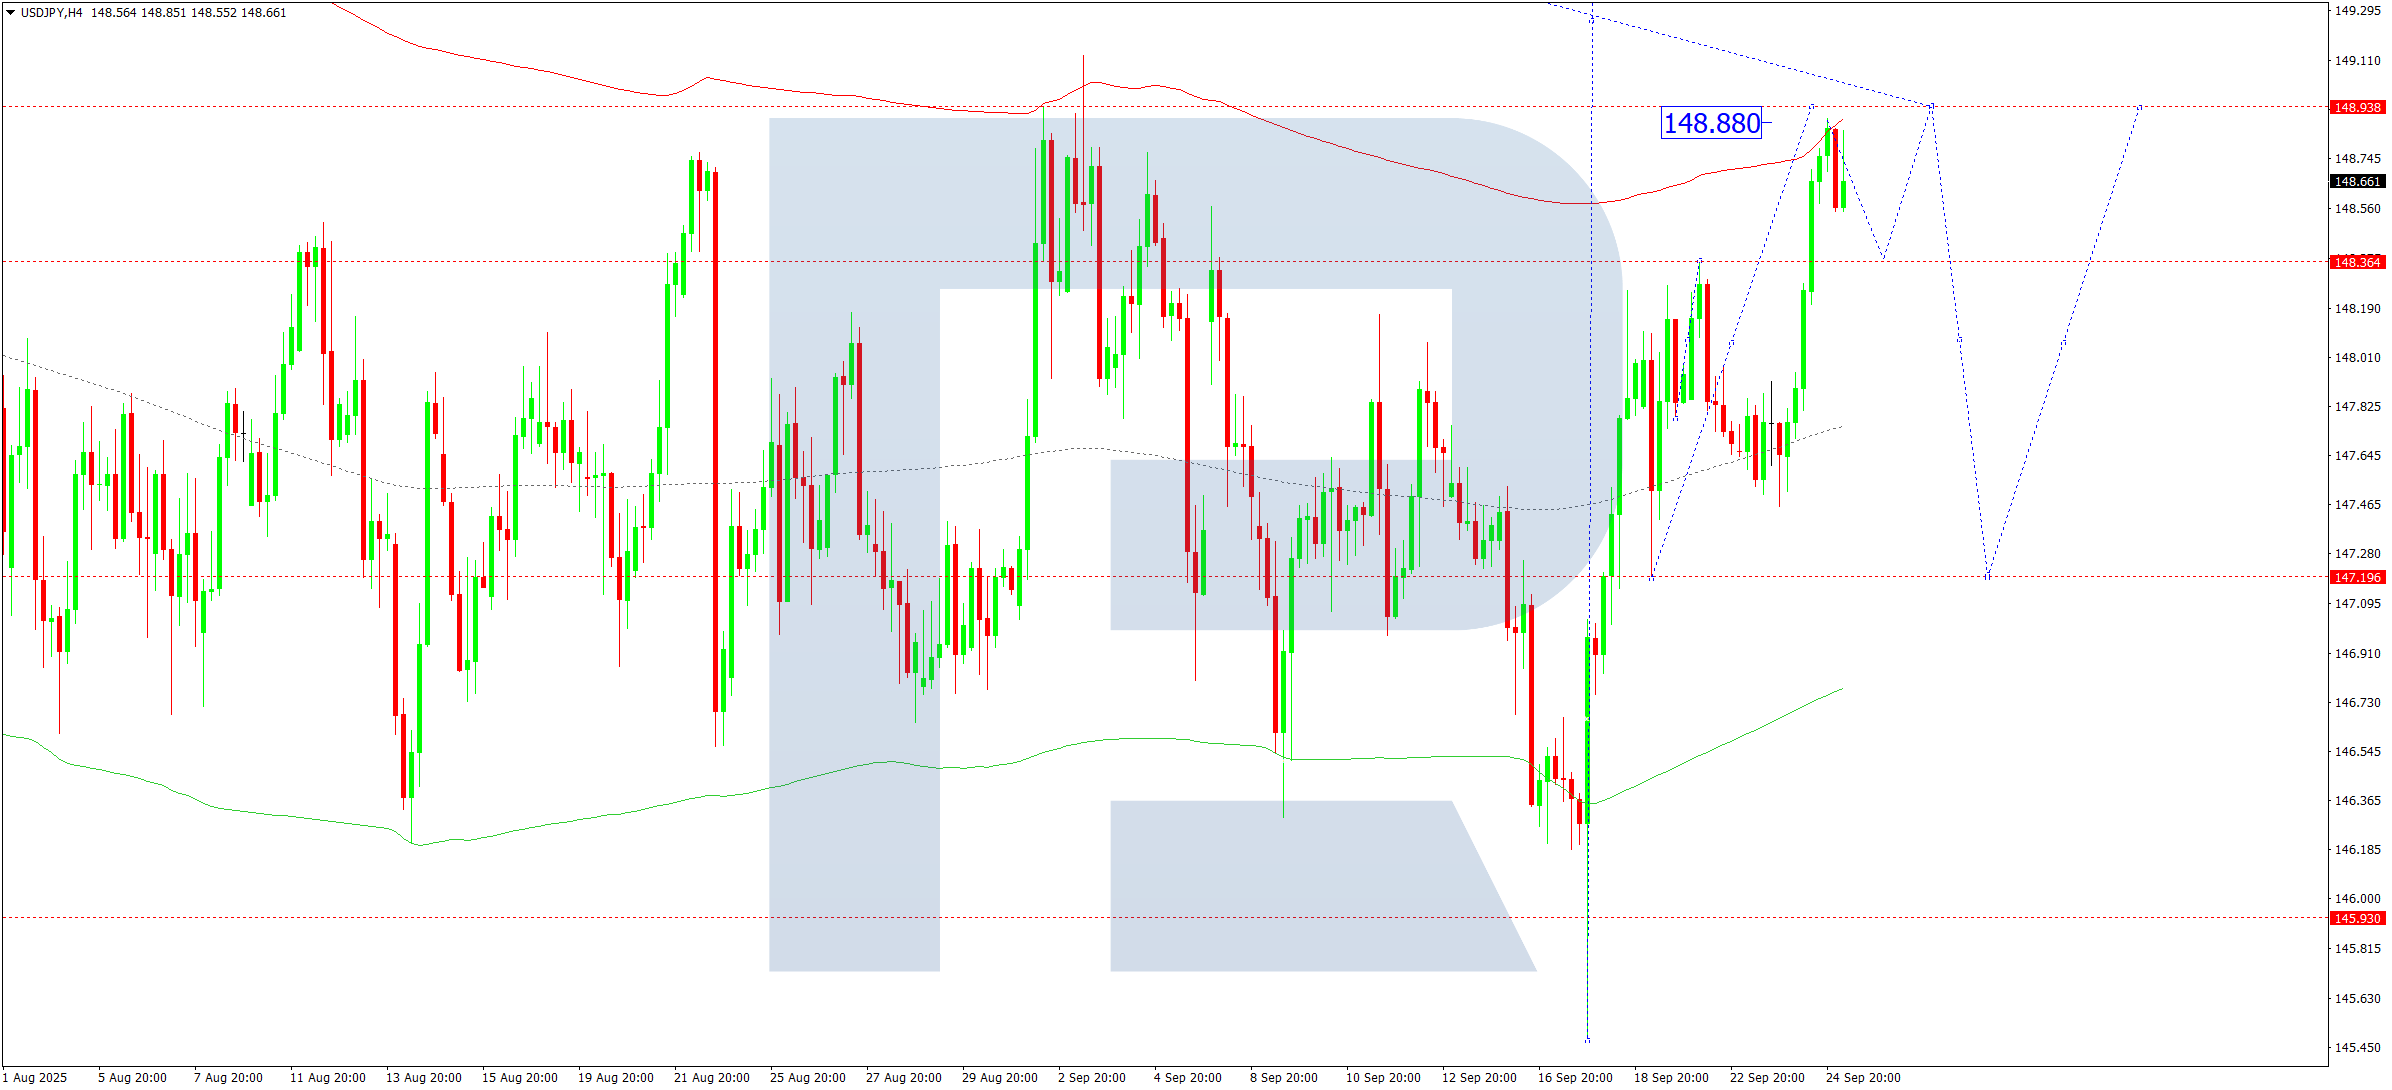
On the H4 chart, USDJPY has reached the local wave target at 148.88 and is currently consolidating below it. If the price breaks lower, a pullback to 148.33 is likely. A breakout upward could extend the rally to 148.94 before a broader correction to 147.20.
This aligns with the Elliott Wave count, where 147.20 is seen as the key pivot. The pair is at the upper edge of the Price Envelope, and a retracement to the center line at 147.20 appears likely.
Technical bias: Corrective move expected to 147.20
GBPUSD Forecast
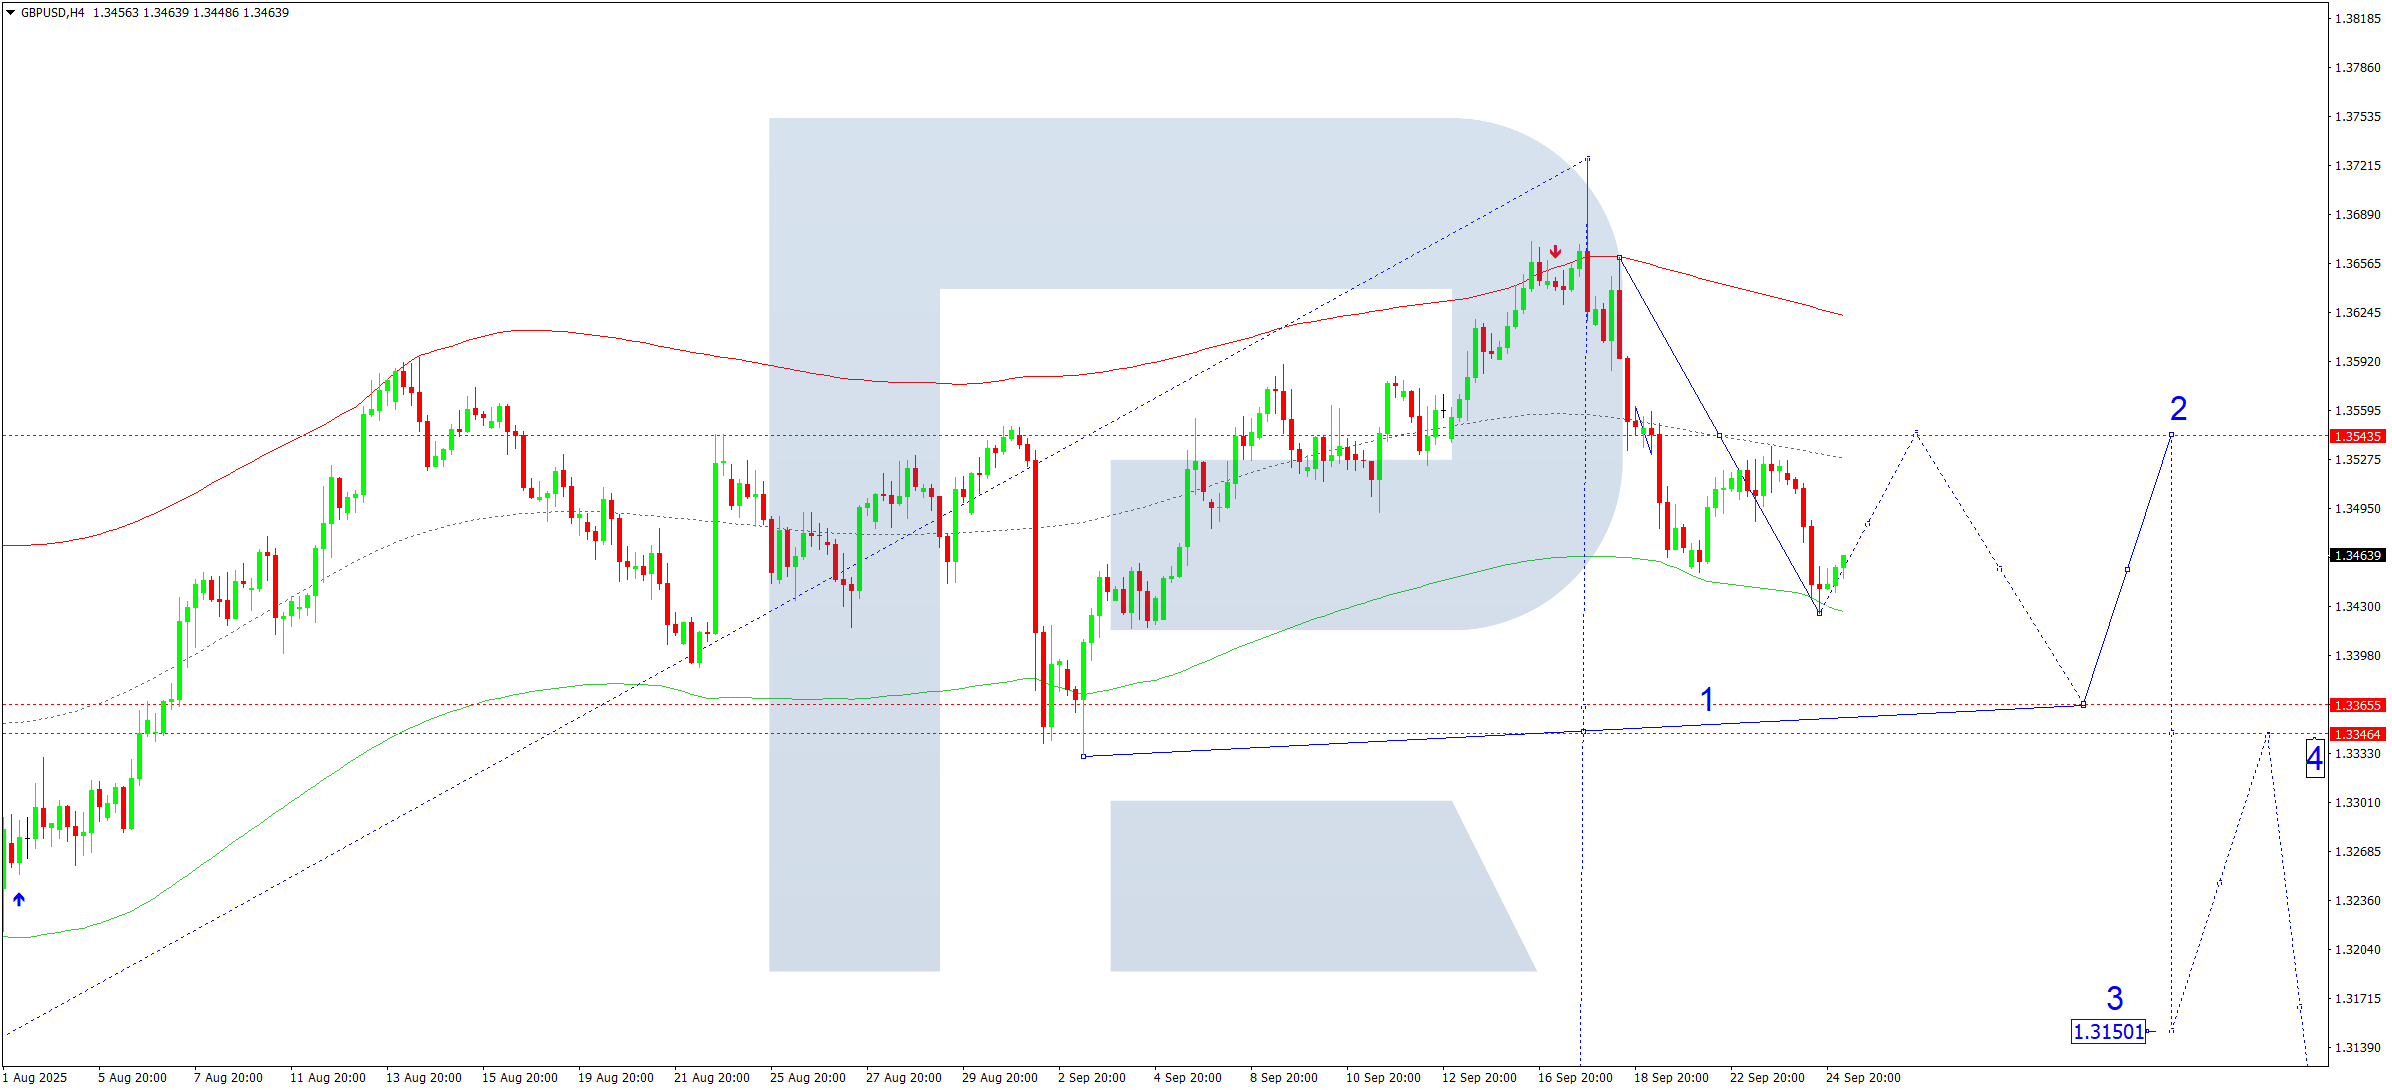
On the H4 chart, GBPUSD reached a local target at 1.3427 and is now consolidating above this level. A move higher may initiate a correction towards 1.3485, potentially extending to 1.3545, before resuming a downward move to 1.3366. Alternatively, a direct breakdown may lead straight to 1.3366.
The Elliott Wave setup supports this scenario, with 1.3545 marked as the key pivot. The pair currently trades near the lower boundary of the Price Envelope, suggesting a near-term corrective bounce is probable.
Technical bias: Correction toward 1.3545, followed by decline
AUDUSD Forecast
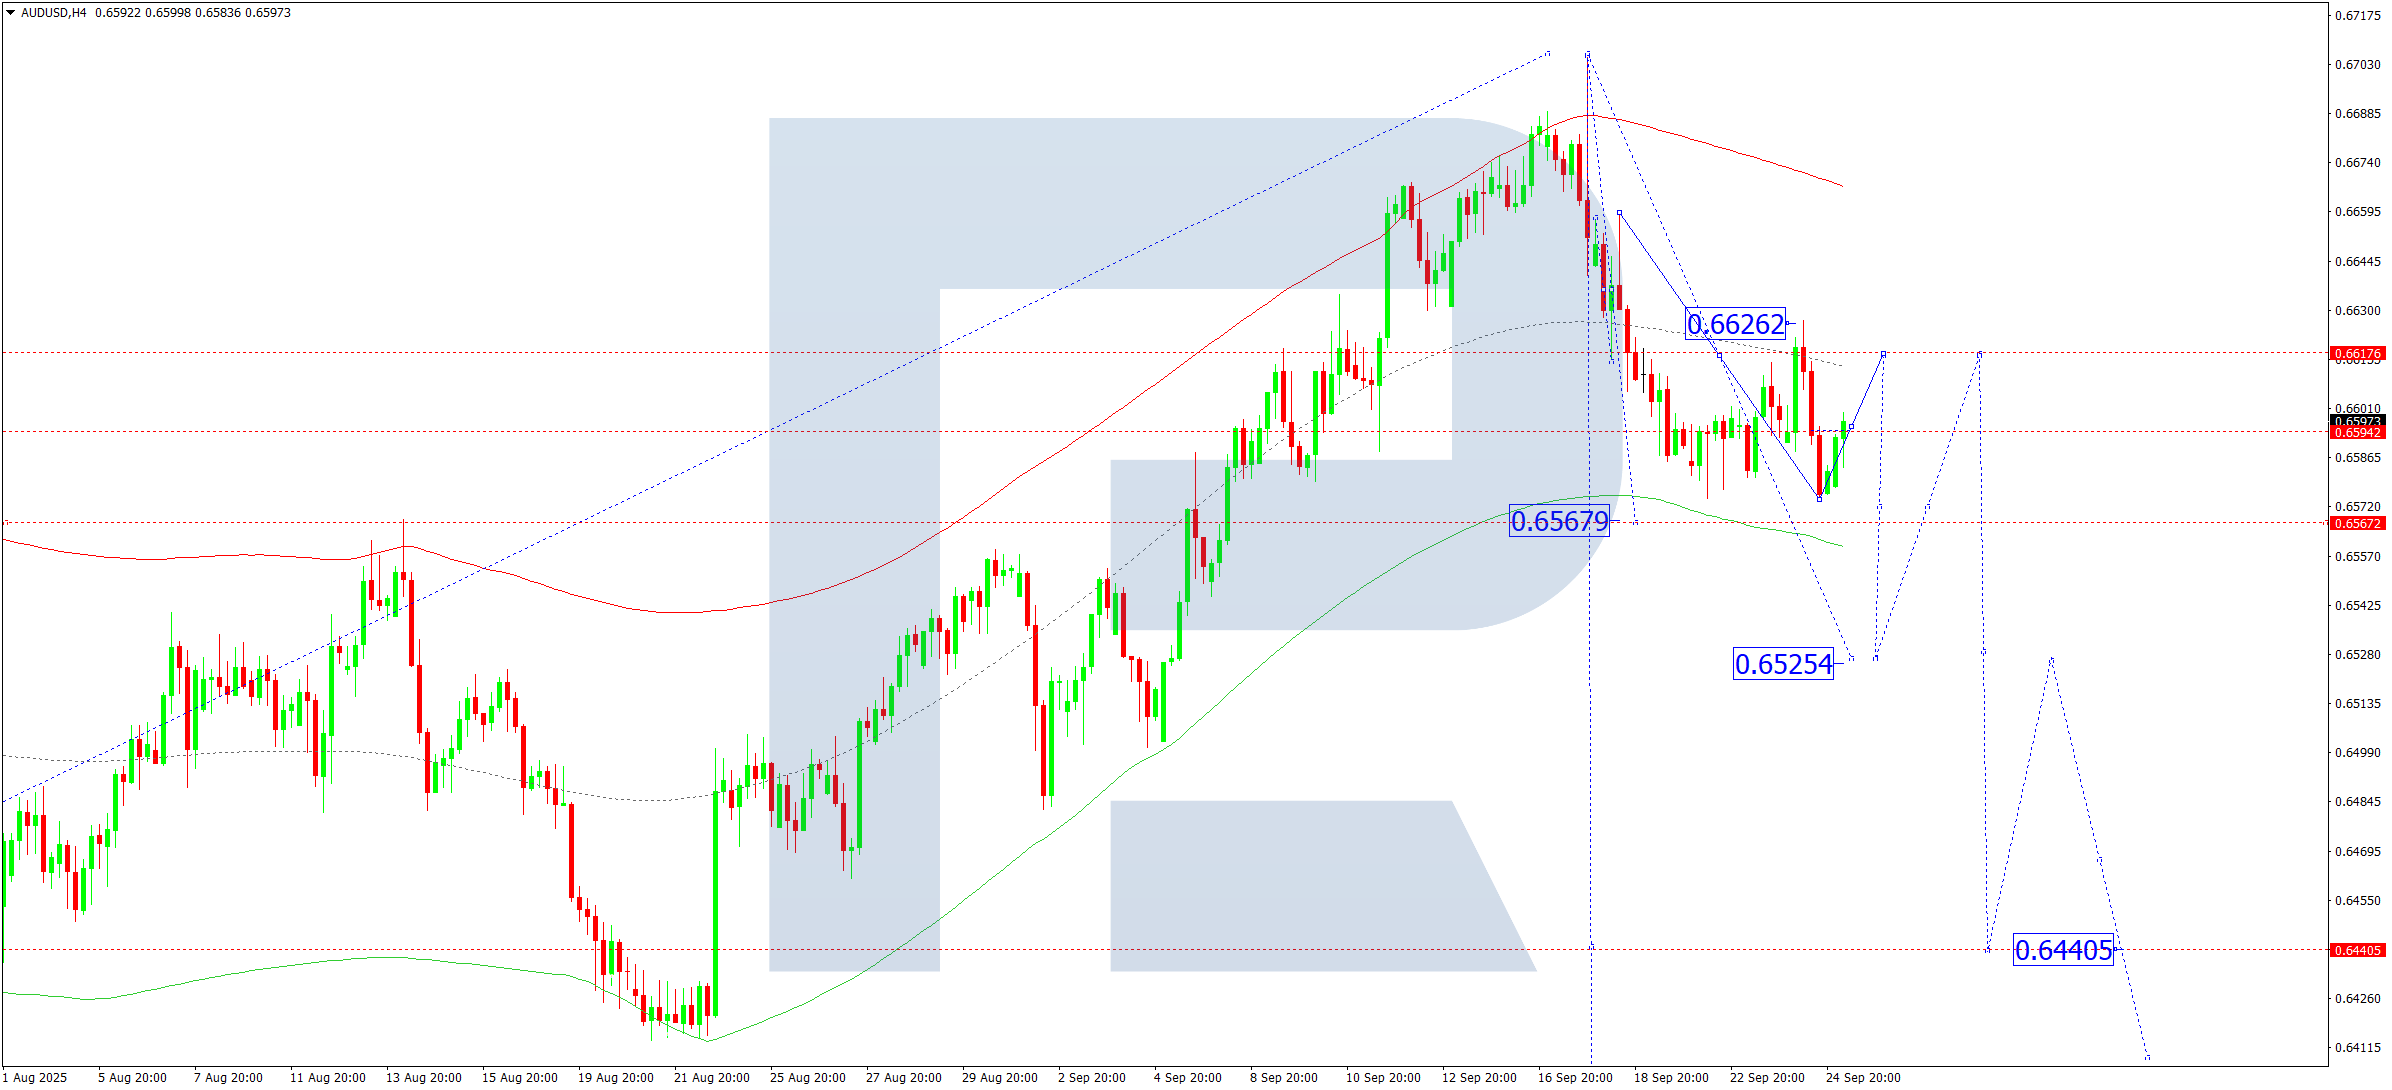
On the H4 chart, AUDUSD is trading in a wide consolidation range around 0.6594. An intraday move up to 0.6616 is possible, followed by a decline to 0.6567. A break below this level could lead to an extended drop towards 0.6525.
This scenario is backed by Elliott Wave analysis, with 0.6617 identified as the critical pivot level. The pair is drifting toward the lower band of the Price Envelope at 0.6567, with a corrective bounce to 0.6635 seen as a potential move thereafter.
Technical bias: Bearish towards 0.6567
USDCAD Forecast
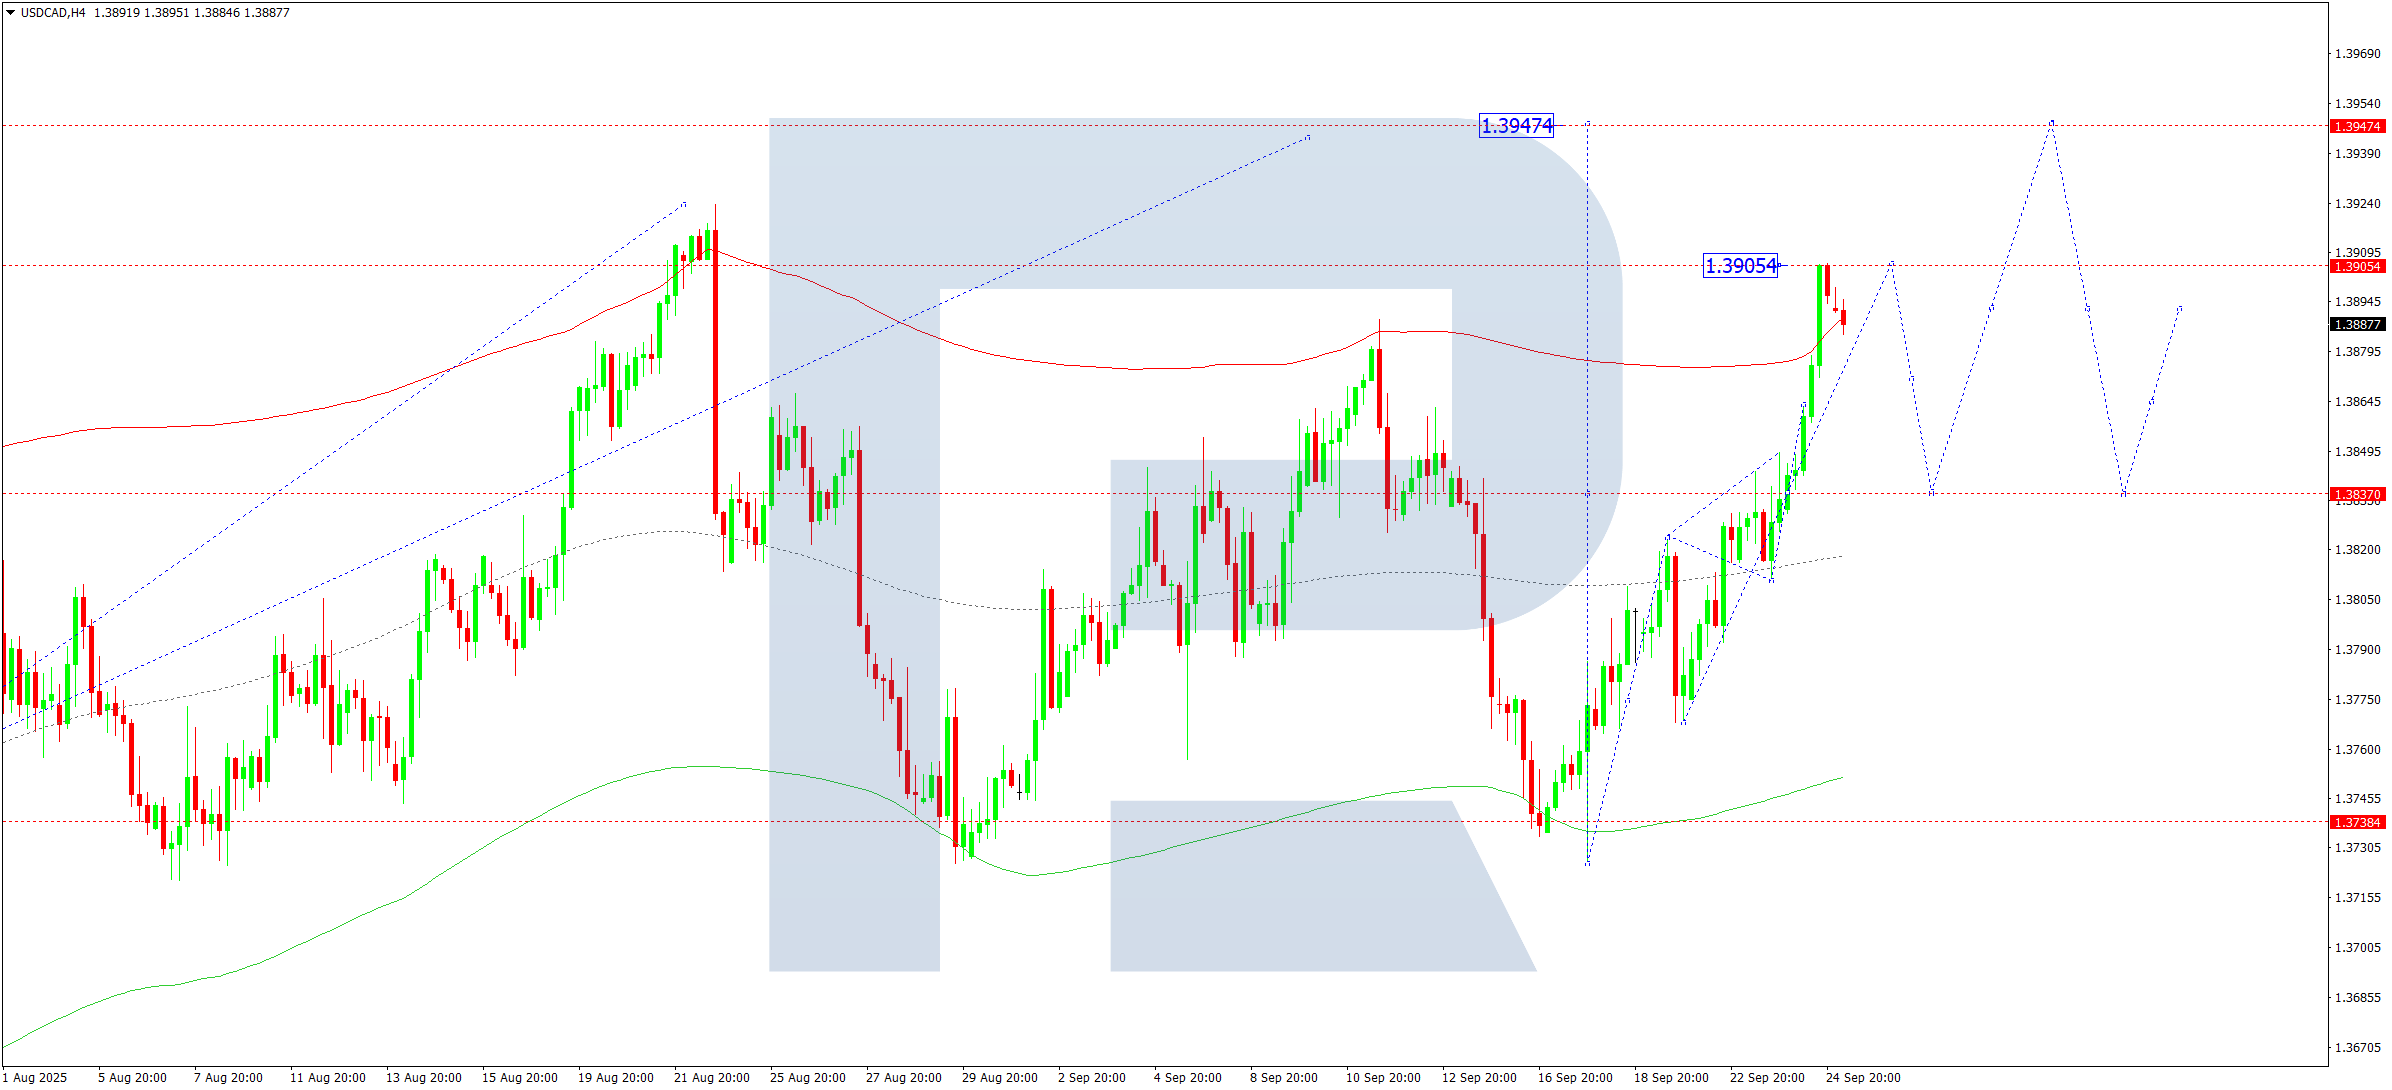
On the H4 chart, USDCAD has reached 1.3905 and is now consolidating. A downward breakout may initiate a correction to 1.3838, which could be followed by a fresh upward leg targeting 1.3947.
The Elliott Wave structure supports further upside, with 1.3838 serving as the key pivot. The market is currently near the upper band of the Price Envelope, indicating a potential retest of the midline at 1.3838 before resuming the upward move.
Technical bias: Pullback to 1.3838 before another rise
XAUUSD (Gold) Forecast
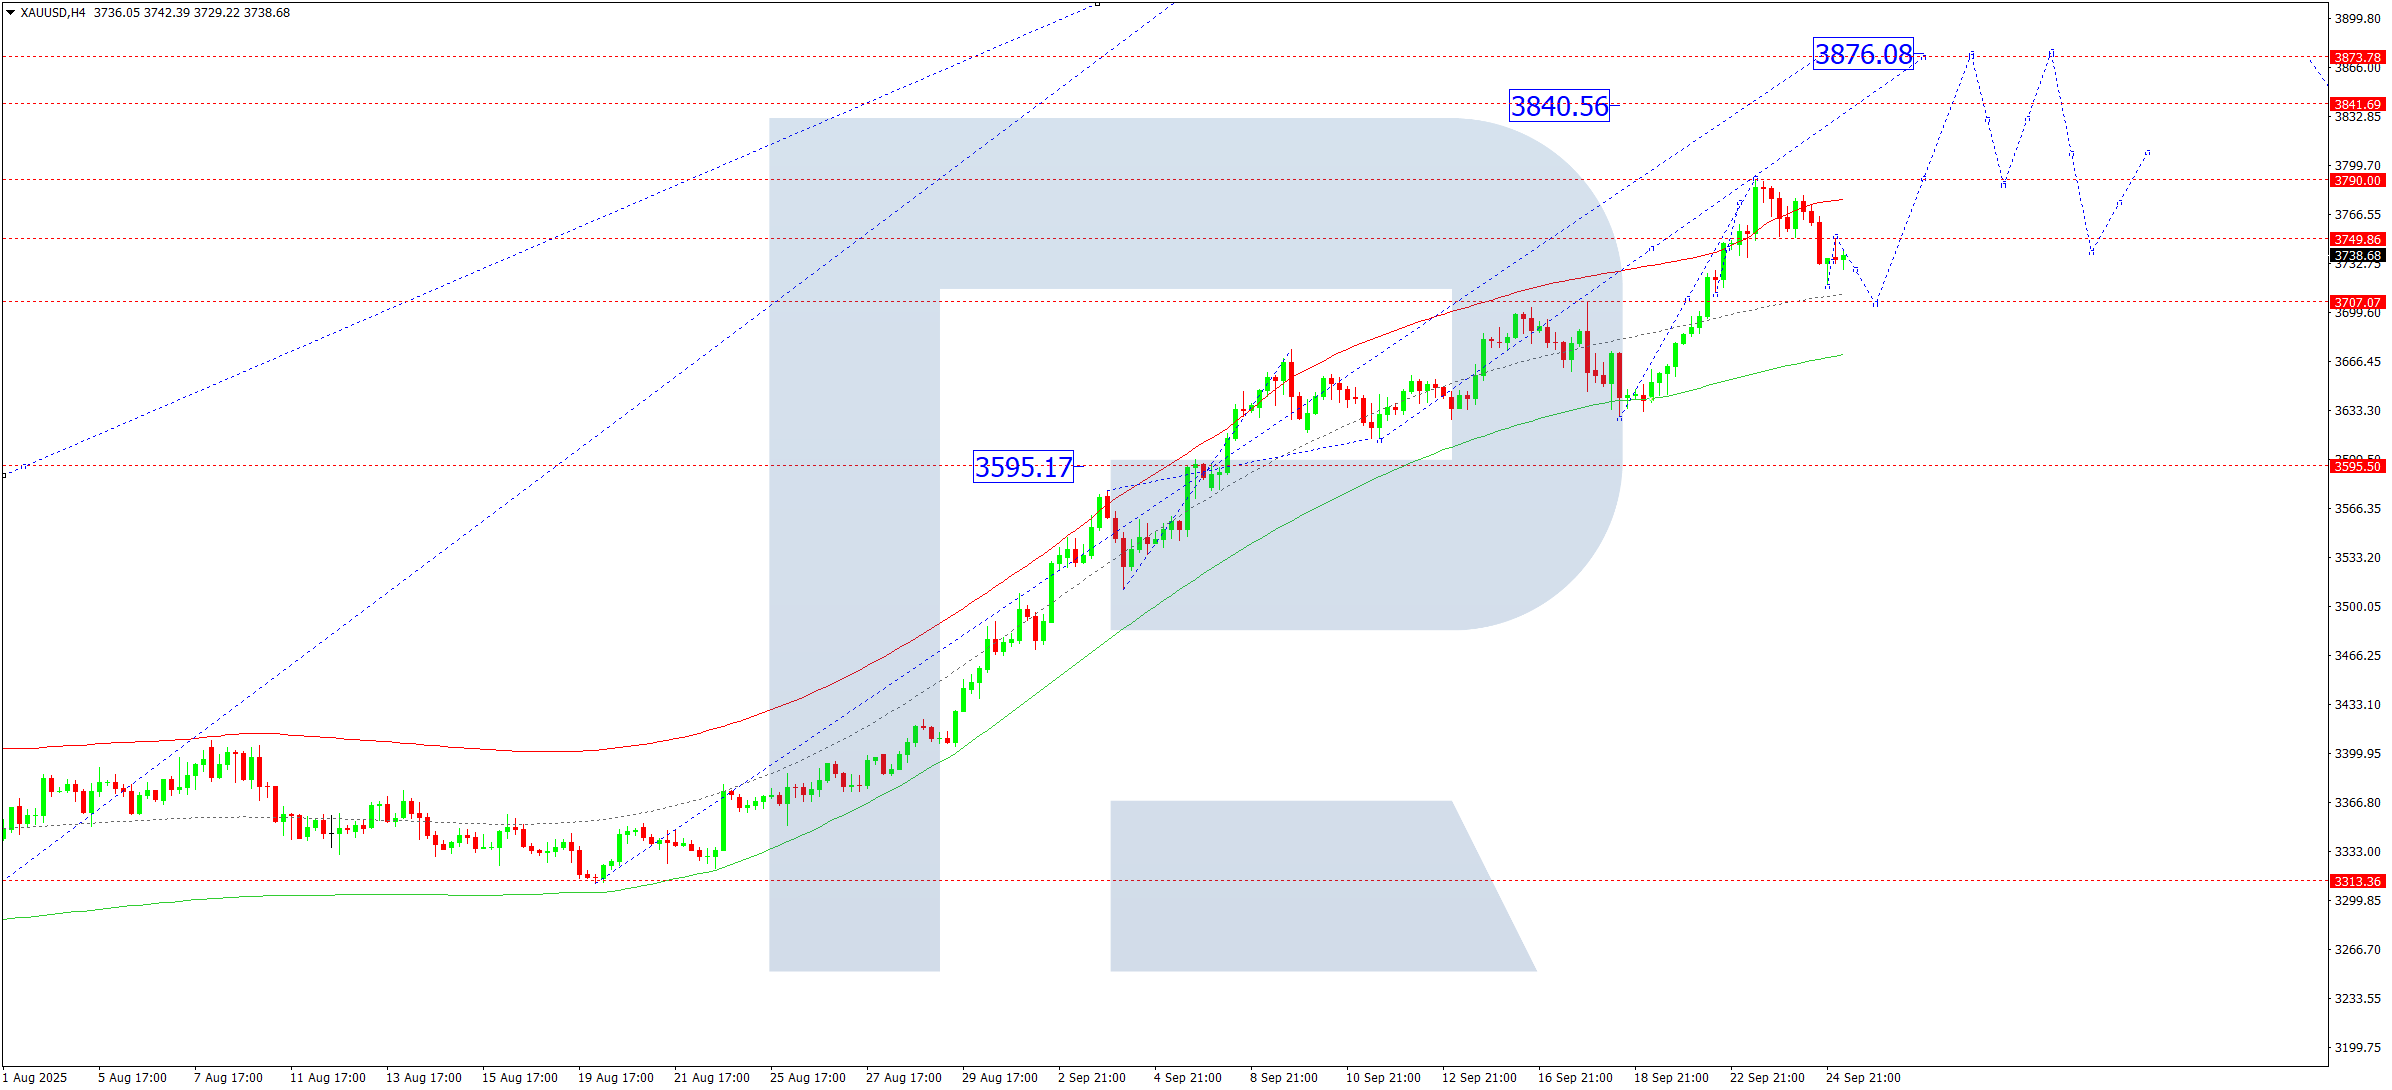
On the H4 chart, Gold hit 3,777 and, after breaching 3,750, completed a correction to 3,718. Currently, the price has retested 3,750 from below and may decline to 3,707. Following this, a new upward wave to 3,790 could unfold, and if broken, the trend may extend to 3,840.
According to Elliott Wave principles, 3,595 remains the primary pivot for the ongoing bullish wave. Price is correcting toward the midline of the Price Envelope at 3,707, with expectations of resuming growth to the upper boundary at 3,790.
Technical bias: Correction to 3,707, then bullish toward 3,790
Brent Crude Oil Forecast
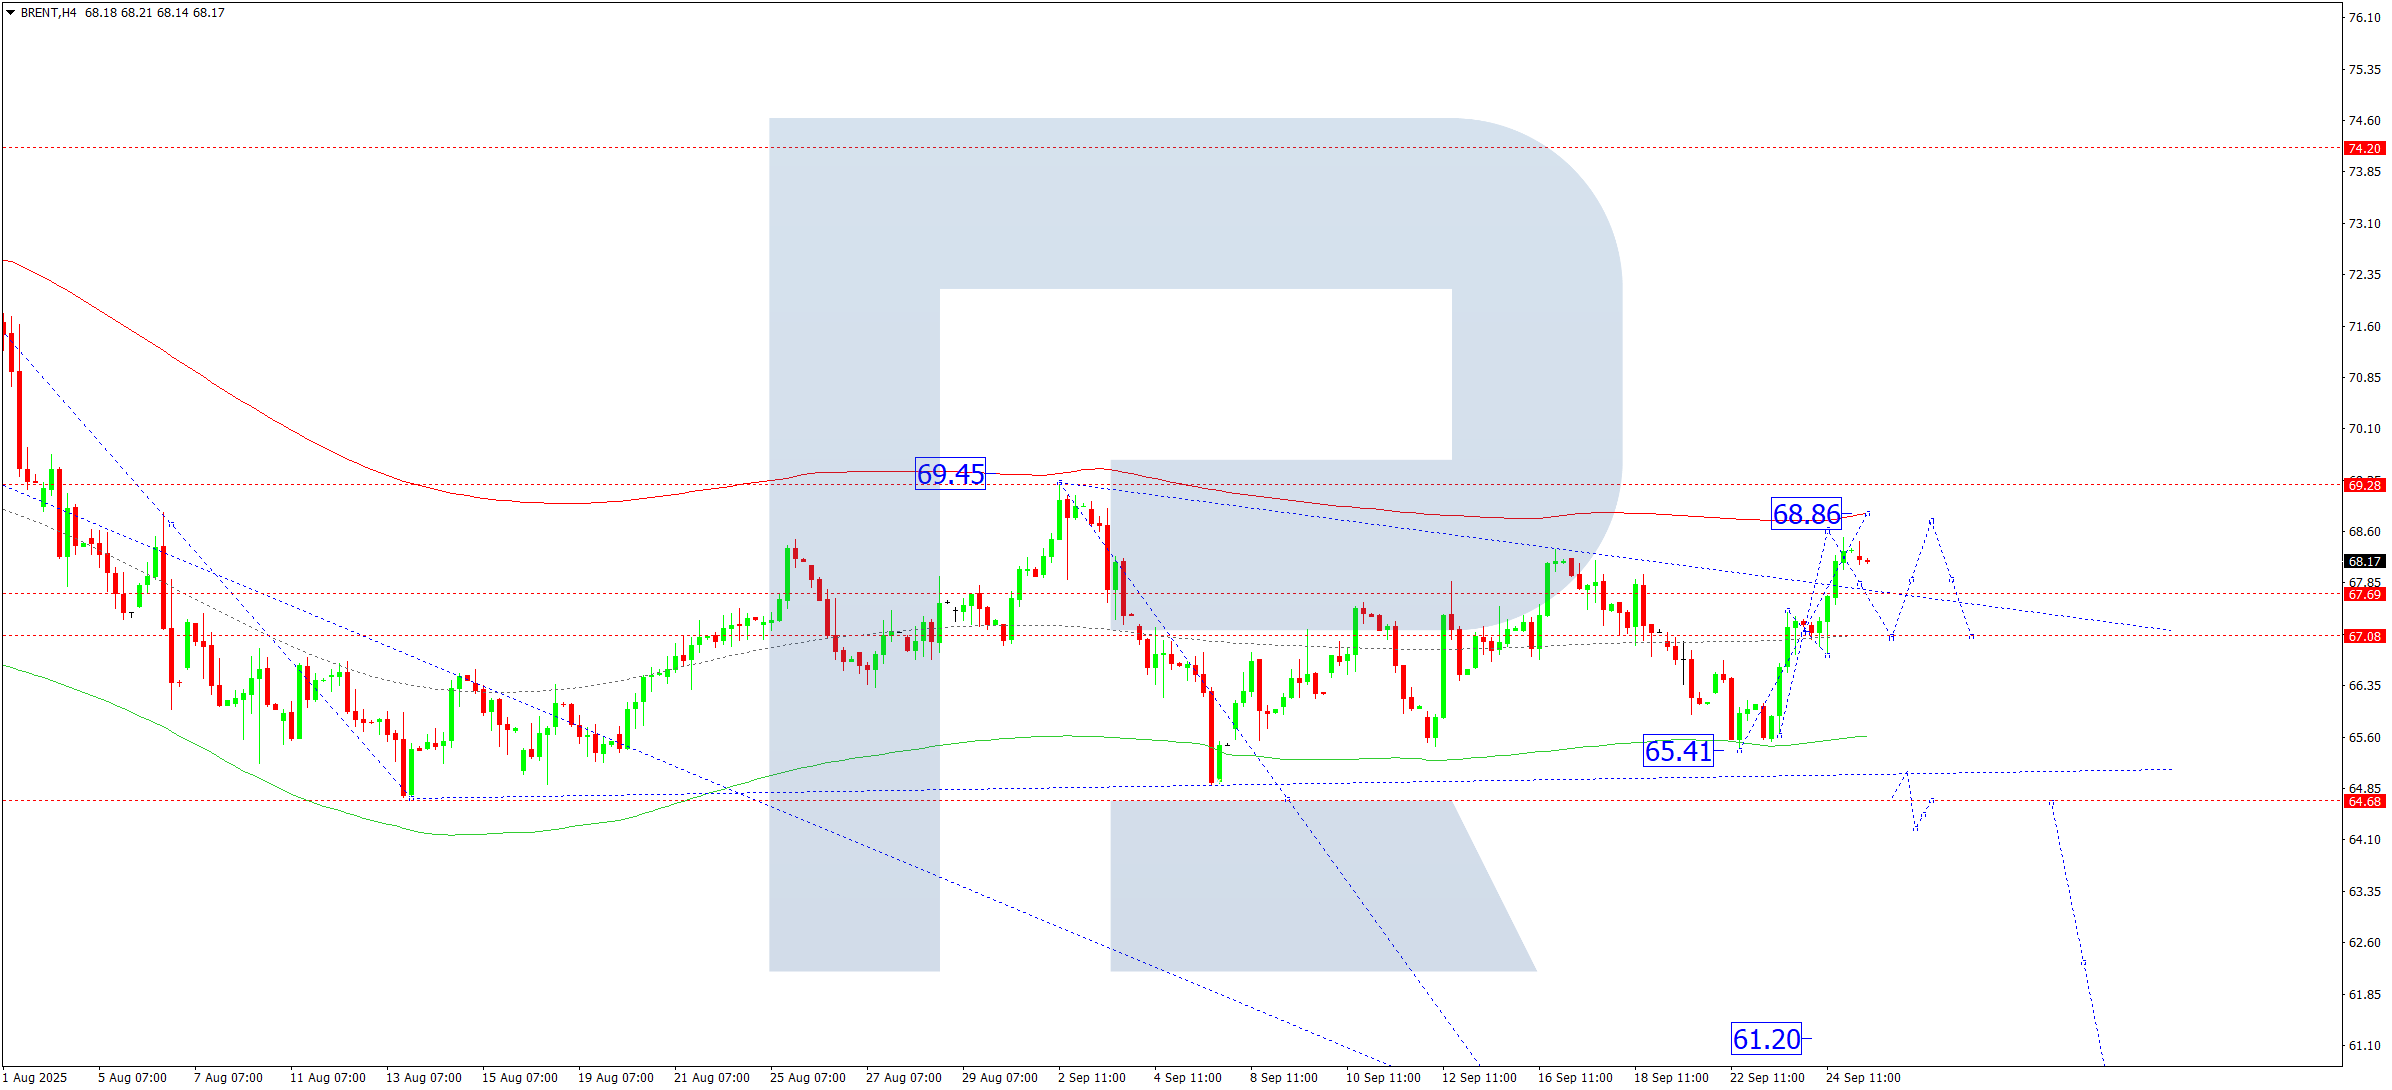
On the H4 chart, Brent has reached 68.50 and is consolidating below this resistance. A breakout lower could send prices to 67.10, while an upward breakout may push the wave to 68.60, and possibly to 68.86.
The Elliott Wave pattern confirms an uptrend structure, with 67.10 as the pivotal level. Brent is nearing the upper boundary of the Price Envelope at 68.86, suggesting possible continuation of the trend before a correction to 67.10.
Technical bias: Continued upside toward 68.86
Risk Disclaimer:
Past performance is not indicative of future results. Technical forecasts are based on historical price data and pattern analysis and should not be considered investment advice. Always manage risk appropriately and consult with a licensed financial advisor.
Leave a Reply