
Daily Technical Analysis and Forecast – 9 October 2025
EURUSD Forecast
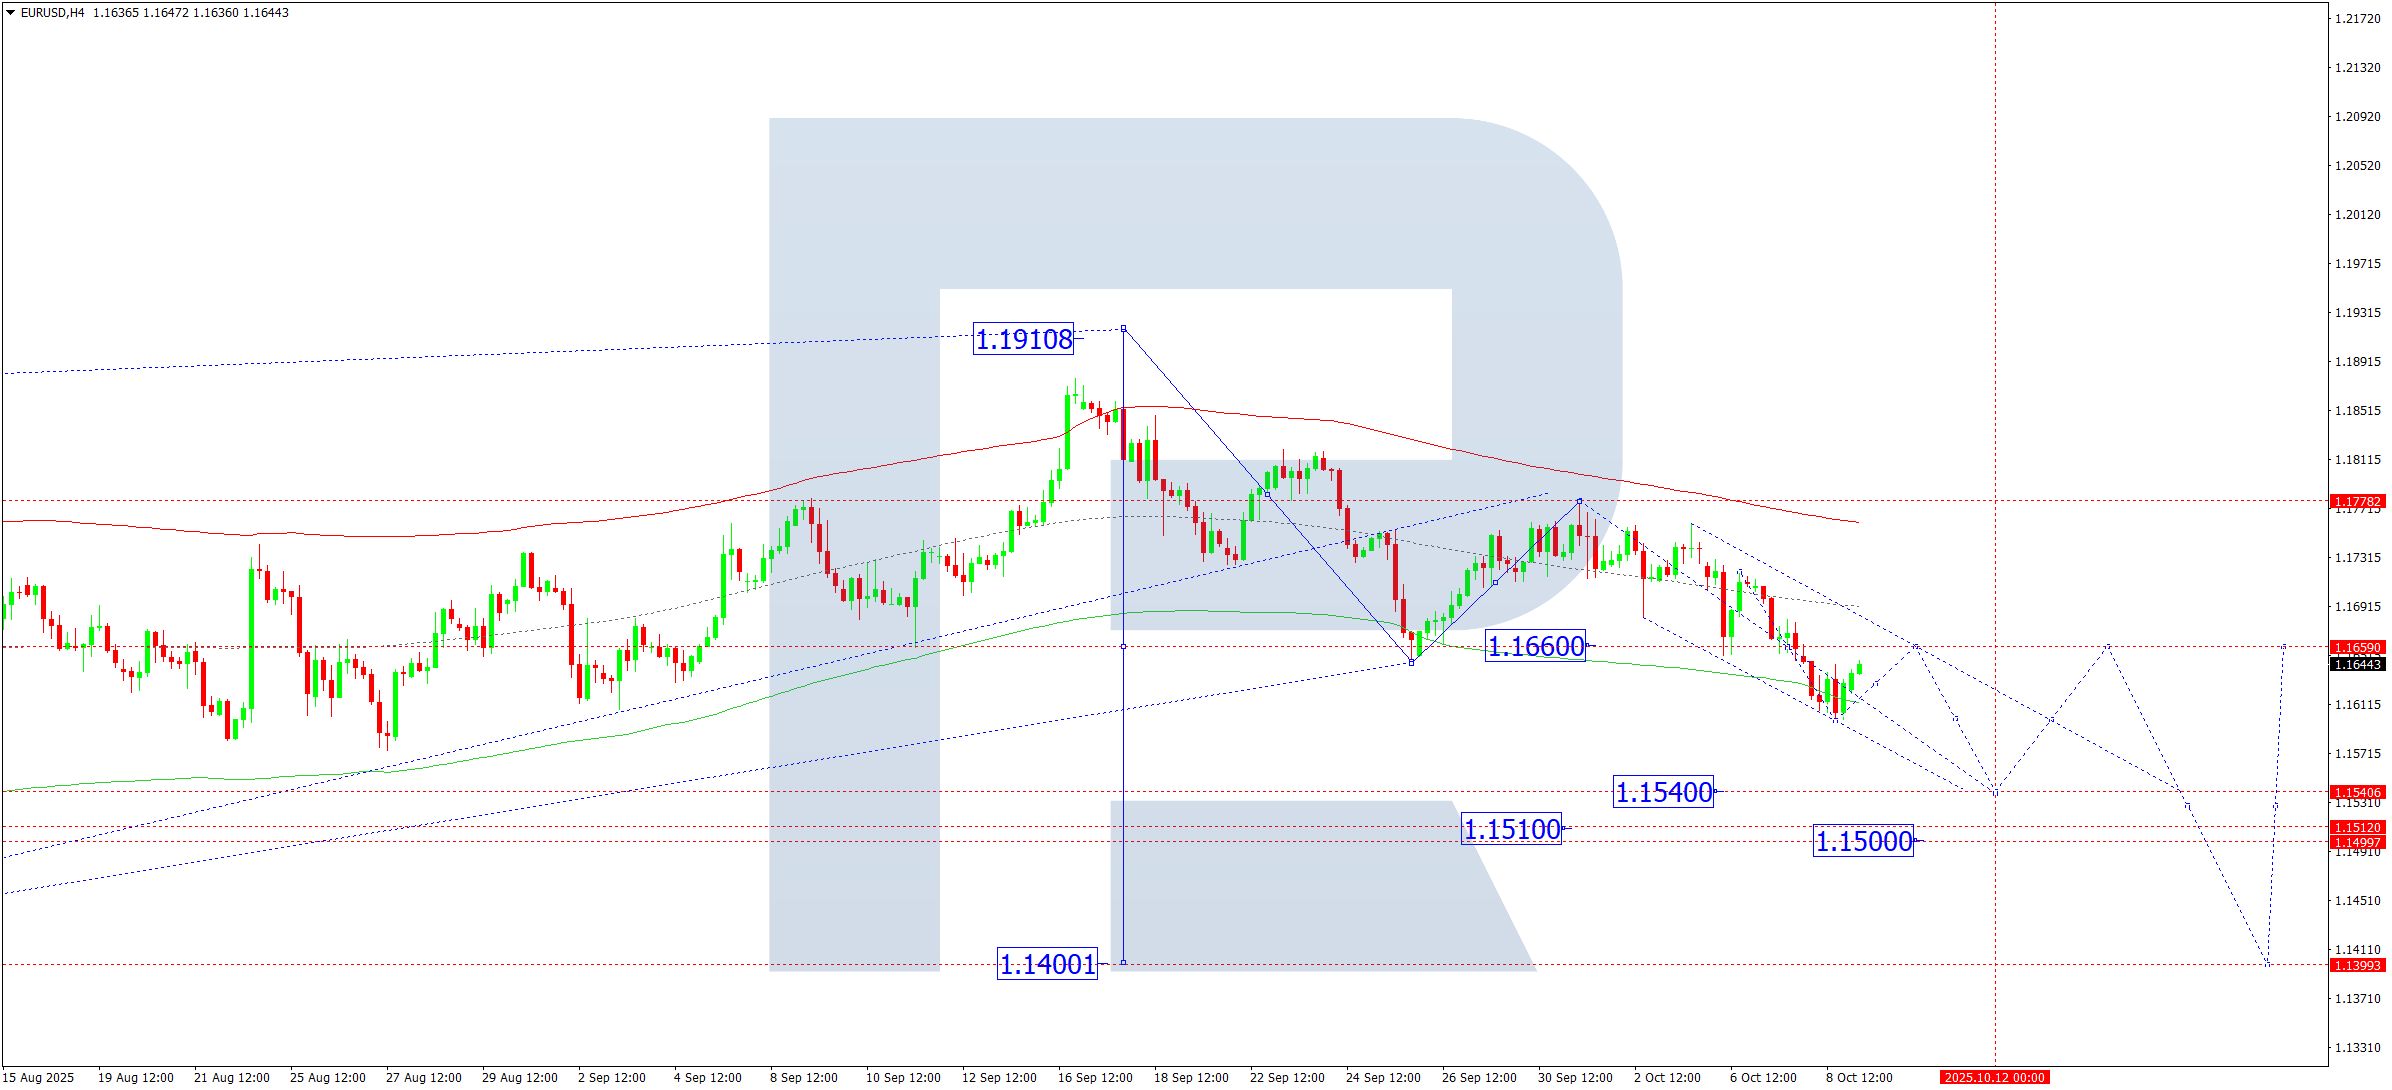
On the H4 chart, EURUSD has completed a downward move towards 1.1598, forming a narrow consolidation around 1.1660. For 9 October 2025, a short-term correction to retest 1.1660 from below is possible. Afterward, the pair is expected to resume its decline towards 1.1540, potentially extending to 1.1500.
From a technical perspective, this outlook is supported by the Elliott Wave structure and the ongoing bearish wave pattern, with 1.1660 acting as the key pivot level. The pair is likely to move towards the lower boundary of the Price Envelope at 1.1540, with room for a further slide to 1.1400.
Key levels:
- Resistance: 1.1660
- Support: 1.1540 → 1.1500
- Trend: Bearish continuation
USDJPY Forecast
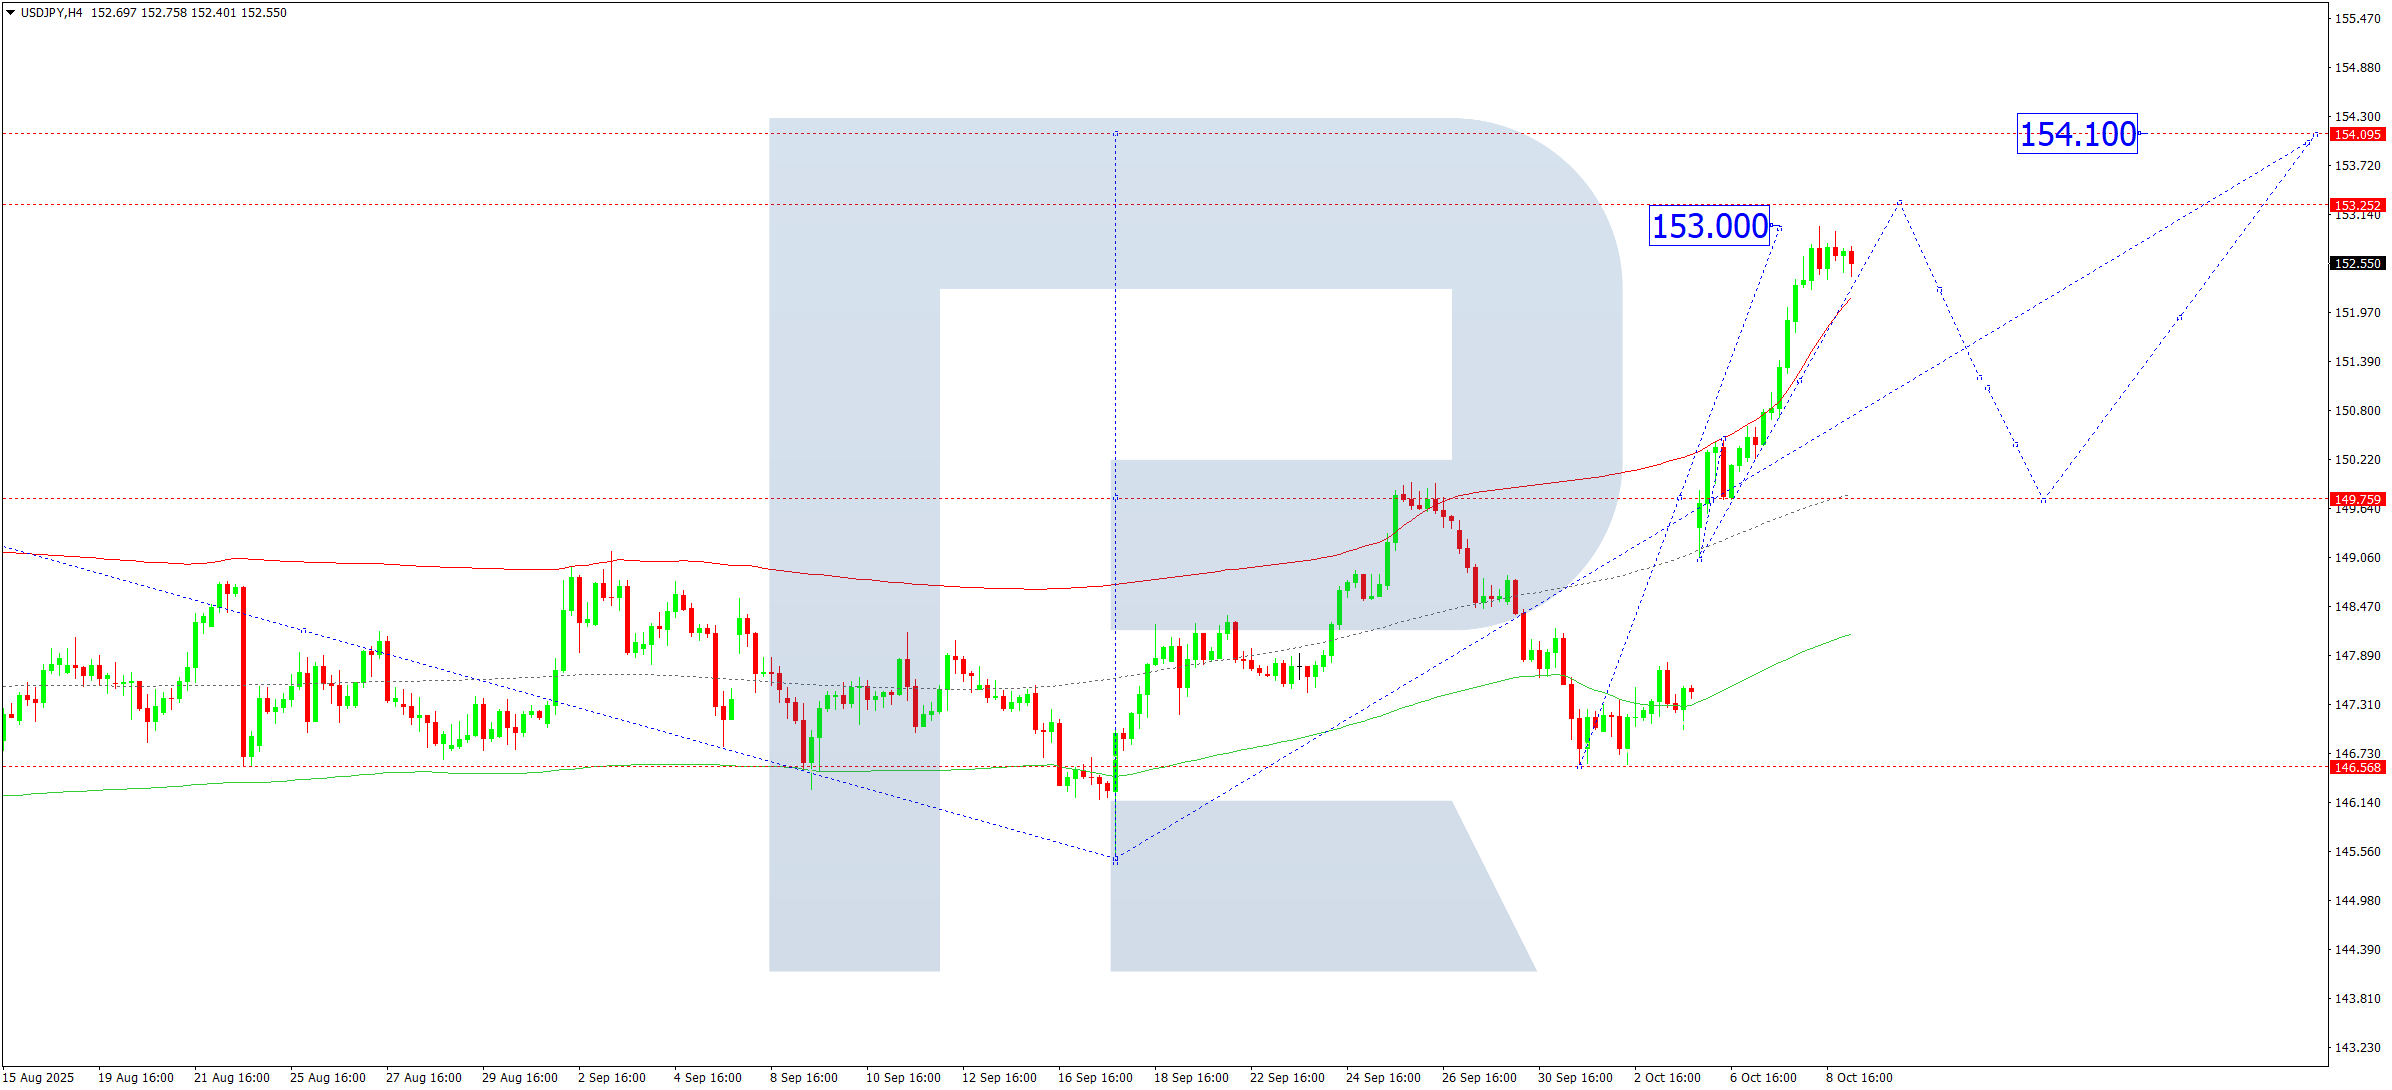
On the H4 chart, USDJPY has completed an upward movement to 153.00. A consolidation phase is expected just below this level, with a possible upward extension to 153.25. If the price breaks lower, a correction towards 149.76 could occur. Conversely, a breakout above the current high may trigger further gains toward 154.10.
The Elliott Wave pattern and bullish wave matrix support a continued uptrend, with 149.76 identified as the main pivot. Price remains directed towards the upper Price Envelope at 154.10, with potential for further upside to 156.90.
Key levels:
- Pivot: 149.76
- Resistance: 153.25 → 154.10 → 156.90
- Trend: Bullish continuation
GBPUSD Forecast
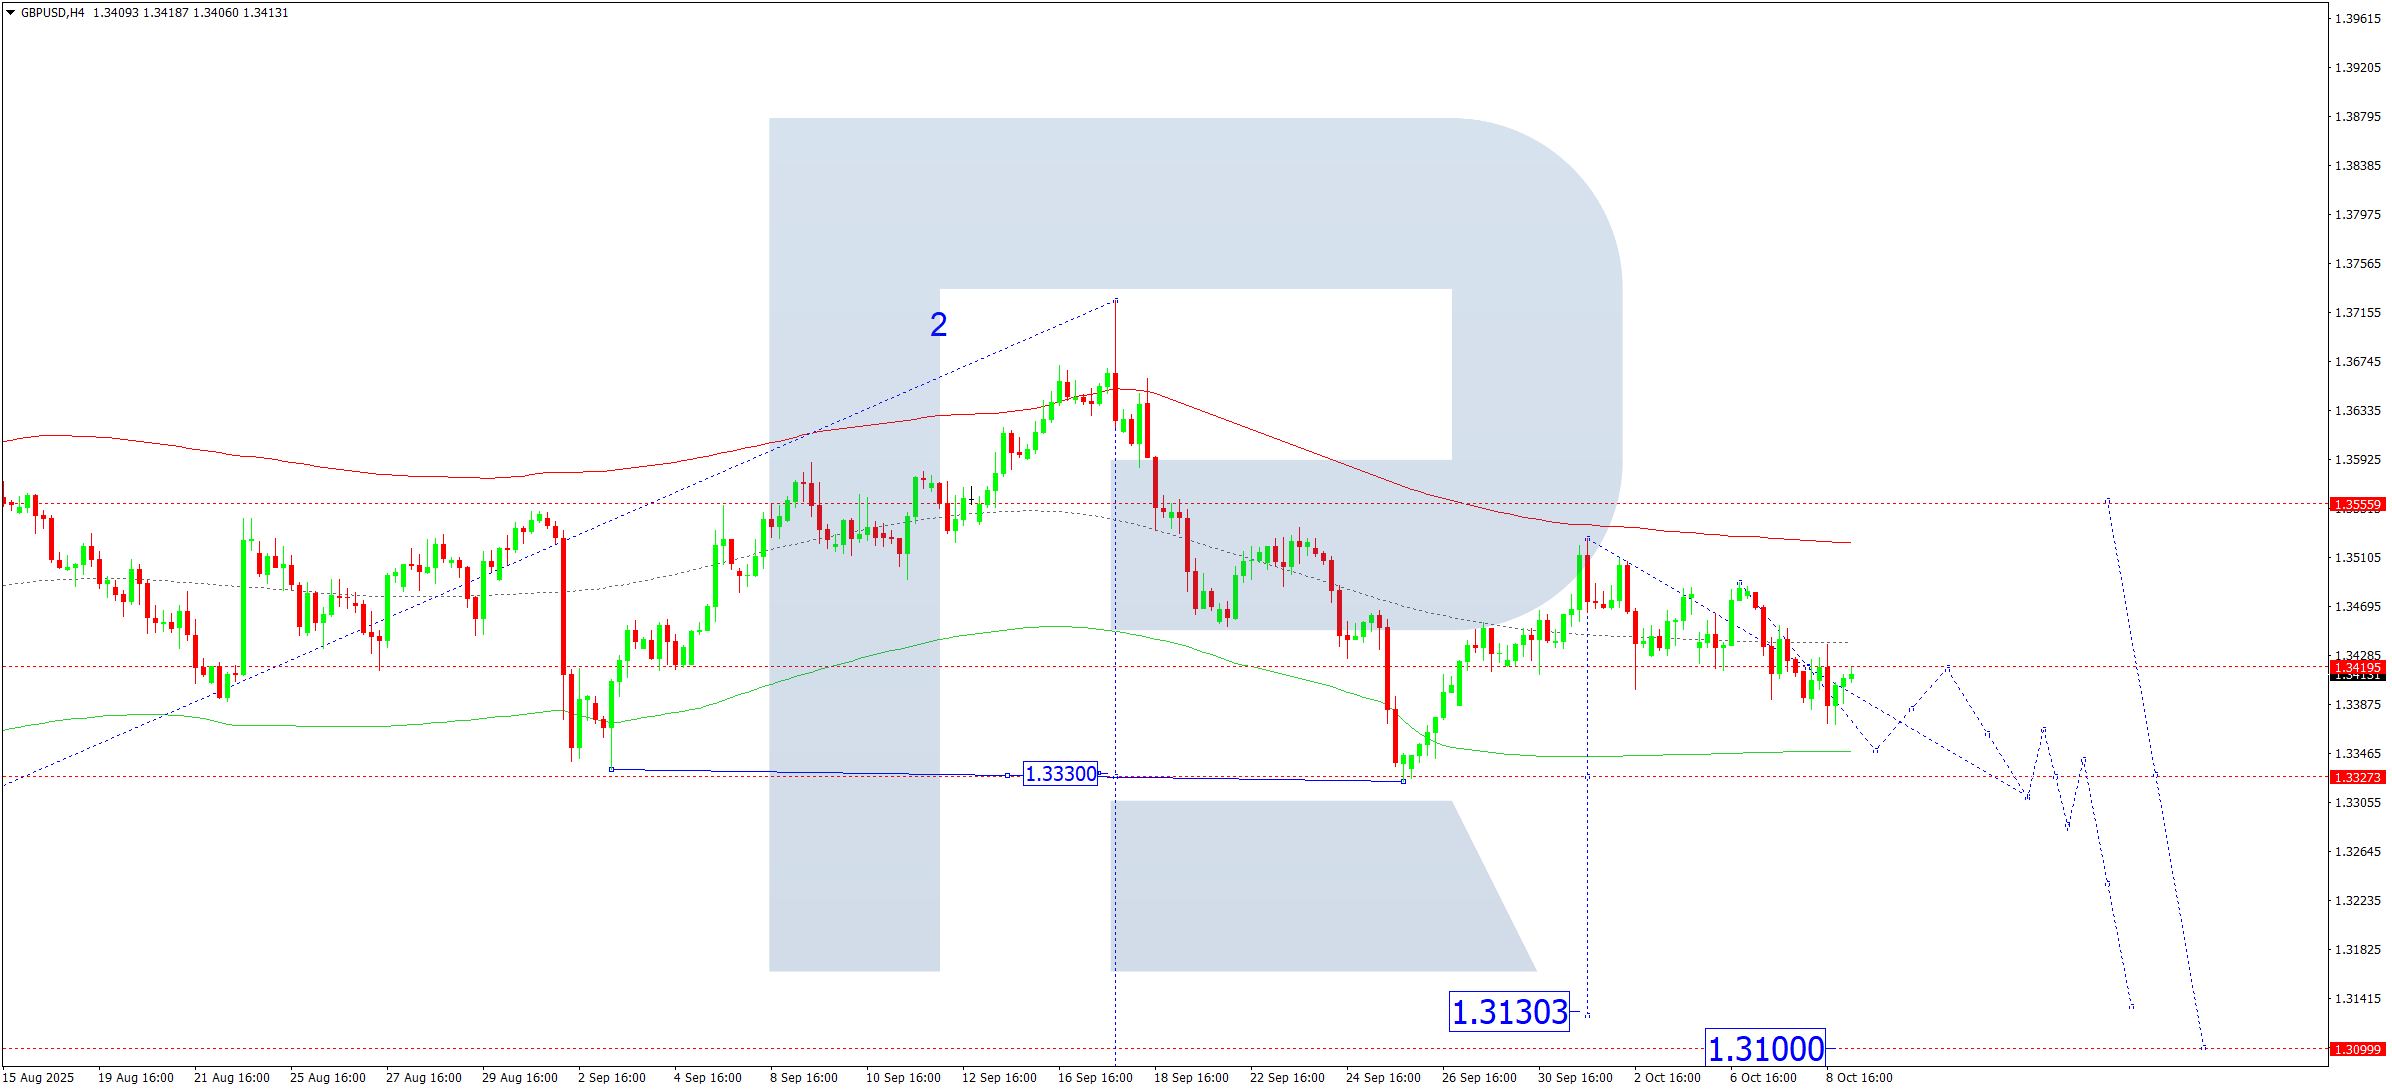
On the H4 chart, GBPUSD is consolidating around 1.3420. The range extended down to 1.3370, and a possible retest of 1.3420 from below is anticipated. A new bearish leg may then unfold, targeting 1.3344, with a possible move to 1.3311.
This outlook is in line with the Elliott Wave analysis and the downward wave matrix, where 1.3420 acts as a critical level. A breakdown below this level suggests a move towards the lower Price Envelope boundary at 1.3344 and possibly 1.3311.
Key levels:
- Pivot: 1.3420
- Support: 1.3344 → 1.3311
- Trend: Bearish
AUDUSD Forecast
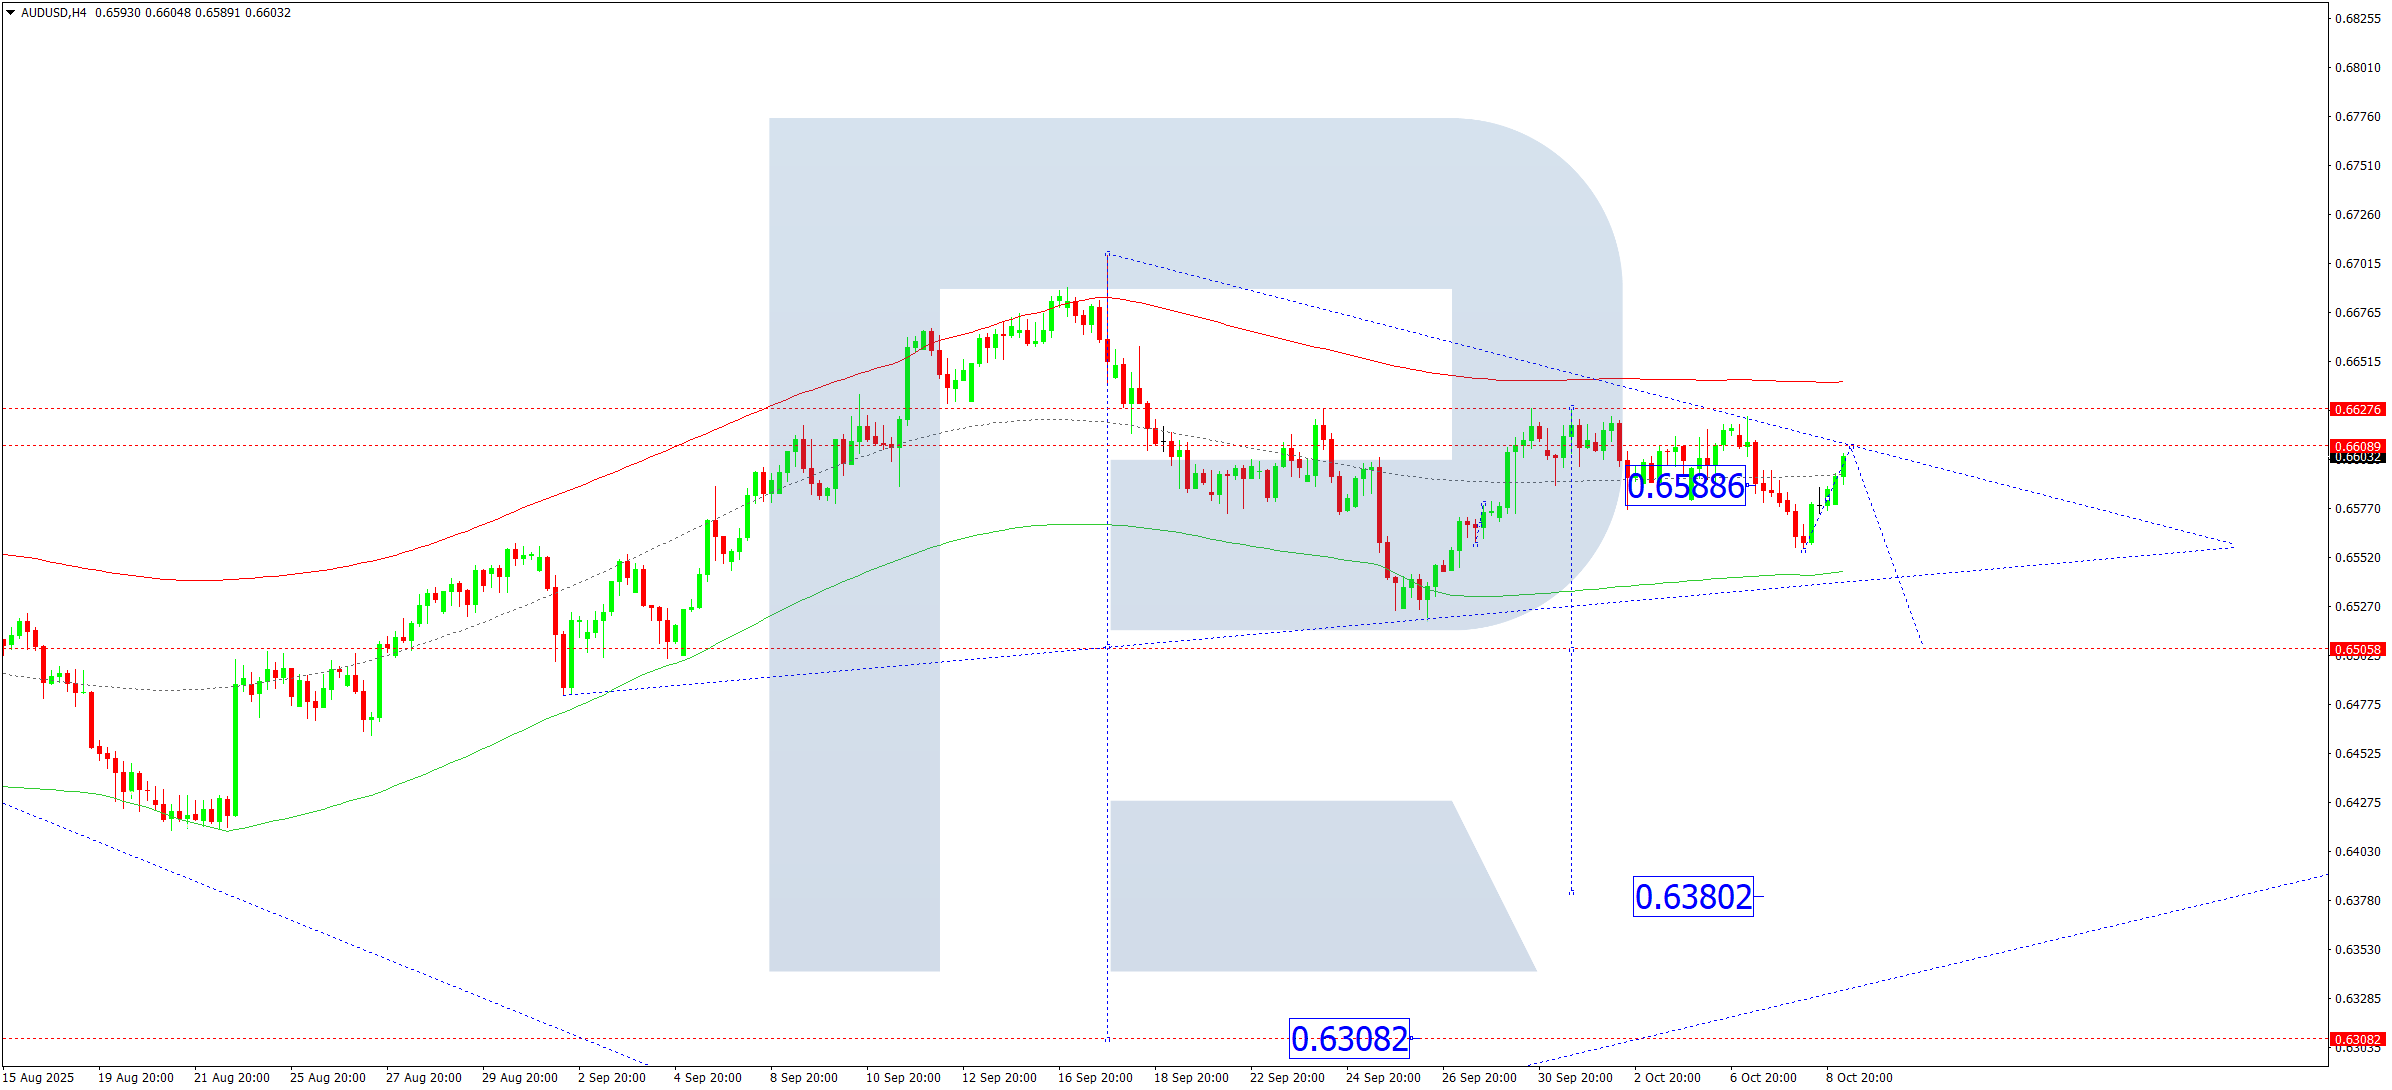
AUDUSD is trading within a consolidation range below 0.6627 on the H4 timeframe. The range has now expanded downward to 0.6555. A short-lived correction toward 0.6600 is possible, followed by a resumption of the downward trend toward 0.6500.
The technical structure, supported by the Elliott Wave pattern, shows 0.6633 as the pivot. A move below 0.6500 could open the path to a deeper decline towards 0.6380.
Key levels:
- Resistance: 0.6600
- Support: 0.6500 → 0.6380
- Trend: Bearish continuation
USDCAD Forecast
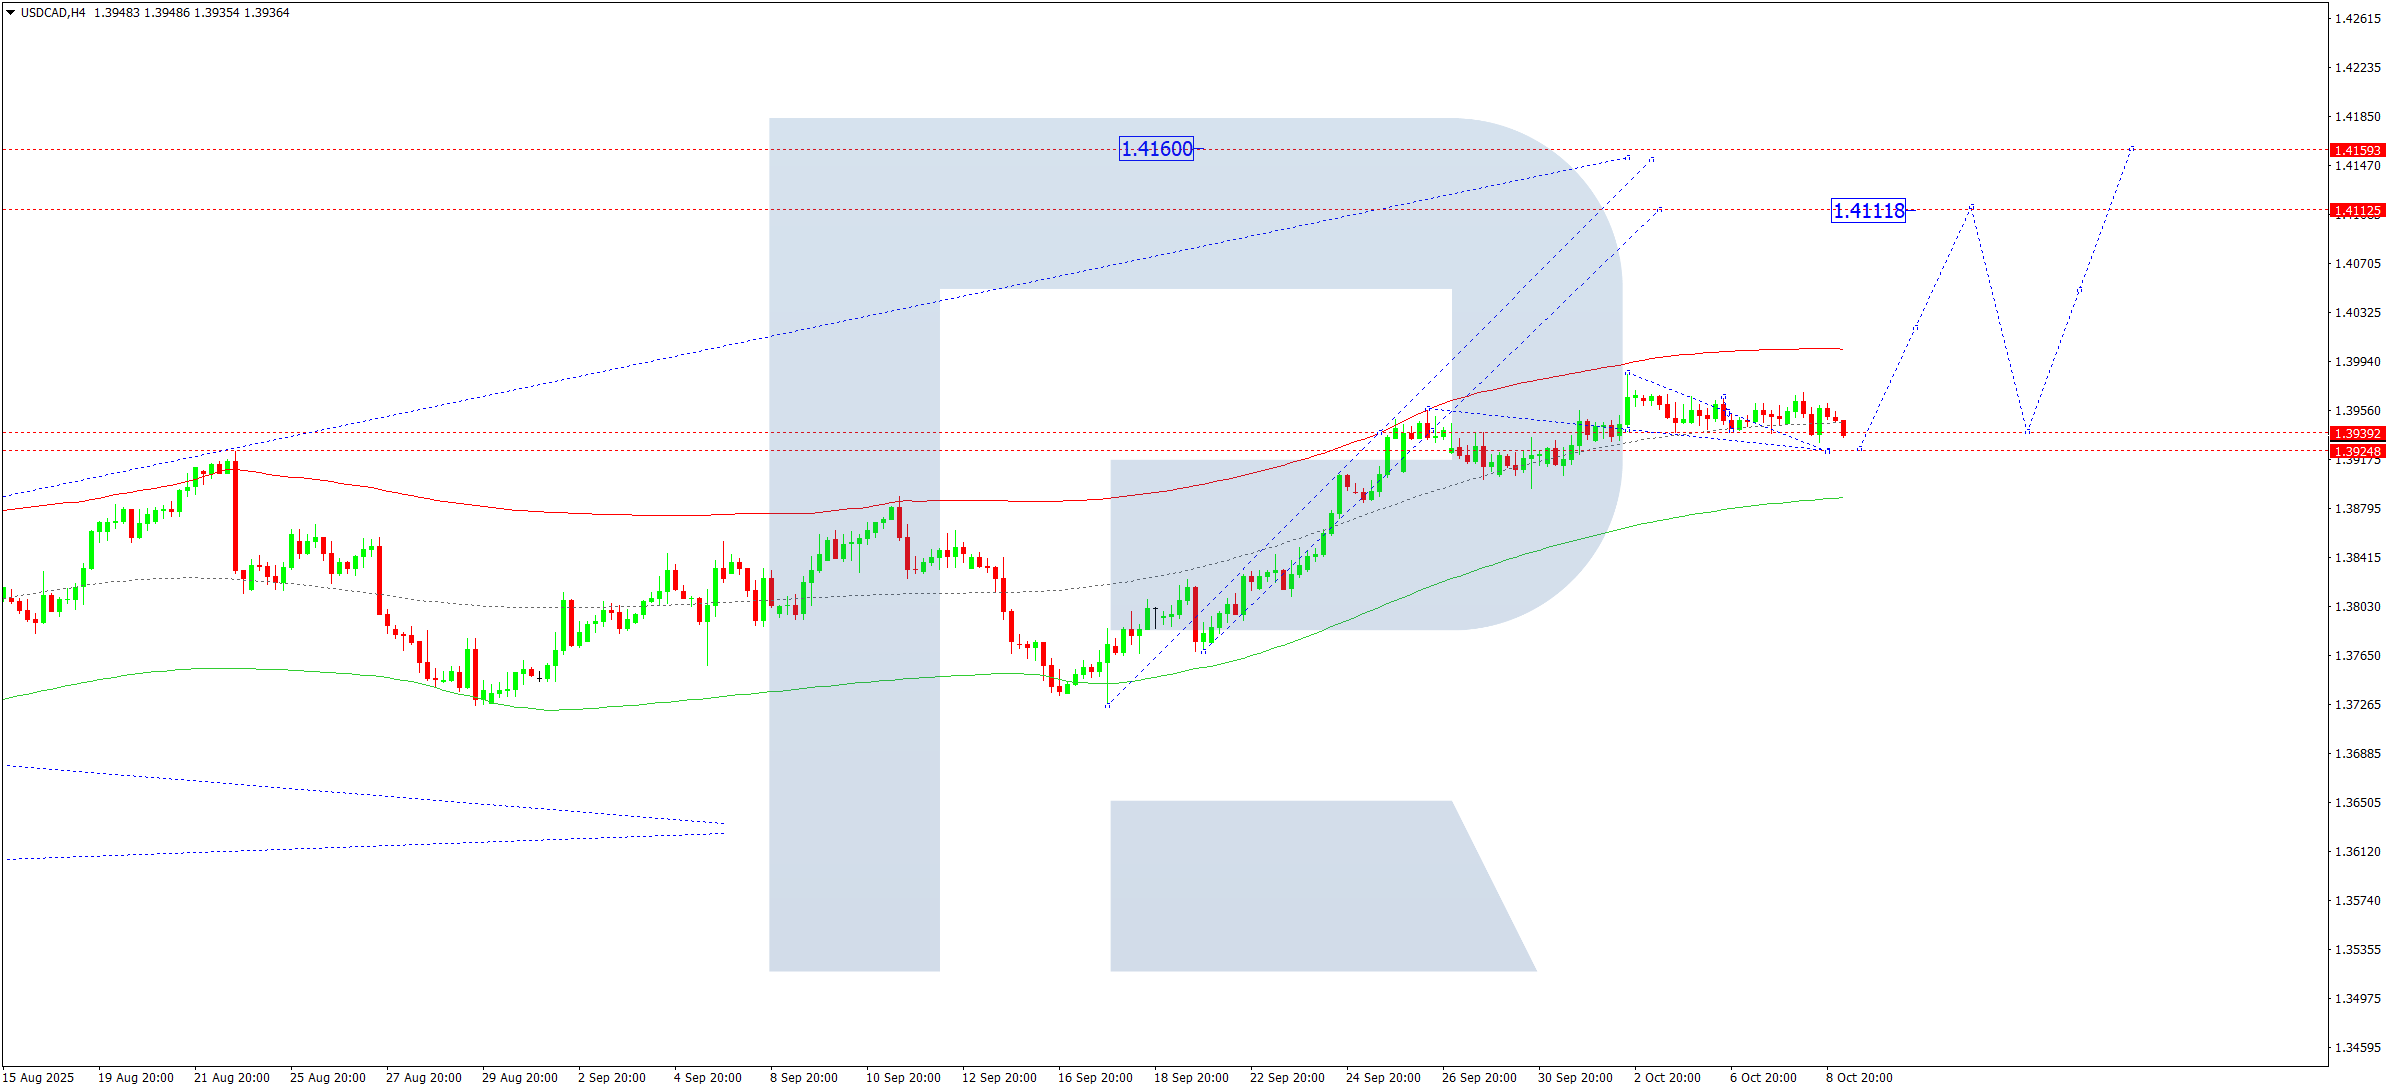
USDCAD continues to develop a consolidation range around 1.3955. A minor dip toward 1.3925 may occur before a potential rally towards 1.4010, with scope for an extension to 1.4111.
The upward wave structure remains intact, with 1.3939 serving as the key pivot. Price action suggests a move to the upper Price Envelope near 1.4111, followed by a possible correction back to 1.3930 before another upward move to 1.4160.
Key levels:
- Pivot: 1.3939
- Resistance: 1.4010 → 1.4111 → 1.4160
- Trend: Bullish
XAUUSD (Gold) Forecast
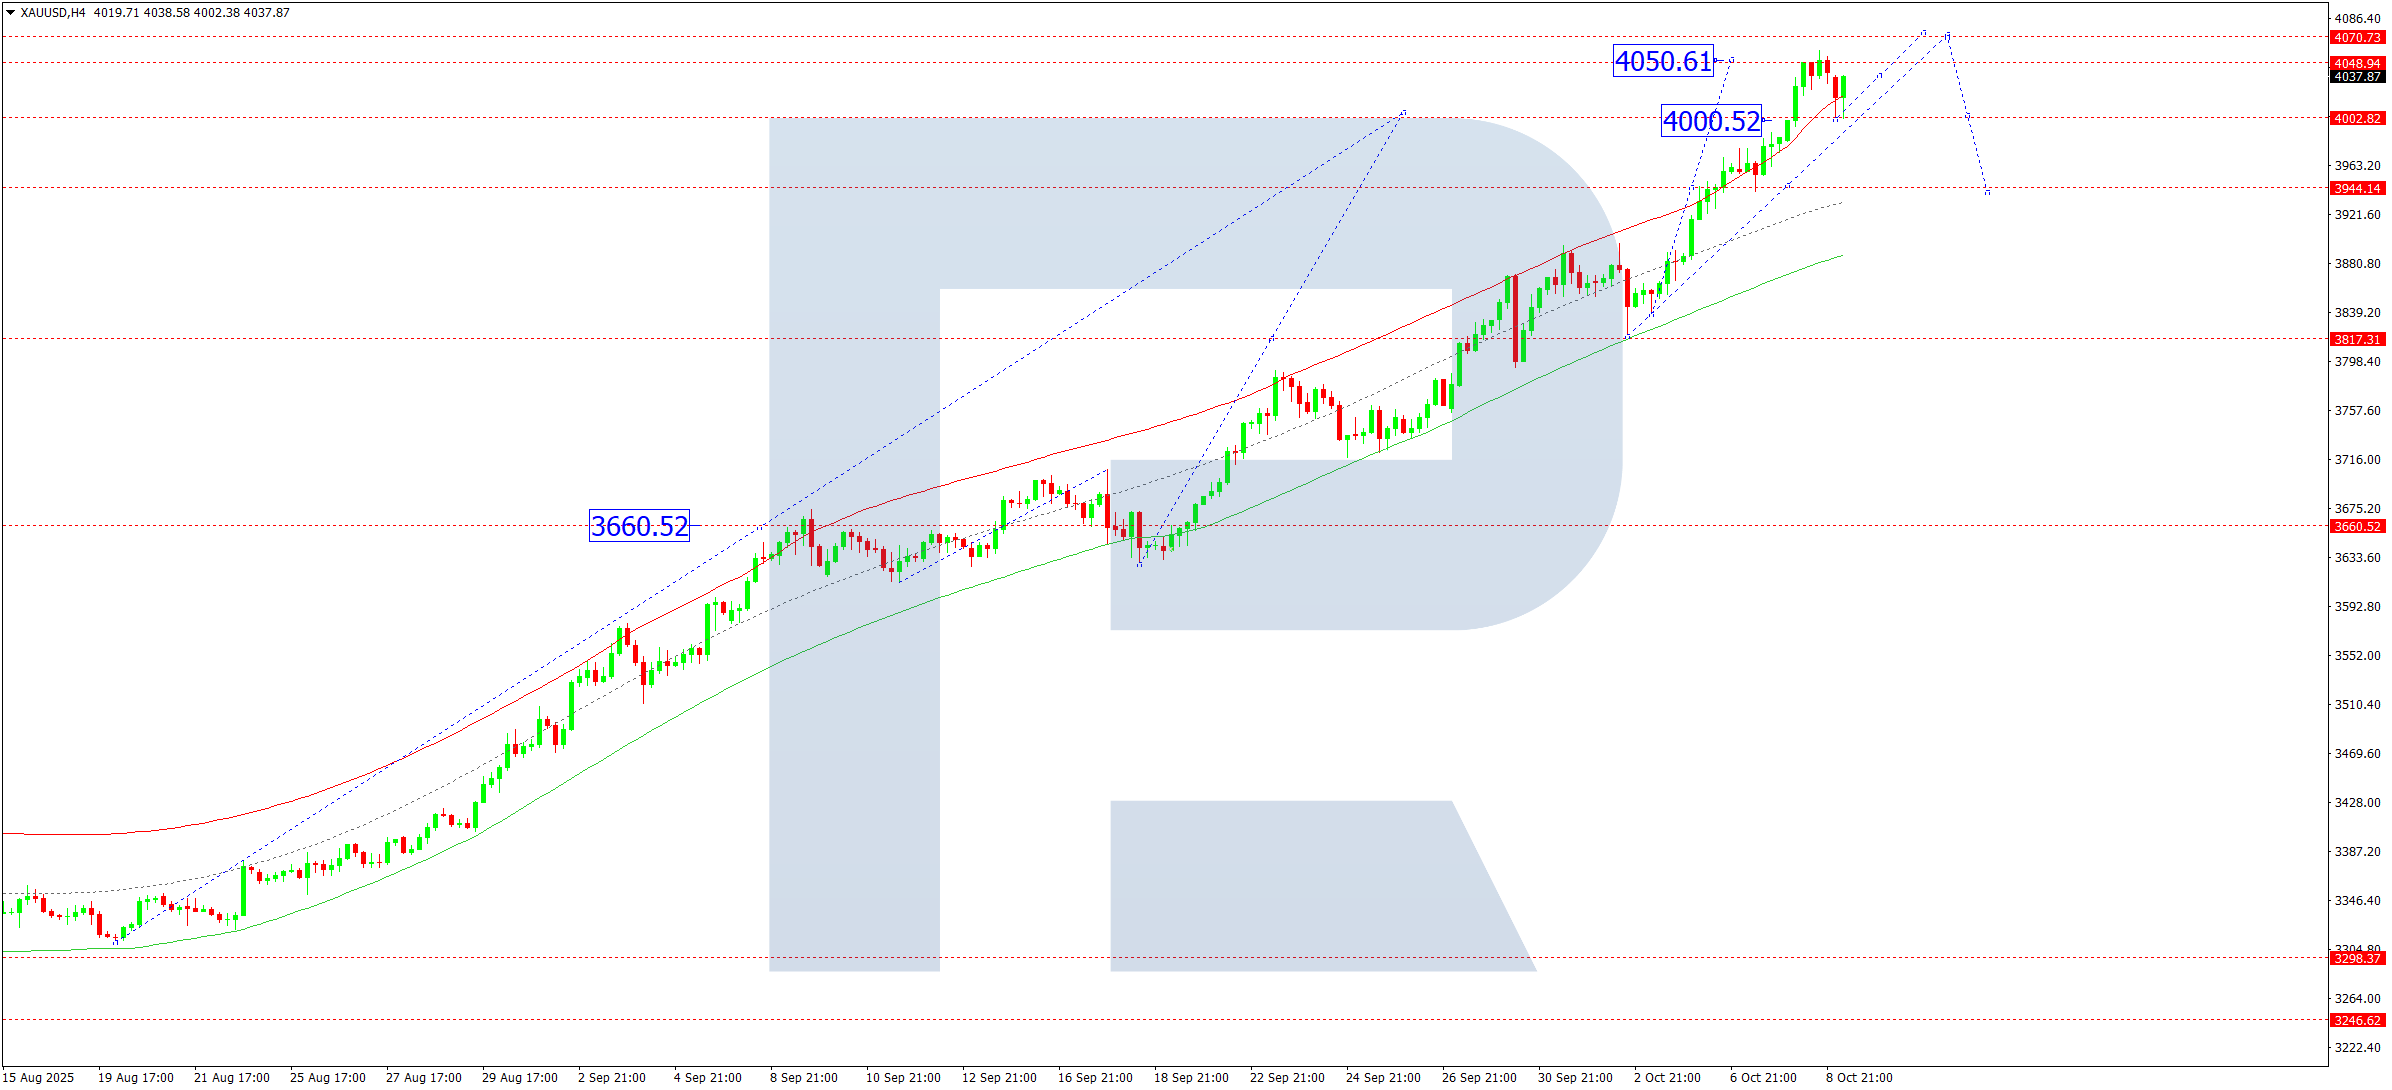
Gold (XAUUSD) has completed an upward wave to 4,059 on the H4 chart. A corrective pullback toward 4,000 is likely, after which another upward movement to 4,070 may begin.
The bullish wave matrix, supported by Elliott Wave analysis, highlights 3,660 as the pivot. The price is trending toward the upper Price Envelope at 4,070, with the potential for a pullback to the mid-range at 3,944.
Key levels:
- Support: 4,000
- Resistance: 4,070
- Trend: Bullish continuation
Brent Crude Forecast
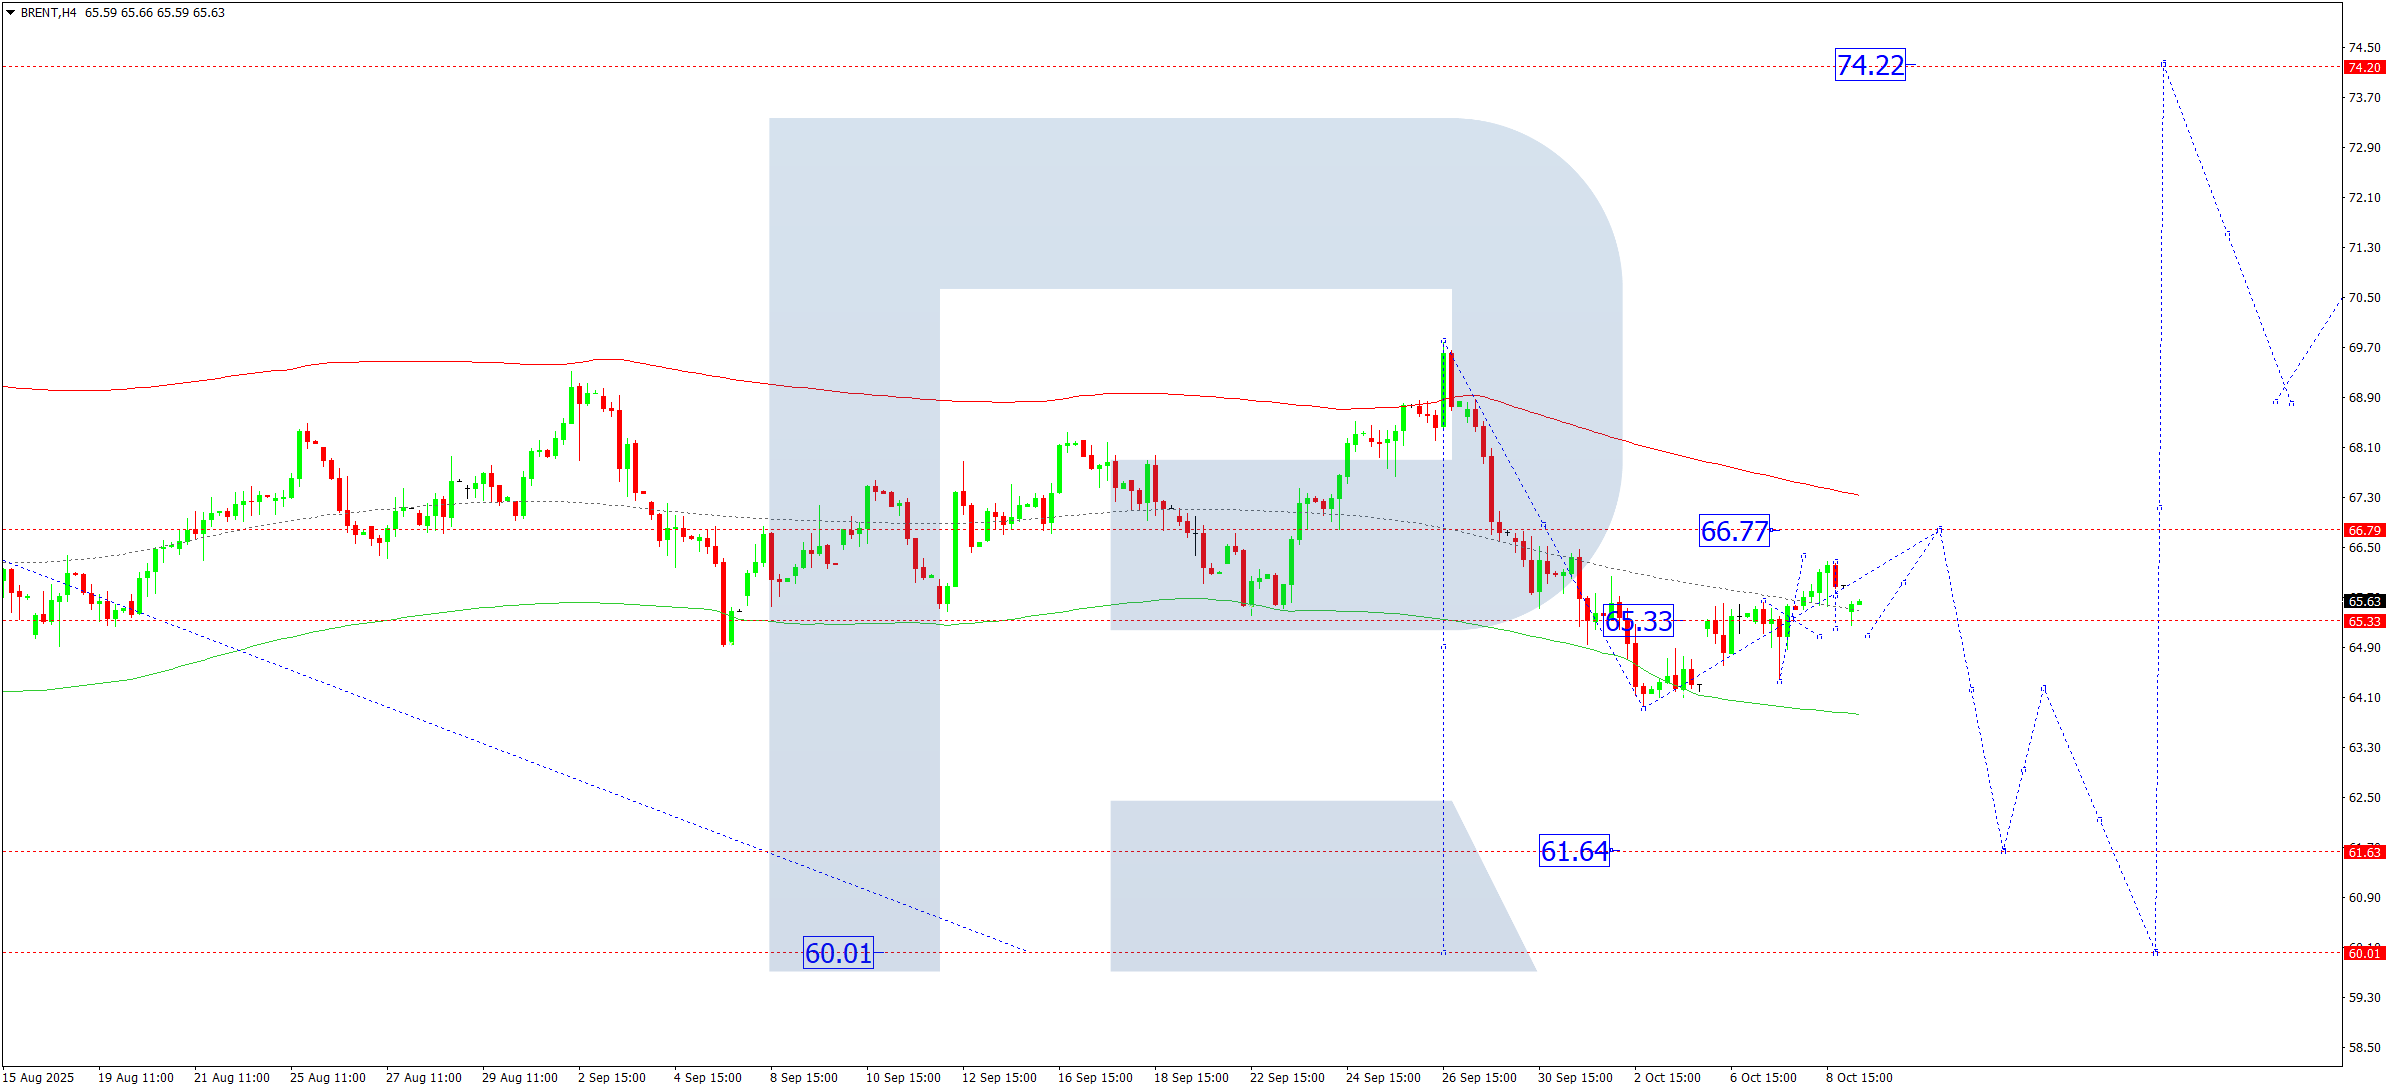
Brent crude oil is trading in a consolidation range near 65.33. The price extended to 66.28 on the upside and 65.25 on the downside. A move towards 66.77 is expected, followed by a potential correction to 65.33. If this level breaks downward, a decline towards 61.64 may follow. A breakout above 67.00 opens the way for a move towards 74.22.
The Elliott Wave analysis and current price structure support this outlook, with 66.77 acting as the key pivot level. The price is attempting a correction from the lower Price Envelope boundary at 64.00 toward the upper level at 66.77, before possibly continuing the overall bearish wave to 61.64.
Key levels:
- Pivot: 66.77
- Resistance: 67.00 → 74.22
- Support: 65.33 → 61.64
- Trend: Mixed (short-term bullish, longer-term bearish)
Risk Warning: Past performance is not indicative of future results. Trading involves risk, and you should only trade with capital you can afford to lose. Always conduct your own analysis or consult with a professional before making investment decisions.
Leave a Reply