
Daily technical analysis and forecast for 13 October 2025
EURUSD Forecast
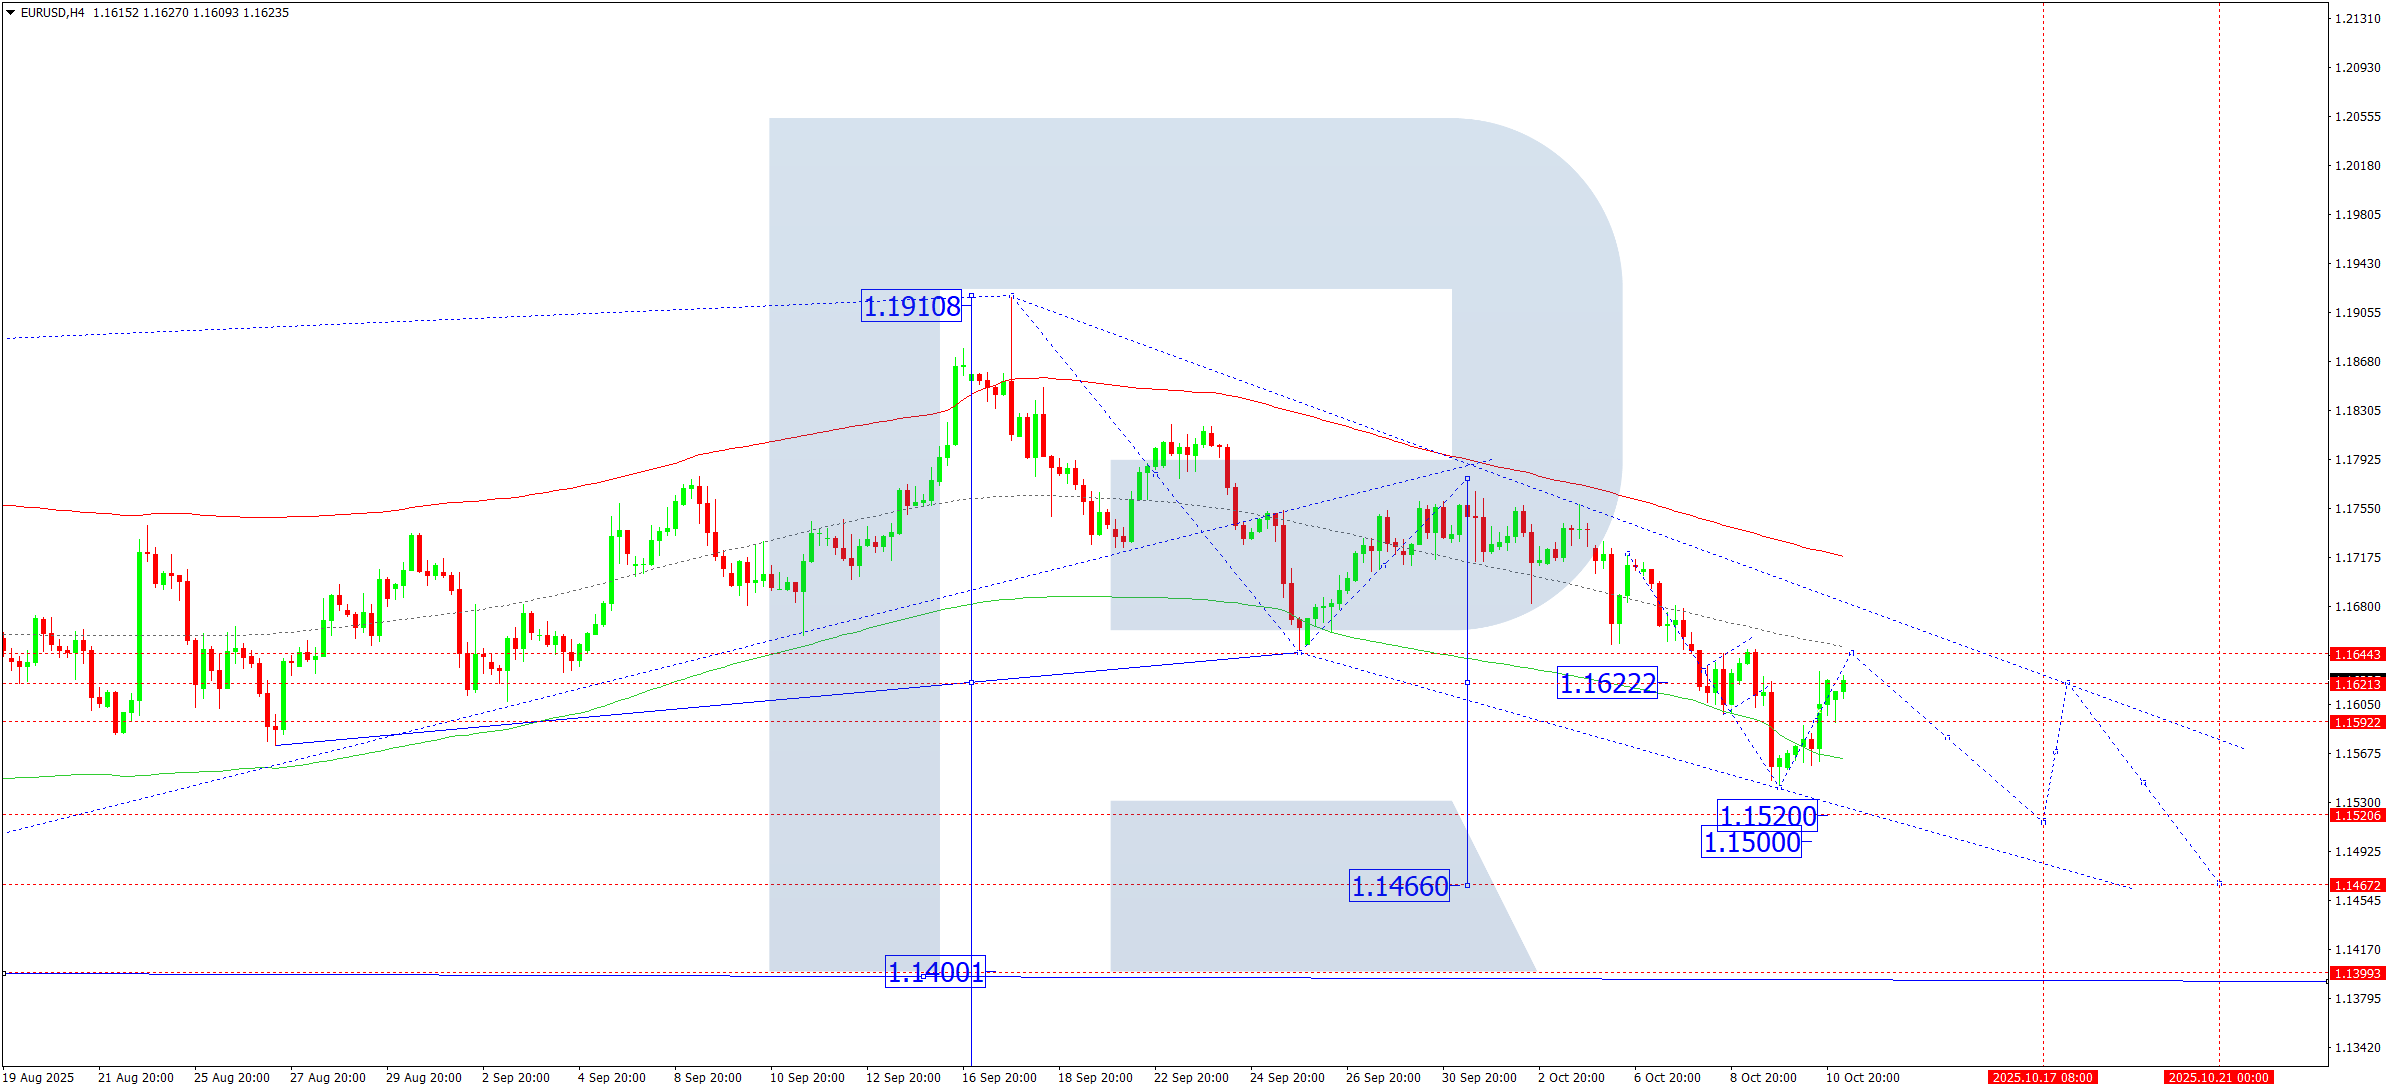
On the H4 timeframe, EURUSD has completed a decline to 1.1542, followed by consolidation near 1.1592. A corrective rise toward 1.1644 is expected today, after which the pair may resume its downward trend towards 1.1520, with possible extensions to 1.1500 and 1.1466.
This outlook aligns with the Elliott Wave structure and a bearish wave matrix, with a key pivot at 1.1622. The price is expected to move toward the lower band of the Price Envelope around 1.1520, with a broader bearish target at 1.1466.
Technical Indicators: Indicate a likely move lower, with 1.1520 as the next target.
USDJPY Forecast
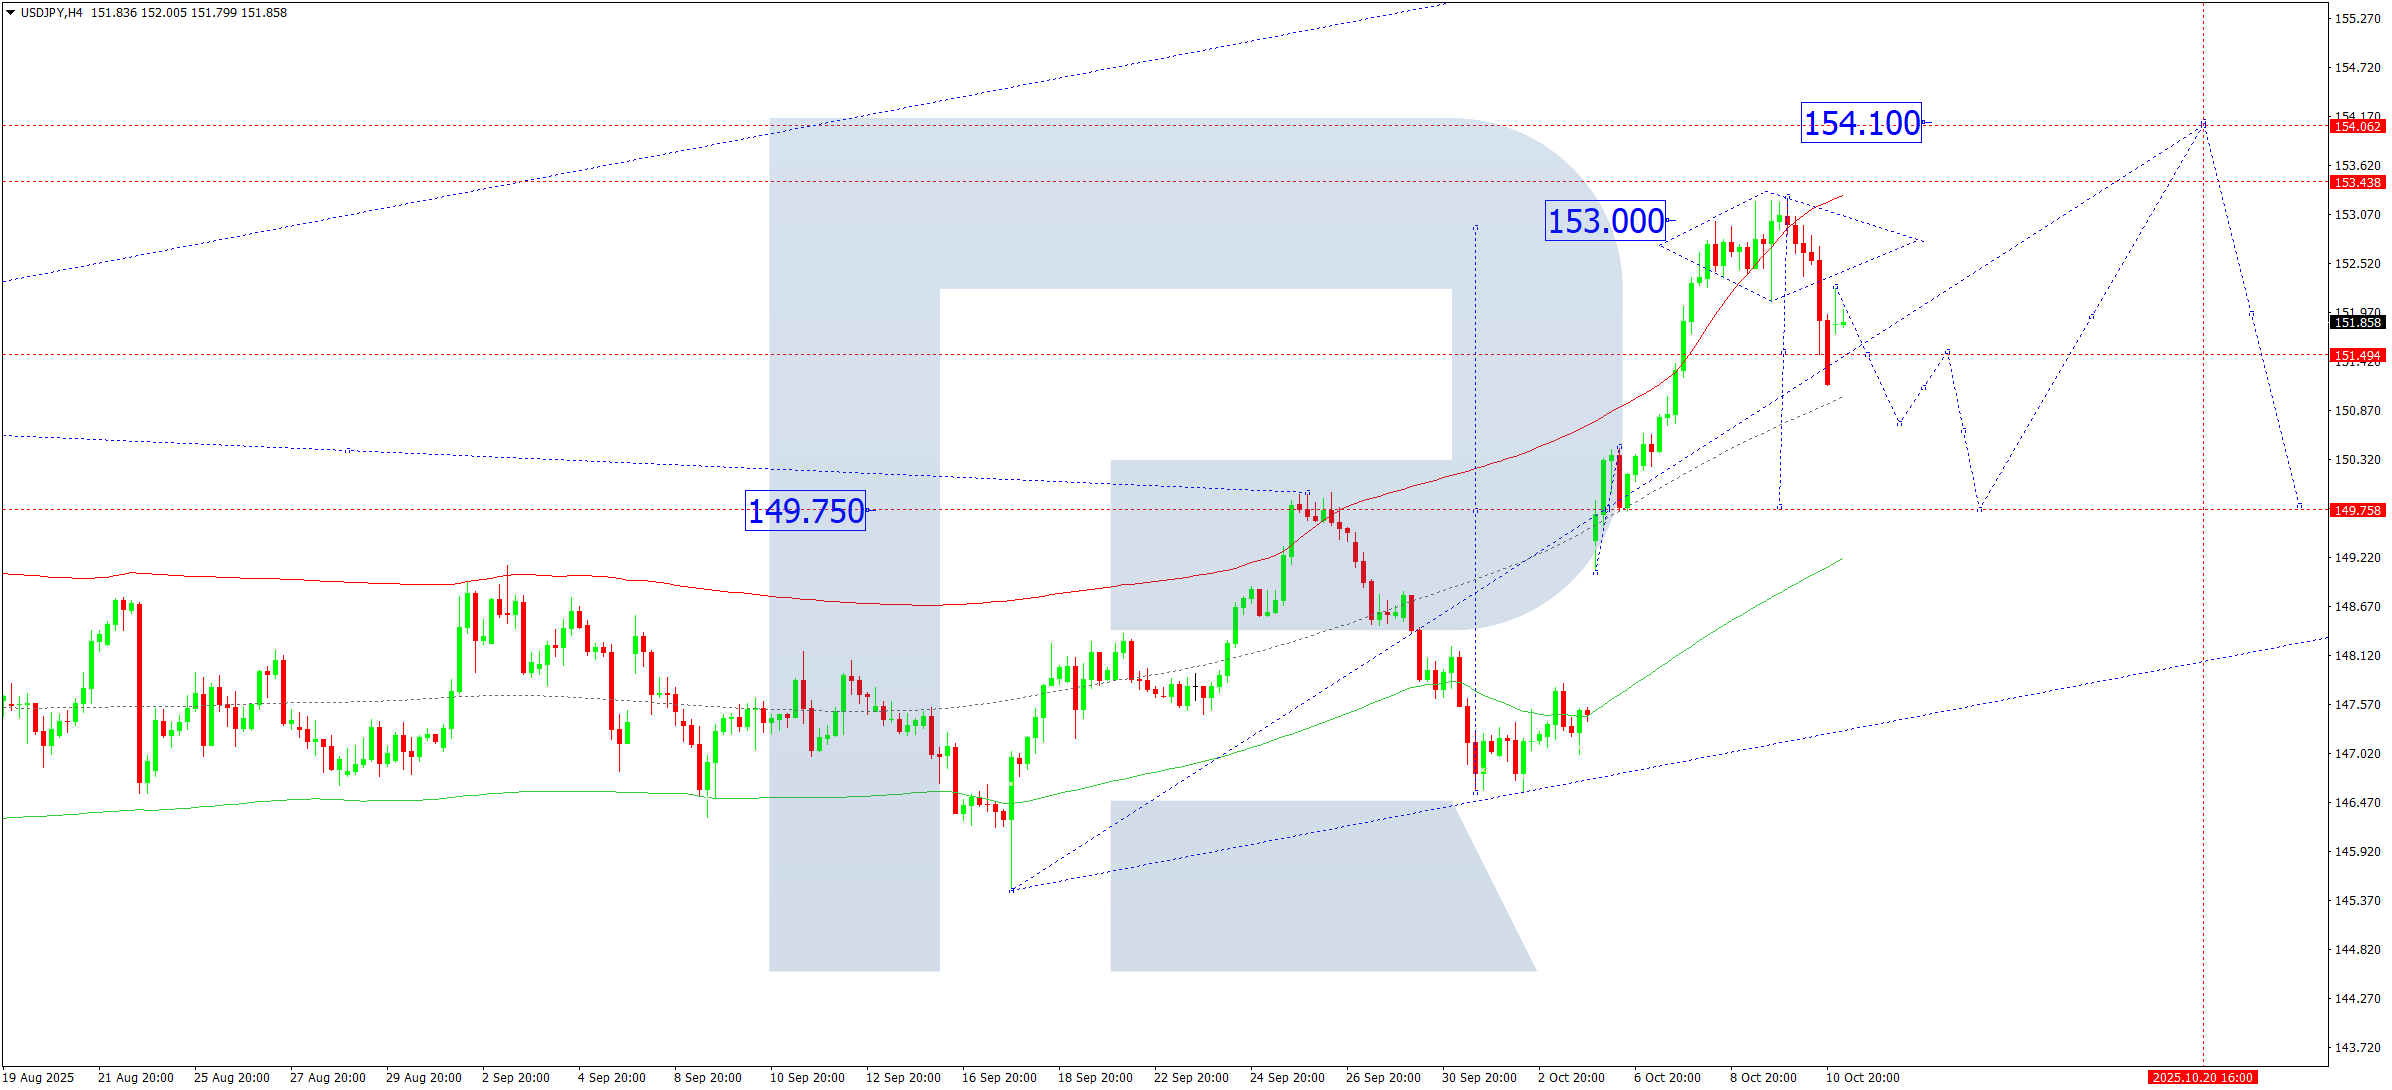
On the H4 chart, USDJPY completed a rise to 152.26 following a correction to 151.15. A further correction toward 150.70 is anticipated today, with potential extension to 149.76. Once this correction concludes, a fresh upward wave may develop, targeting 154.10.
This scenario is supported by the Elliott Wave framework and a bullish wave matrix, with a critical pivot at 149.76. The pair is currently heading towards the middle of the Price Envelope (150.70), with room to fall to its lower edge at 149.76 before rebounding.
Technical Indicators: Support further downside to 150.70–149.76 before a potential move higher.
GBPUSD Forecast
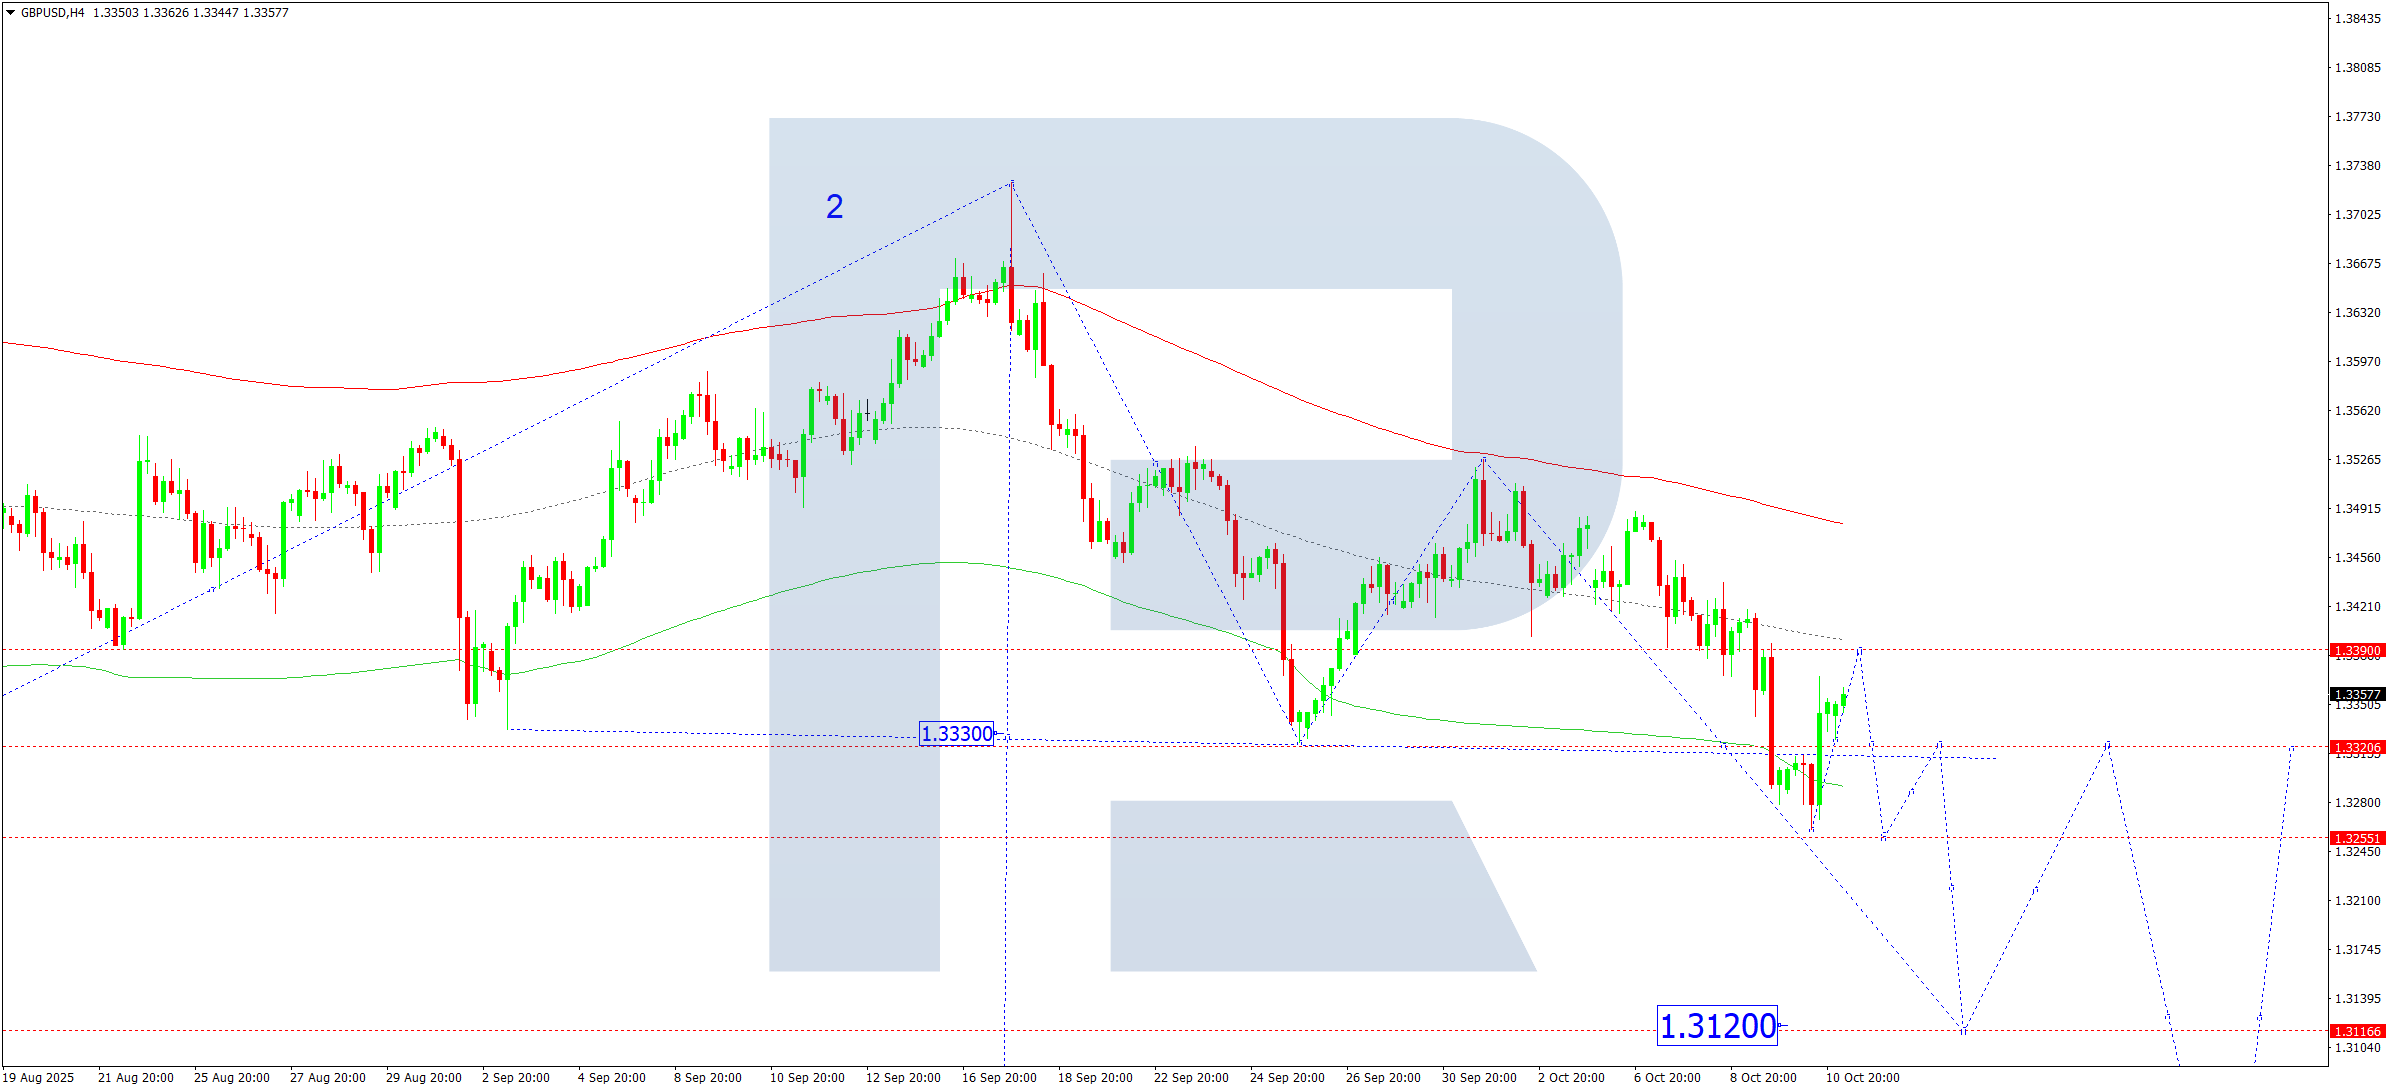
GBPUSD has formed a consolidation range near 1.3320, with an upward breakout pointing to a correction towards 1.3390. This correction is likely to end today, followed by a downward move targeting 1.3250, potentially extending to 1.3120.
The Elliott Wave structure and bearish wave matrix back this outlook, with 1.3390 as the pivot point. The price may briefly test the center of the Price Envelope before declining toward its lower boundary at 1.3255, and possibly further to 1.3120.
Technical Indicators: Indicate a correction toward 1.3390 followed by a potential decline to 1.3120.
AUDUSD Forecast
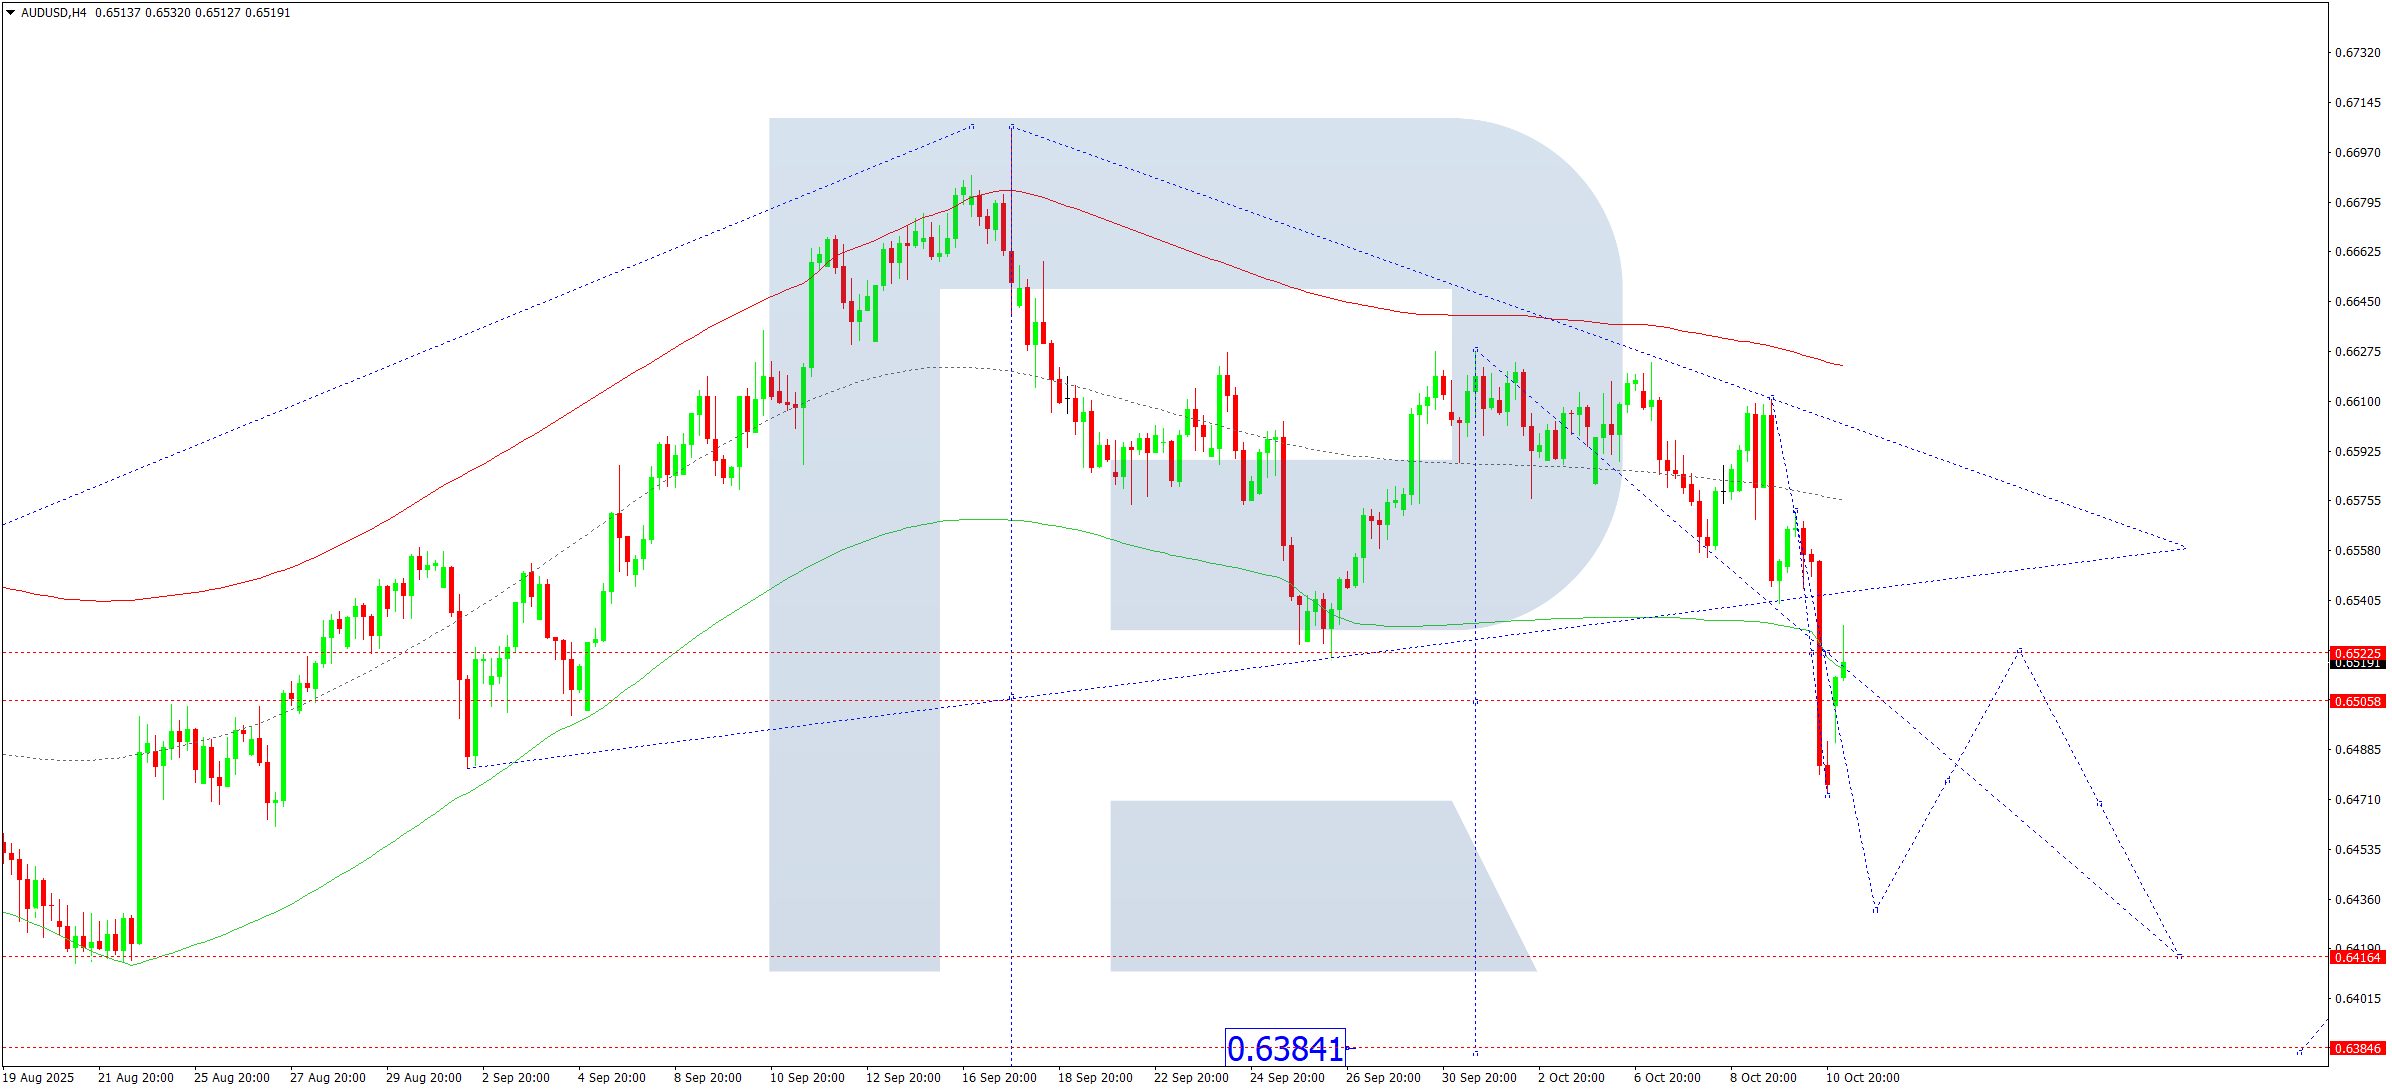
AUDUSD has completed a downward move to 0.6473 and a correction to 0.6525. Today, a continuation of the downtrend is expected, with targets at 0.6433 and potentially 0.6416. A breakout below 0.6416 could open the way for a move toward 0.6384.
This bearish scenario is consistent with the Elliott Wave analysis and wave matrix, with 0.6525 as a key pivot level. The price is moving toward the lower band of the Price Envelope at 0.6416.
Technical Indicators: Point to a continued decline, with 0.6416 and 0.6384 as key downside targets.
USDCAD Forecast
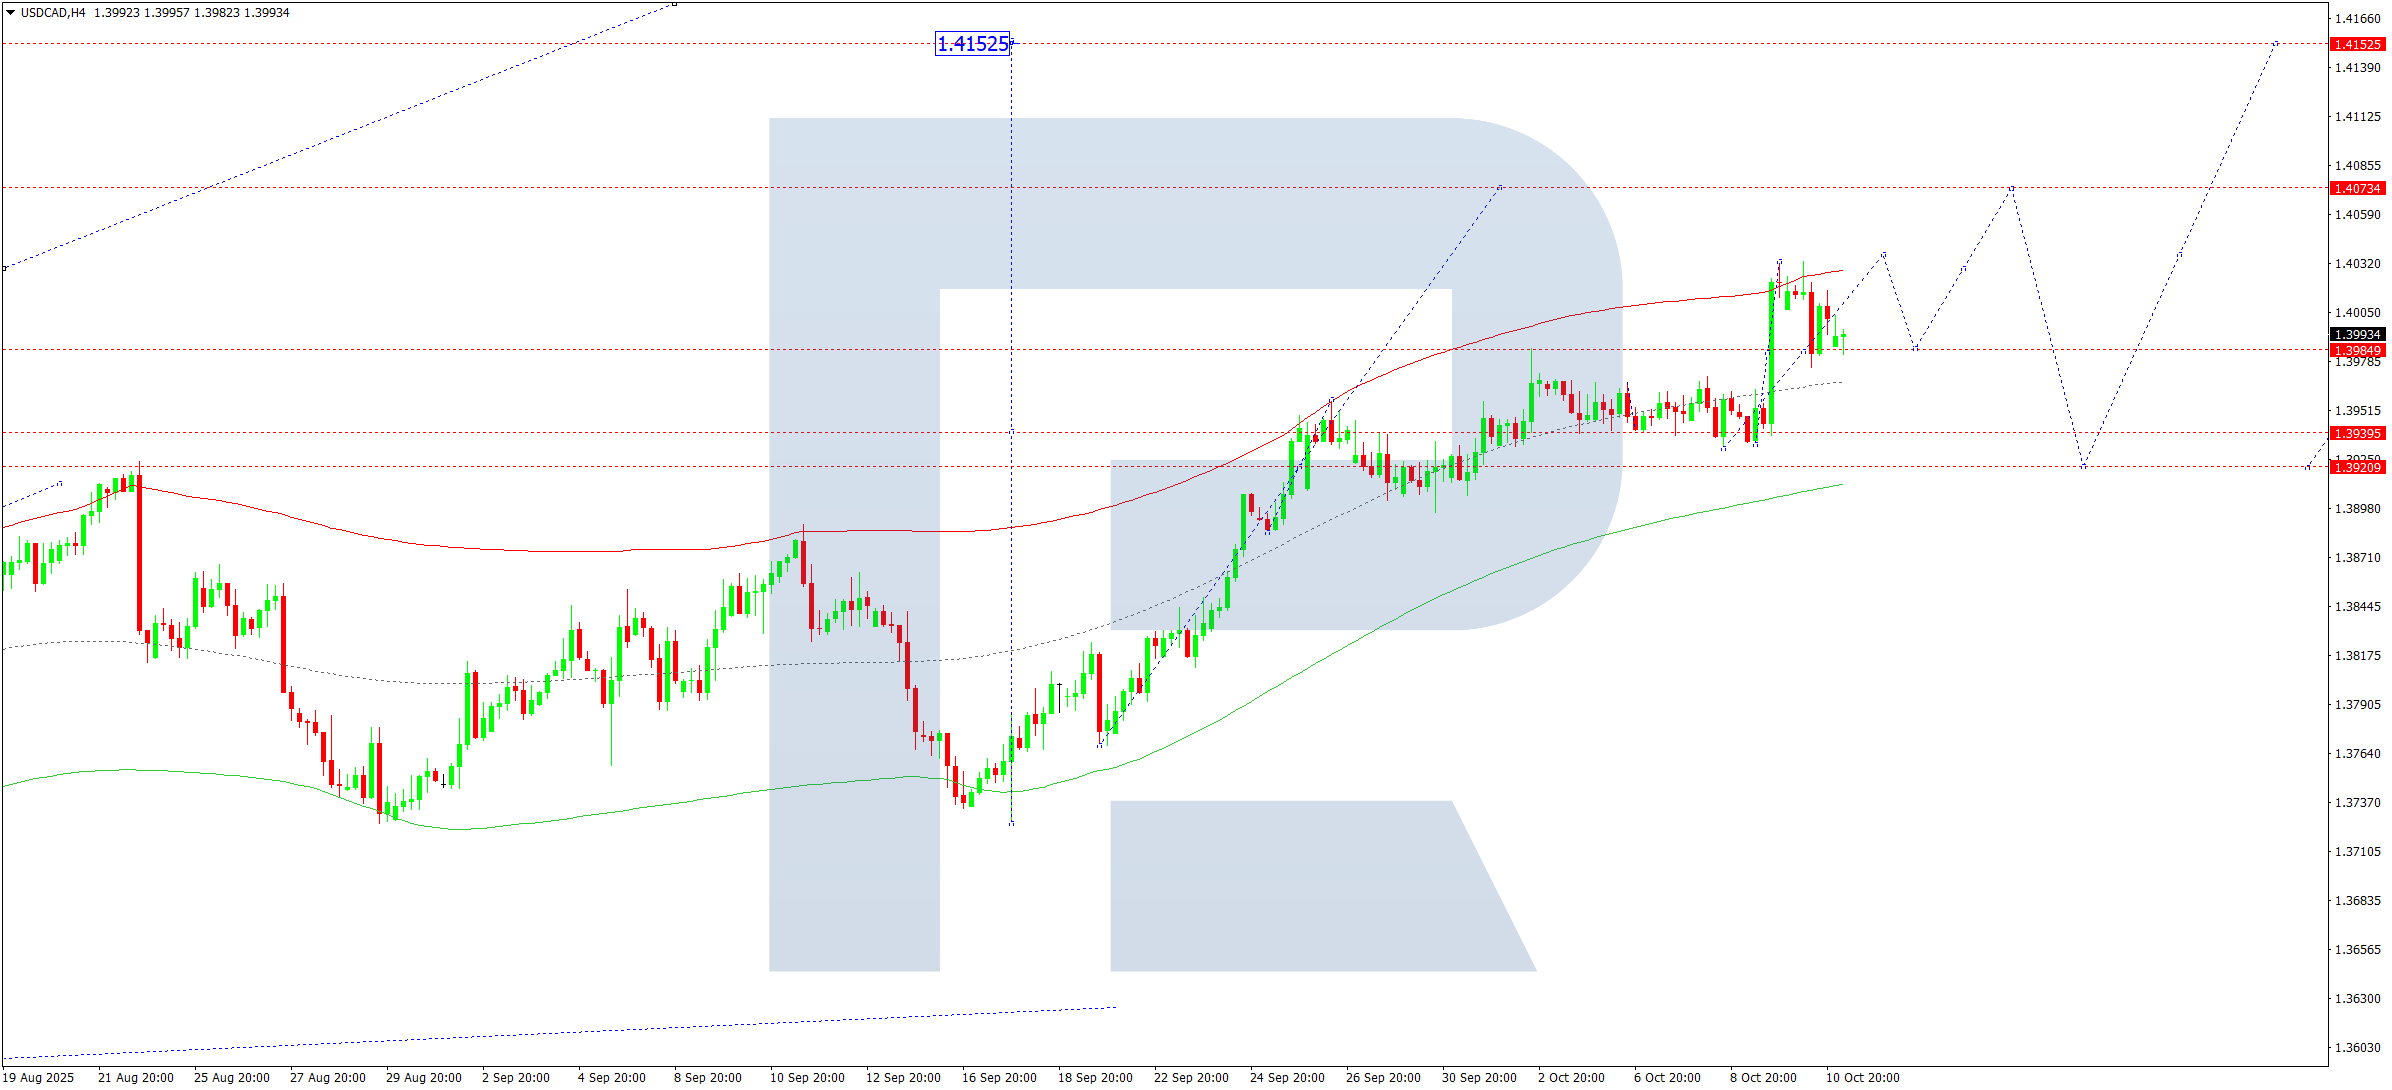
USDCAD has rebounded from support at 1.3985 and is advancing toward 1.4037. Once this level is reached, a correction back to 1.3985 may occur, followed by another leg higher toward 1.4070 and potentially 1.4111.
The scenario is confirmed by the Elliott Wave structure and a bullish matrix, with 1.3920 as the critical pivot. The price may first reach the upper edge of the Price Envelope at 1.4070 before retracing to 1.3985 and then continuing upward.
Technical Indicators: Indicate further gains toward 1.4070 and 1.4111.
XAUUSD (Gold) Forecast
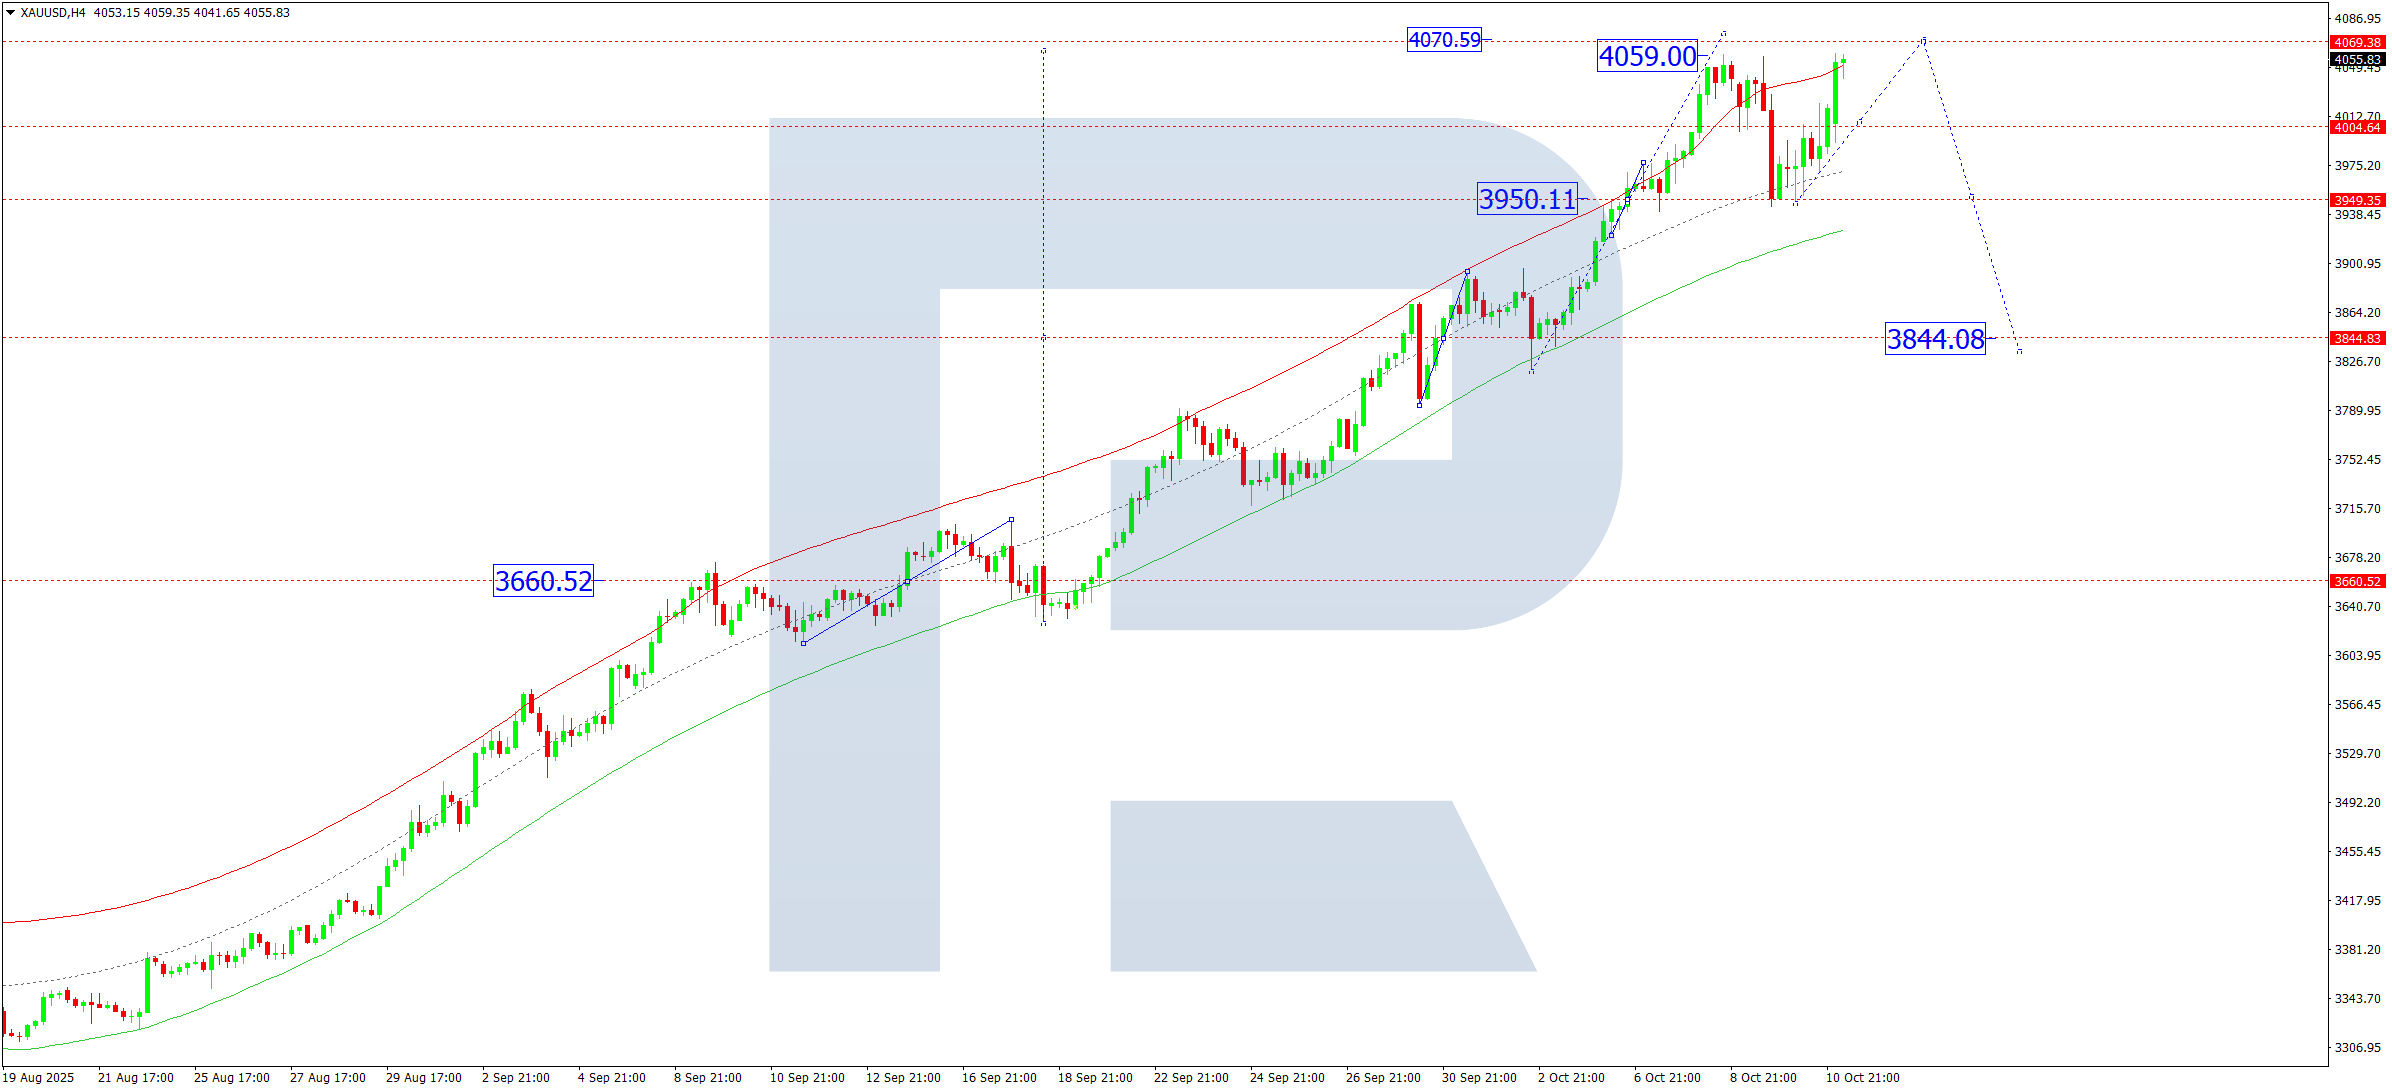
XAUUSD is currently advancing toward 4,078, which is expected to be reached today. A corrective pullback toward 3,950 may follow. Afterward, a new upswing toward 4,004 is likely, forming a consolidation around that level. A breakout to the upside could target 4,170, while a breakdown could push the price toward 3,844.
This bullish outlook aligns with Elliott Wave analysis and a positive wave structure, with 3,660 as the key pivot. Price action is targeting the upper Price Envelope boundary before a likely correction.
Technical Indicators: Suggest a potential peak near 4,078 followed by a correction to 3,950.
Brent Crude Oil Forecast
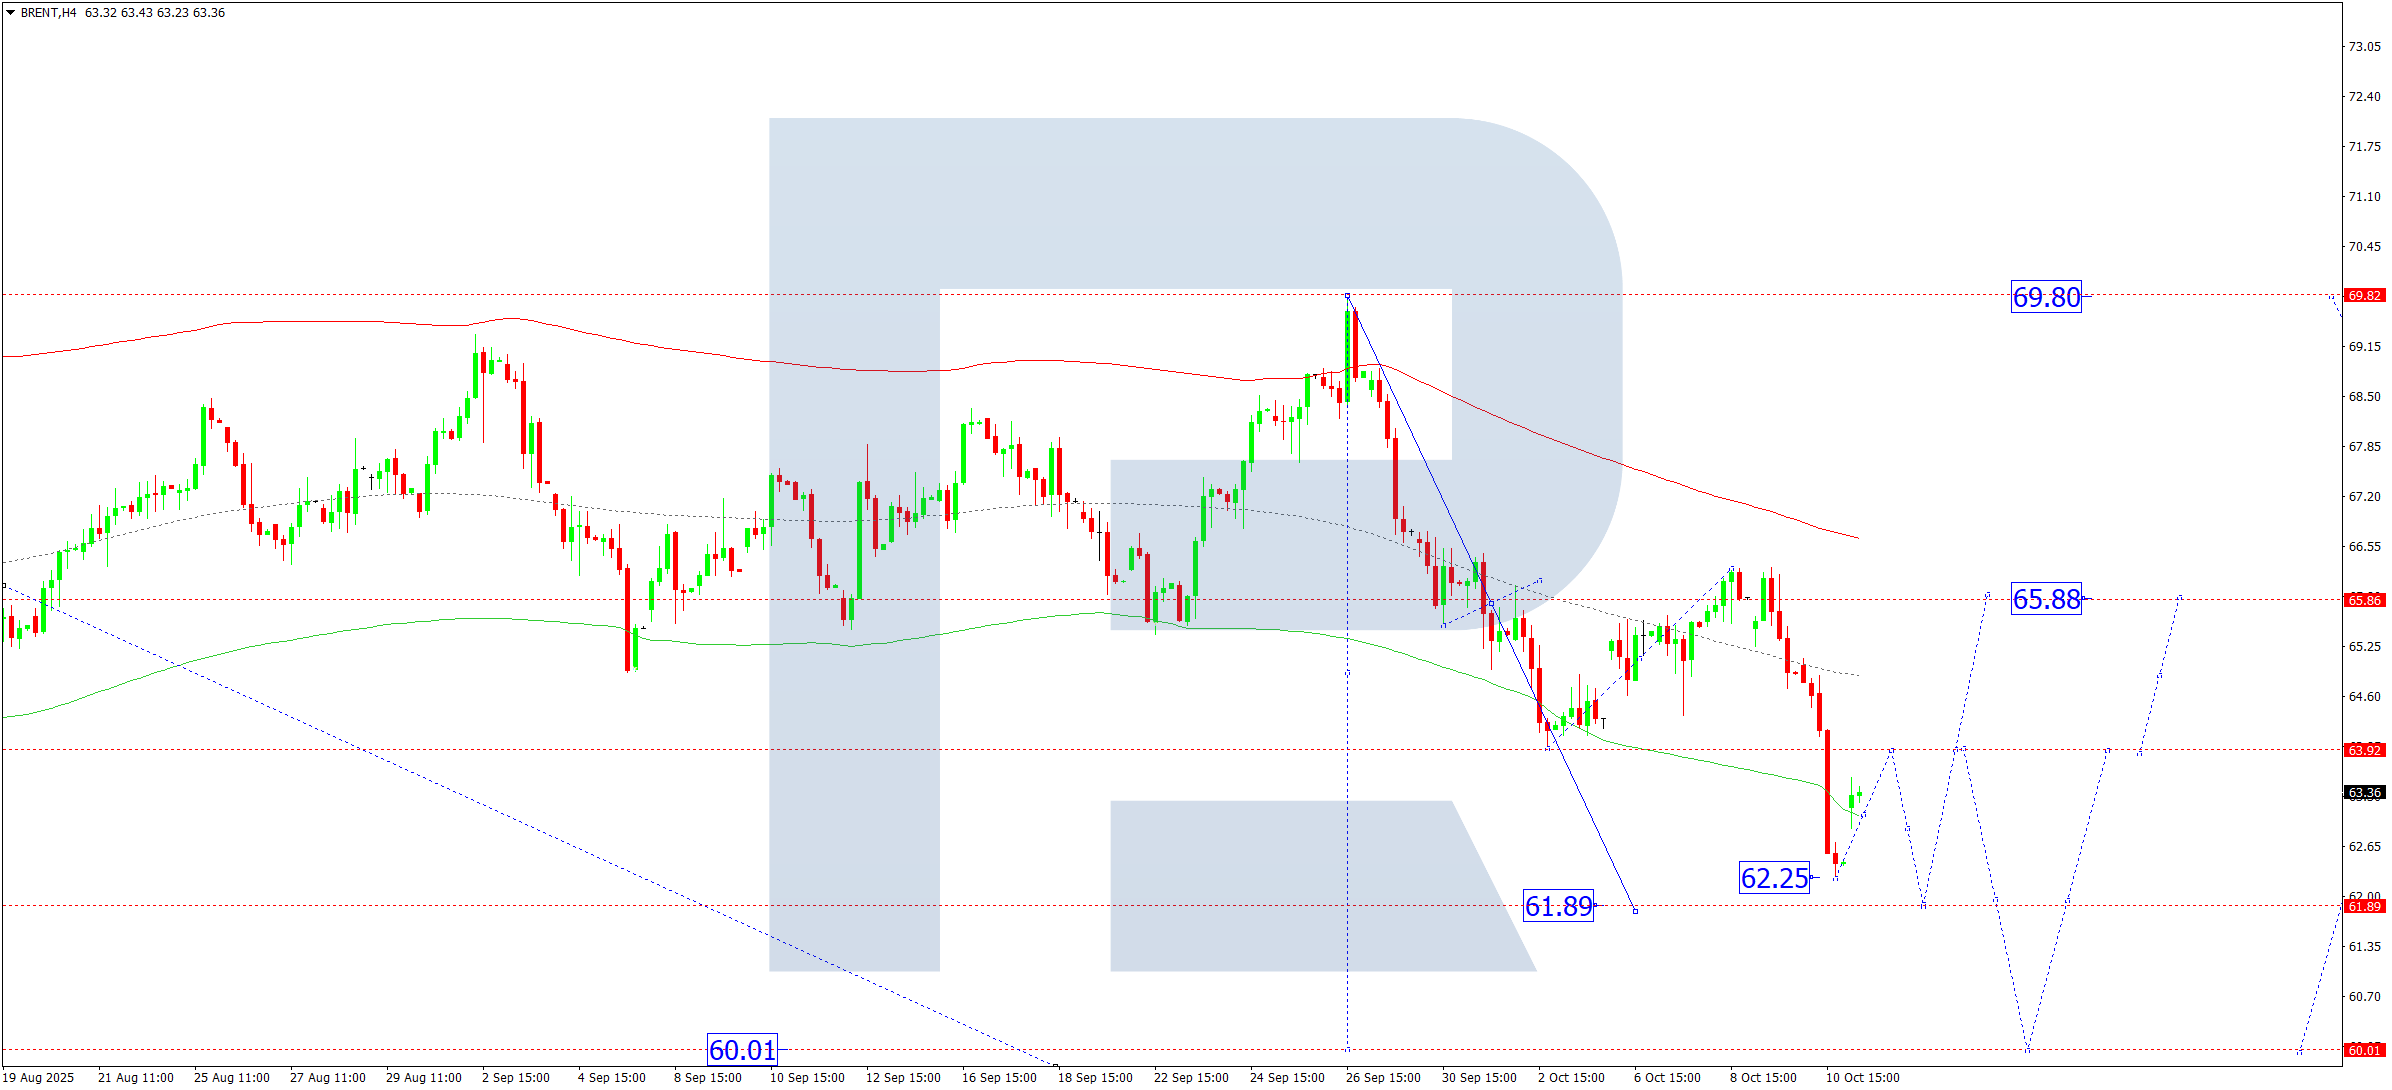
Brent crude has completed a downward move to 62.25. A rebound toward 63.90 is expected today. A broader consolidation is developing around 65.88. A breakout above this level could lead to 69.80, while a downward breakout may extend losses to 61.61 and possibly 60.00.
This forecast is supported by the Elliott Wave pattern and a bearish matrix, with a key pivot at 65.88. The price is moving within the lower region of the Price Envelope, indicating potential for a corrective rally followed by renewed downside.
Technical Indicators: Suggest a short-term correction to 63.90, followed by a possible decline toward 61.61.
Risk Warning: Past performance is not indicative of future results. Technical forecasts are based on chart patterns and mathematical models, and outcomes may vary due to market conditions.
Leave a Reply