
Daily Technical Analysis & Market Forecast – 16 October 2025
EURUSD Forecast
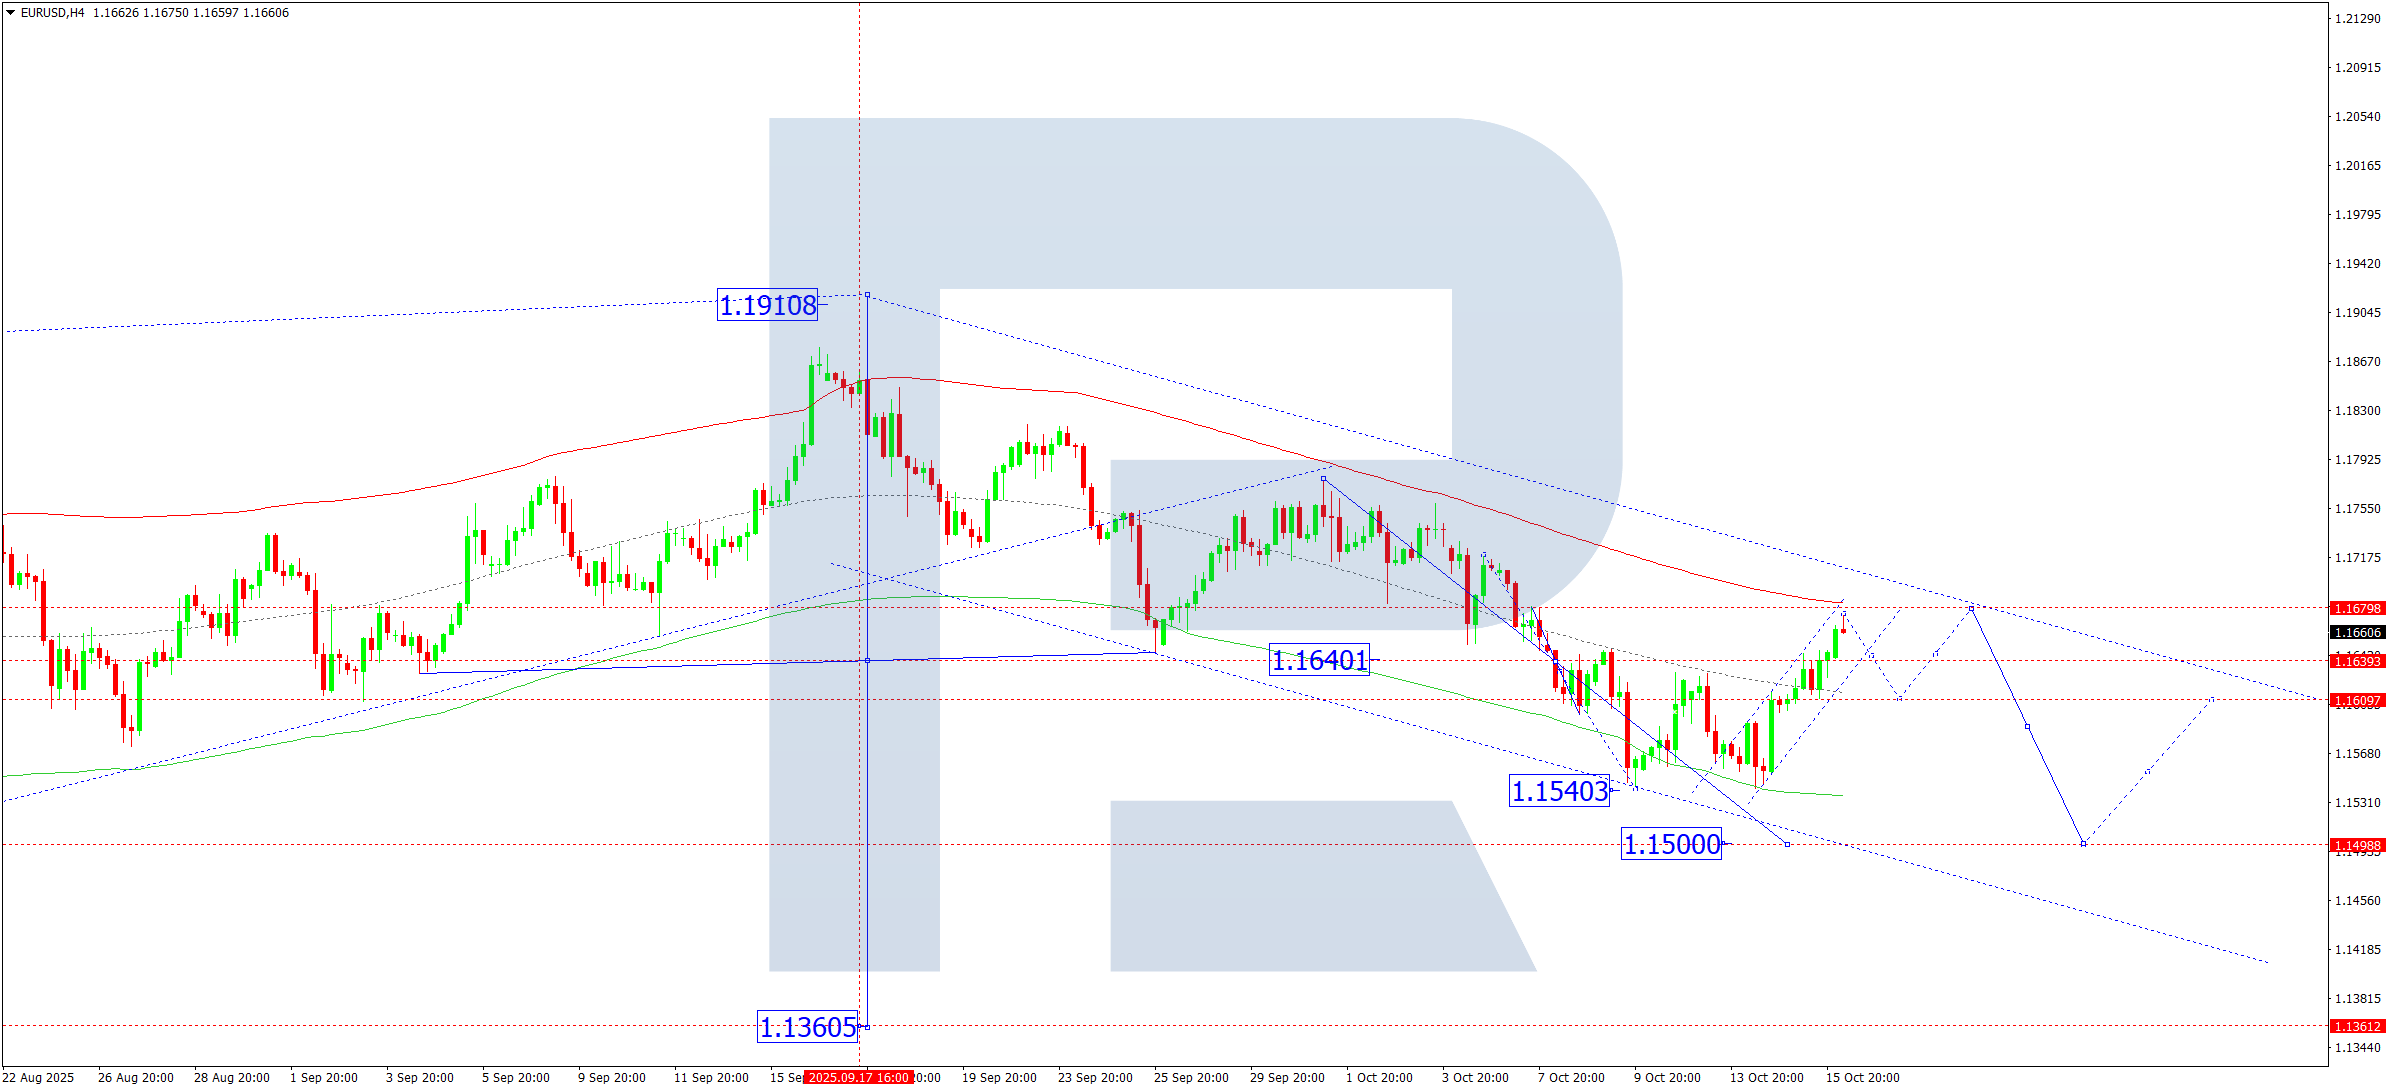
On the H4 chart, EURUSD has formed a consolidation zone around 1.1600. After breaking upwards, the pair advanced towards 1.1670. A pullback to 1.1600 is expected today to test it from above, potentially followed by a further move up to 1.1679. Once the correction completes, a new downward wave toward 1.1500 is likely, aligning with the local trend.
This outlook is supported by the Elliott Wave pattern and a bearish wave matrix, with a pivotal level at 1.1640. The price is expected to approach the upper edge of the Price Envelope near 1.1679, after which a decline toward the lower boundary around 1.1500 is anticipated.
Technical outlook: Bearish reversal expected after completing correction near 1.1679.
USDJPY Forecast
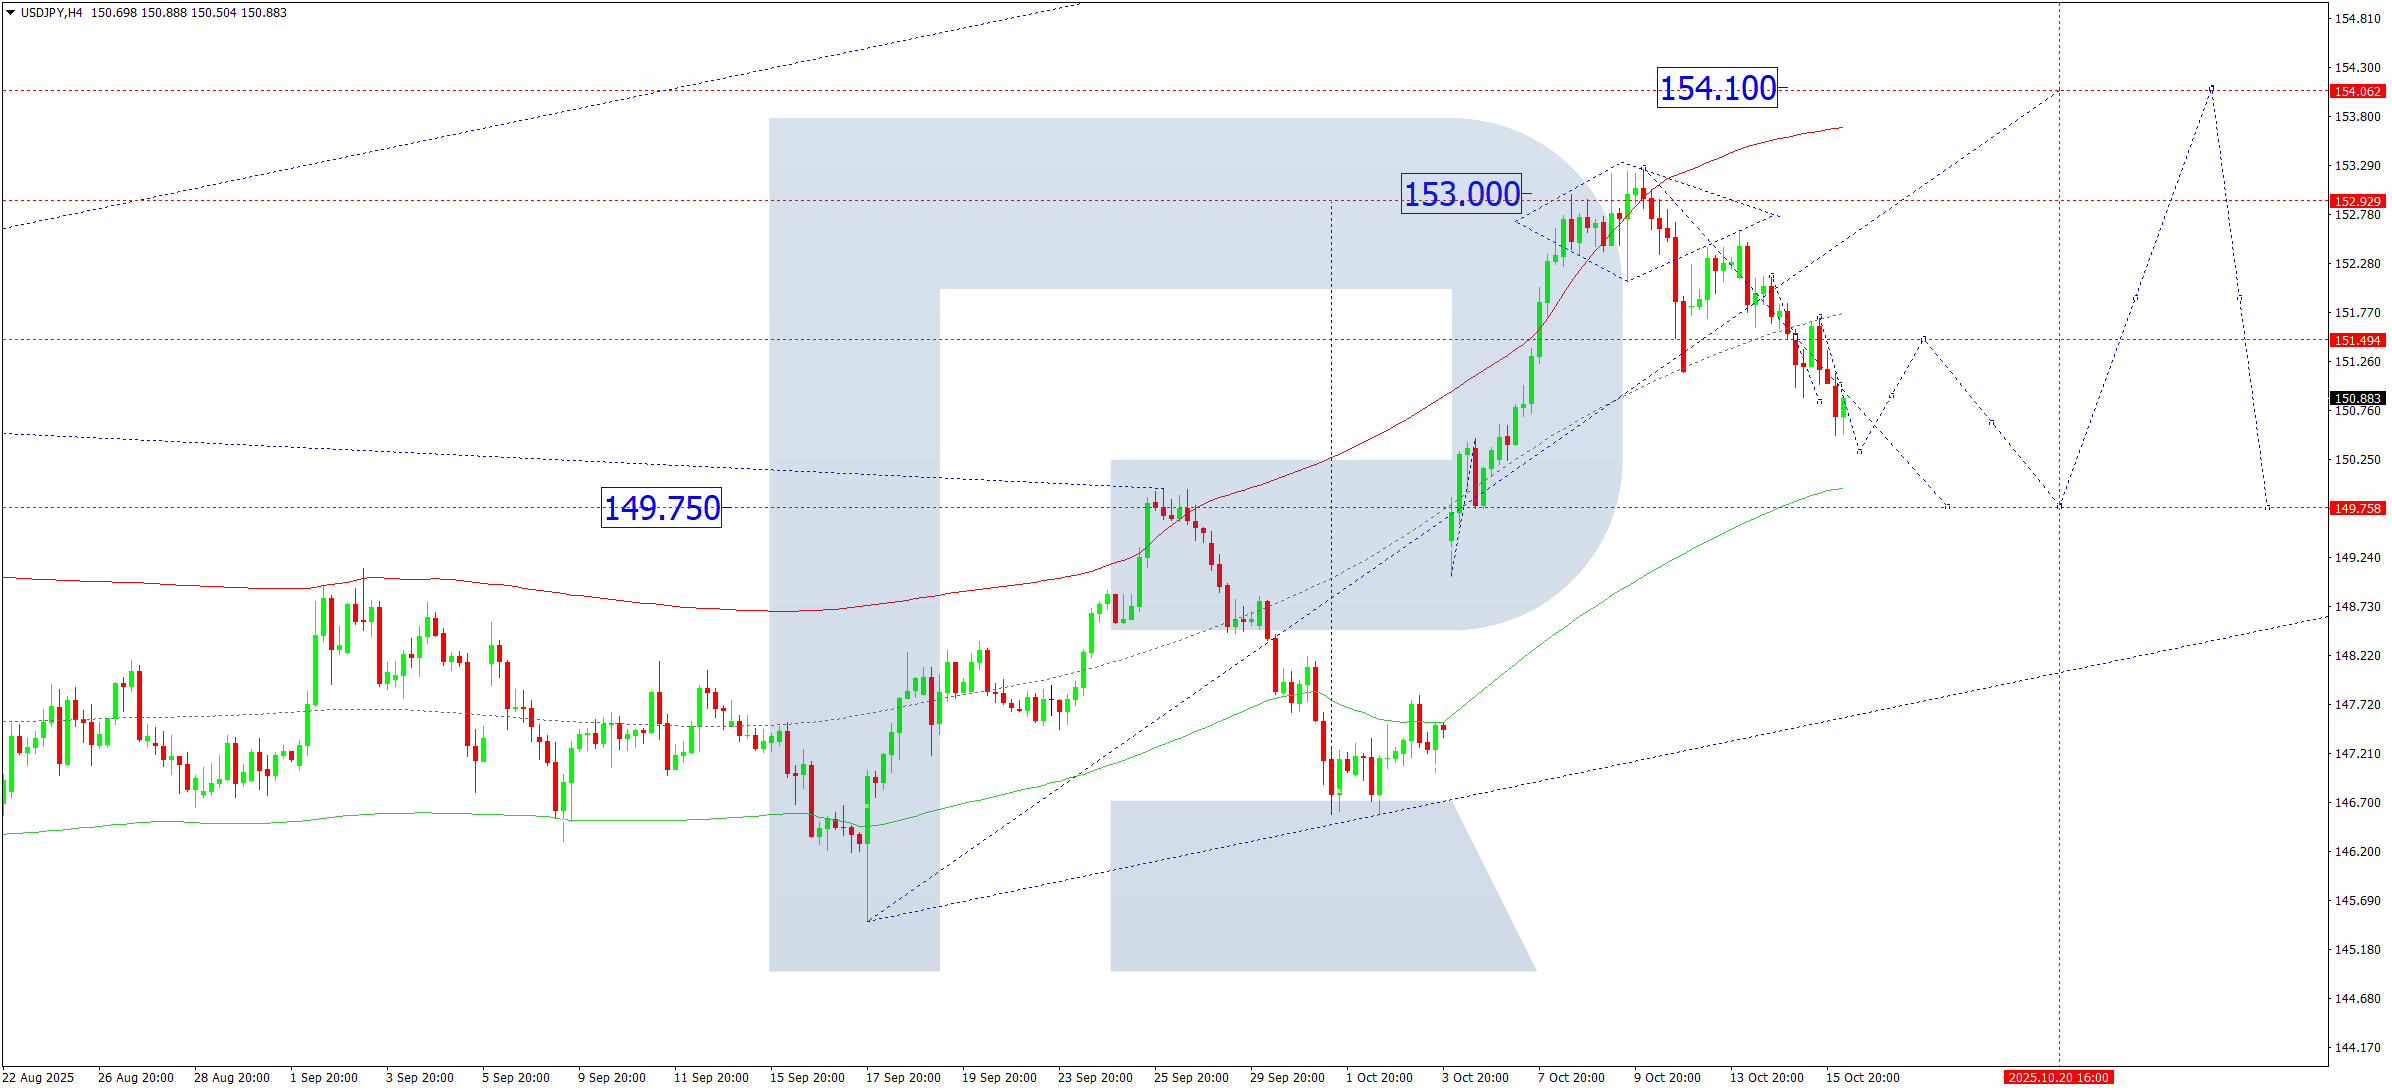
On the H4 chart, USDJPY remains in a correction phase, aiming for 150.40. Today, a touch of this level is expected, followed by a bounce towards 151.50. If the bearish move resumes, the next target is 149.75. Once the correction ends, an upward leg towards 154.10 may follow.
The Elliott Wave structure and bullish wave matrix point to a key pivot at 149.75, supporting the scenario of a continued climb post-correction.
Technical outlook: Expect movement to 150.40 and 149.75, followed by a rebound toward 154.10.
GBPUSD Forecast
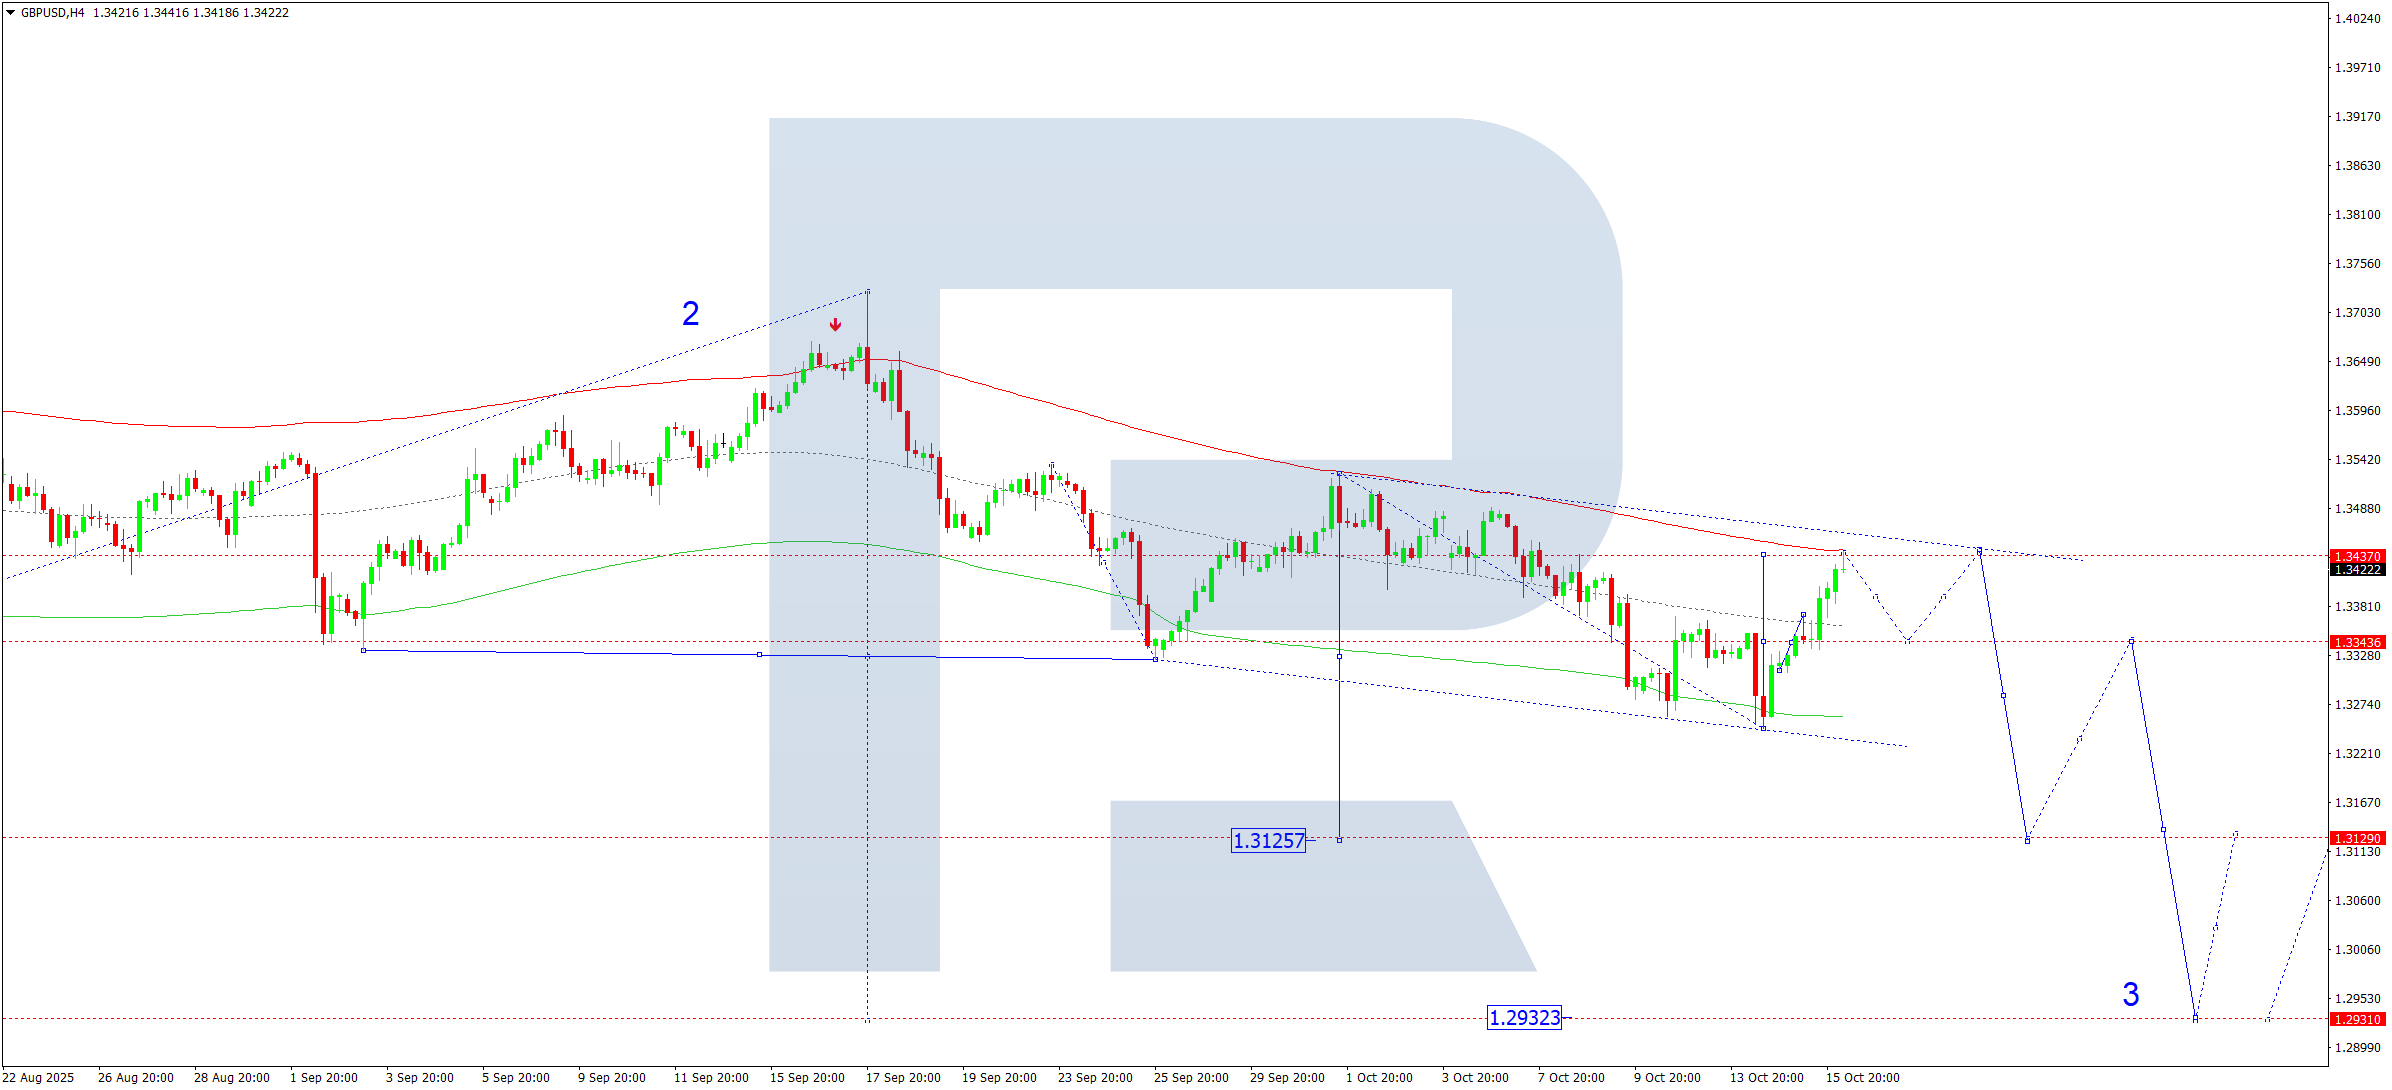
On the H4 timeframe, GBPUSD completed a correction to 1.3434 after consolidating near 1.3343. Today, a decline back to 1.3343 is expected. A break below this level would confirm a continued move down to 1.3125, with 1.3230 as an interim target.
The Elliott Wave analysis and a bearish wave matrix identify 1.3310 as a crucial level. The pair is trading below the midline of the Price Envelope, supporting the likelihood of a downward wave formation.
Technical outlook: Bearish pressure expected with targets at 1.3230 and 1.3125.
AUDUSD Forecast
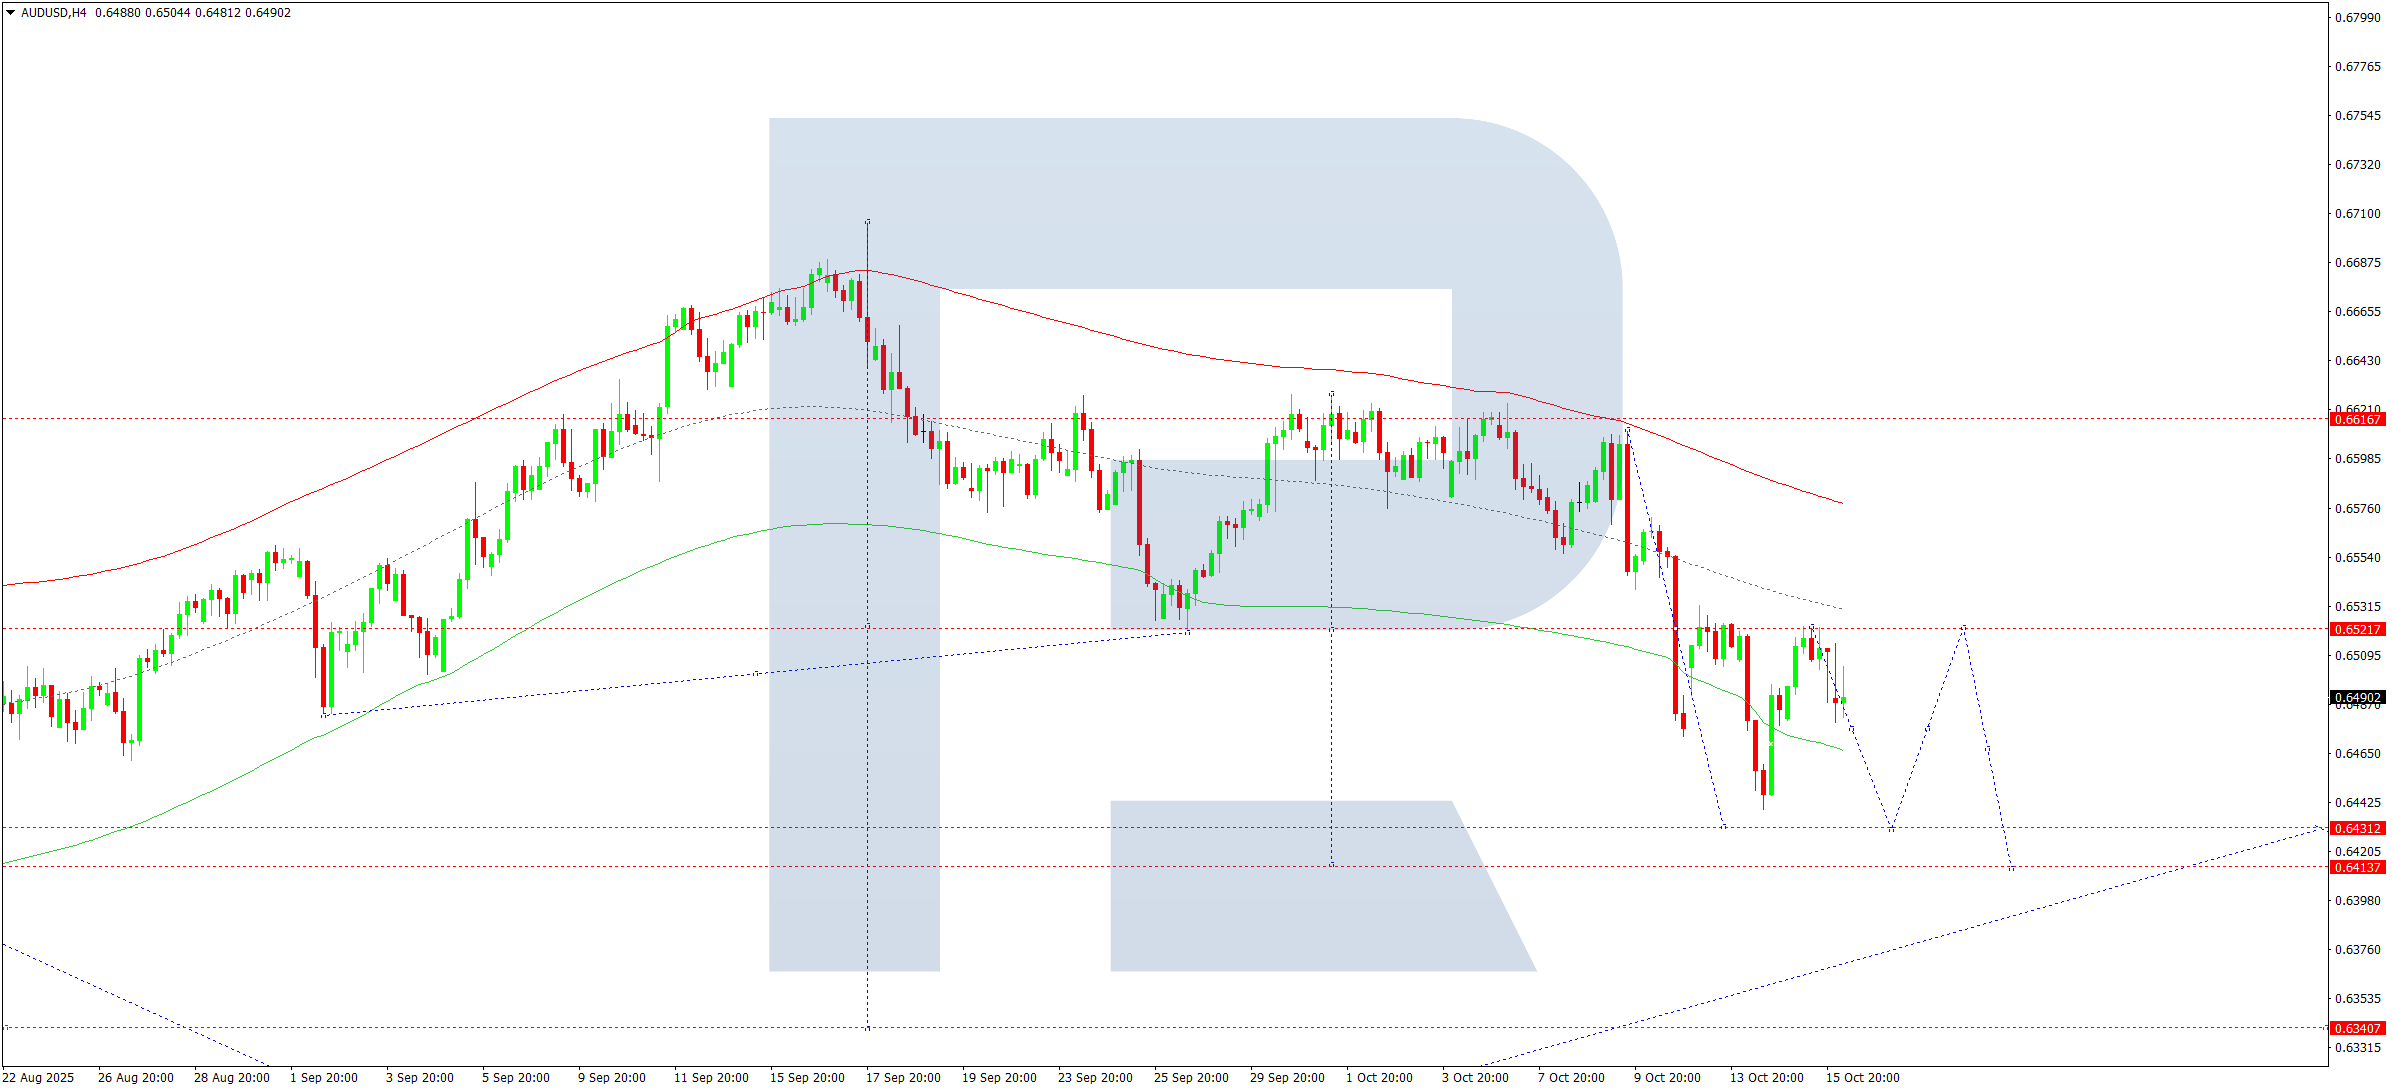
AUDUSD completed a corrective phase near 0.6520. A further decline is expected today toward 0.6431, possibly extending to 0.6410. After this, a rebound to 0.6520 may occur before the broader downtrend resumes with a target at 0.6340.
The bearish outlook is reinforced by the Elliott Wave count and a wave matrix pivoting at 0.6520, pointing to continued pressure toward the lower edge of the Price Envelope.
Technical outlook: Downtrend expected to continue toward 0.6410, with a potential retracement to 0.6520.
USDCAD Forecast
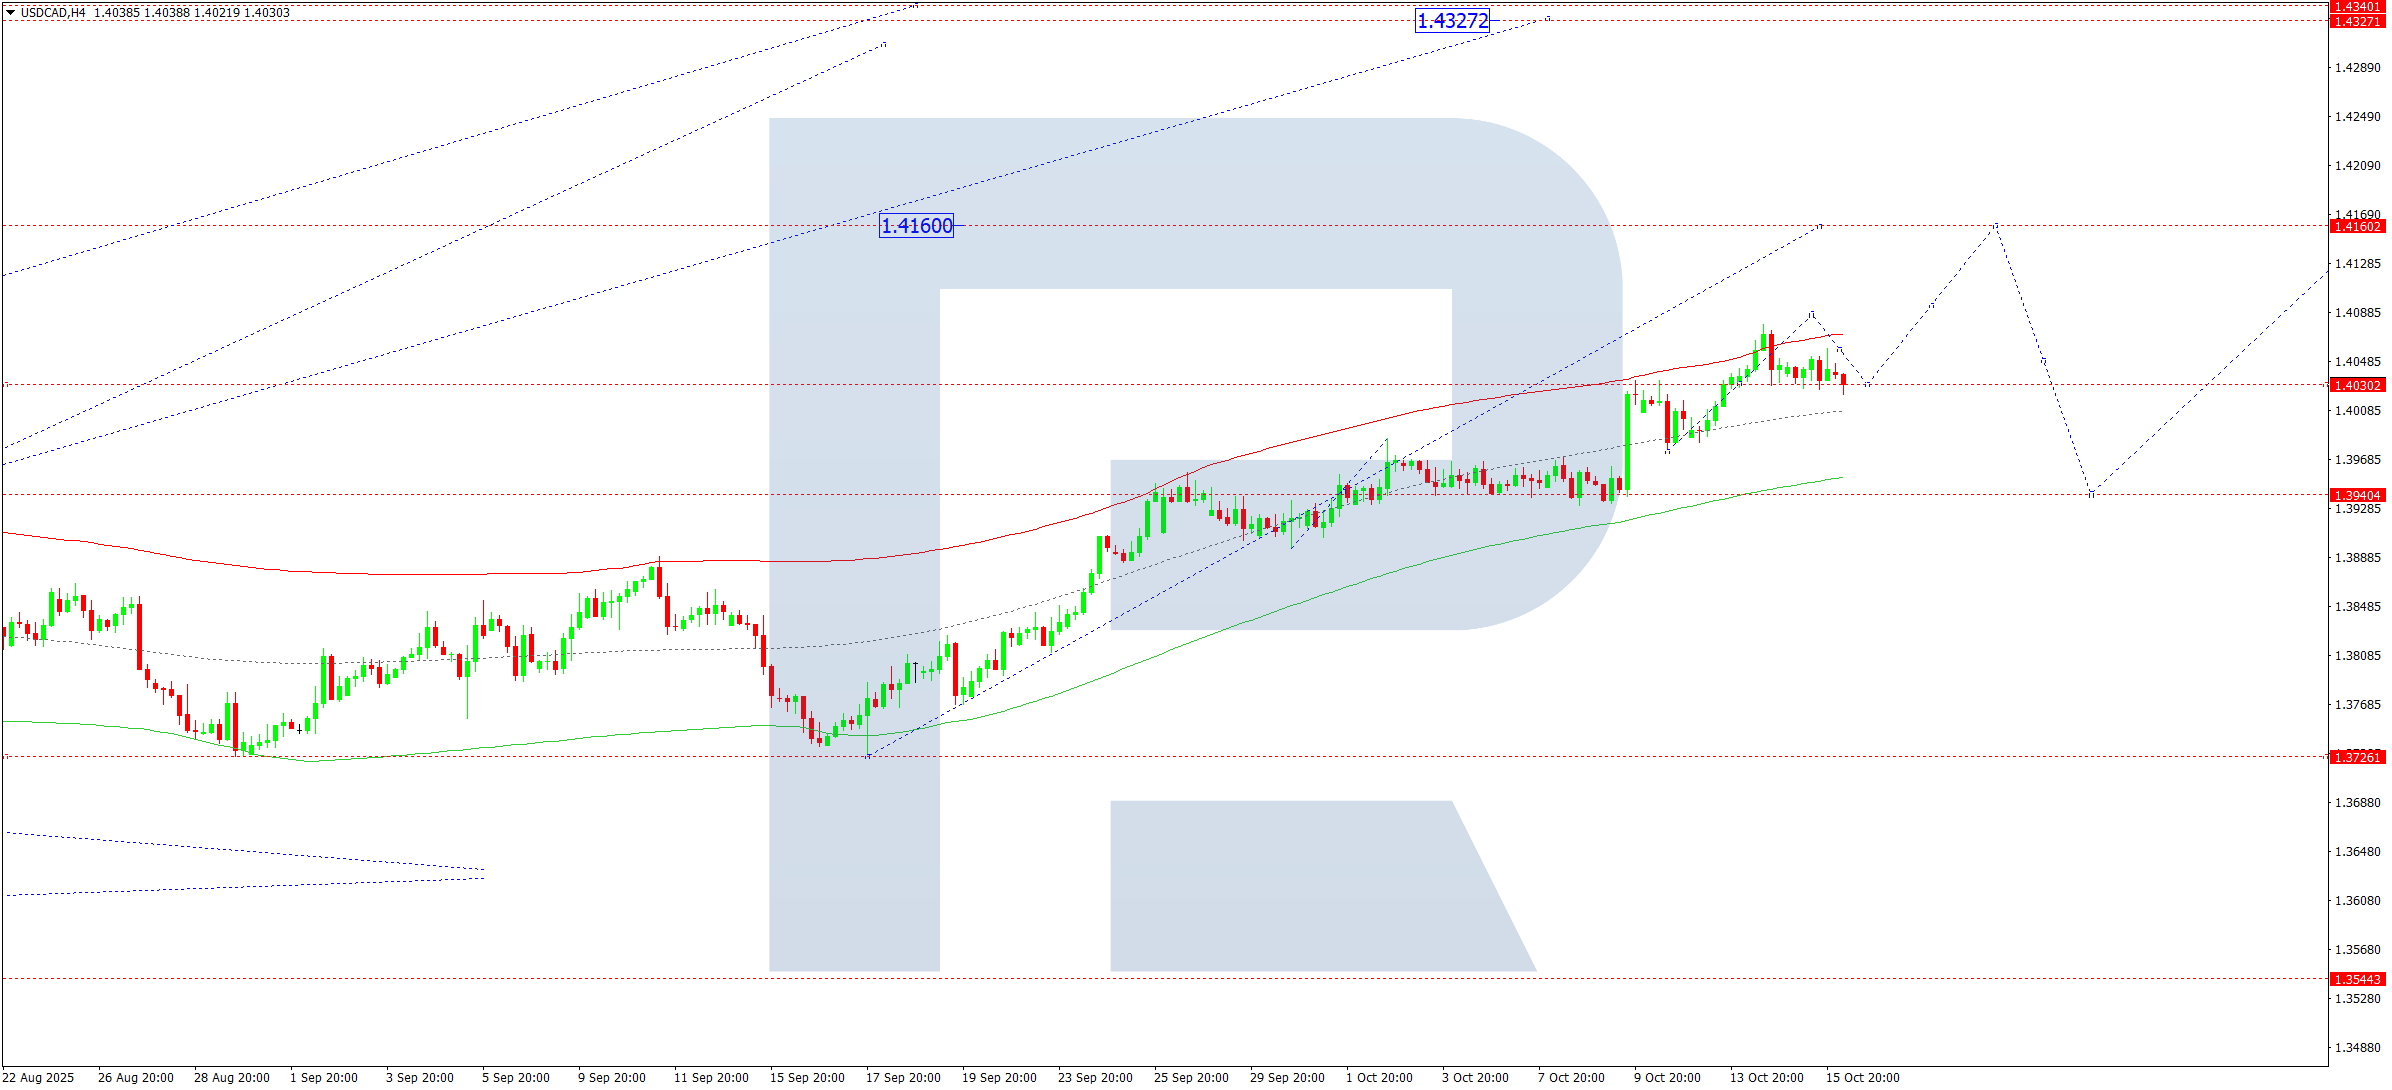
USDCAD is currently in a sideways range around 1.4030. A breakout to the downside would target 1.3940, while a move upward would confirm the beginning of a third bullish wave toward 1.4160. After that, a correction back to 1.3940 may follow.
This scenario aligns with the bullish Elliott Wave matrix, with 1.3940 as the key pivot. An upward extension to 1.4330 is possible once the correction is complete.
Technical outlook: Bullish move likely toward 1.4080 and 1.4160, with potential consolidation ahead.
XAUUSD (Gold) Forecast
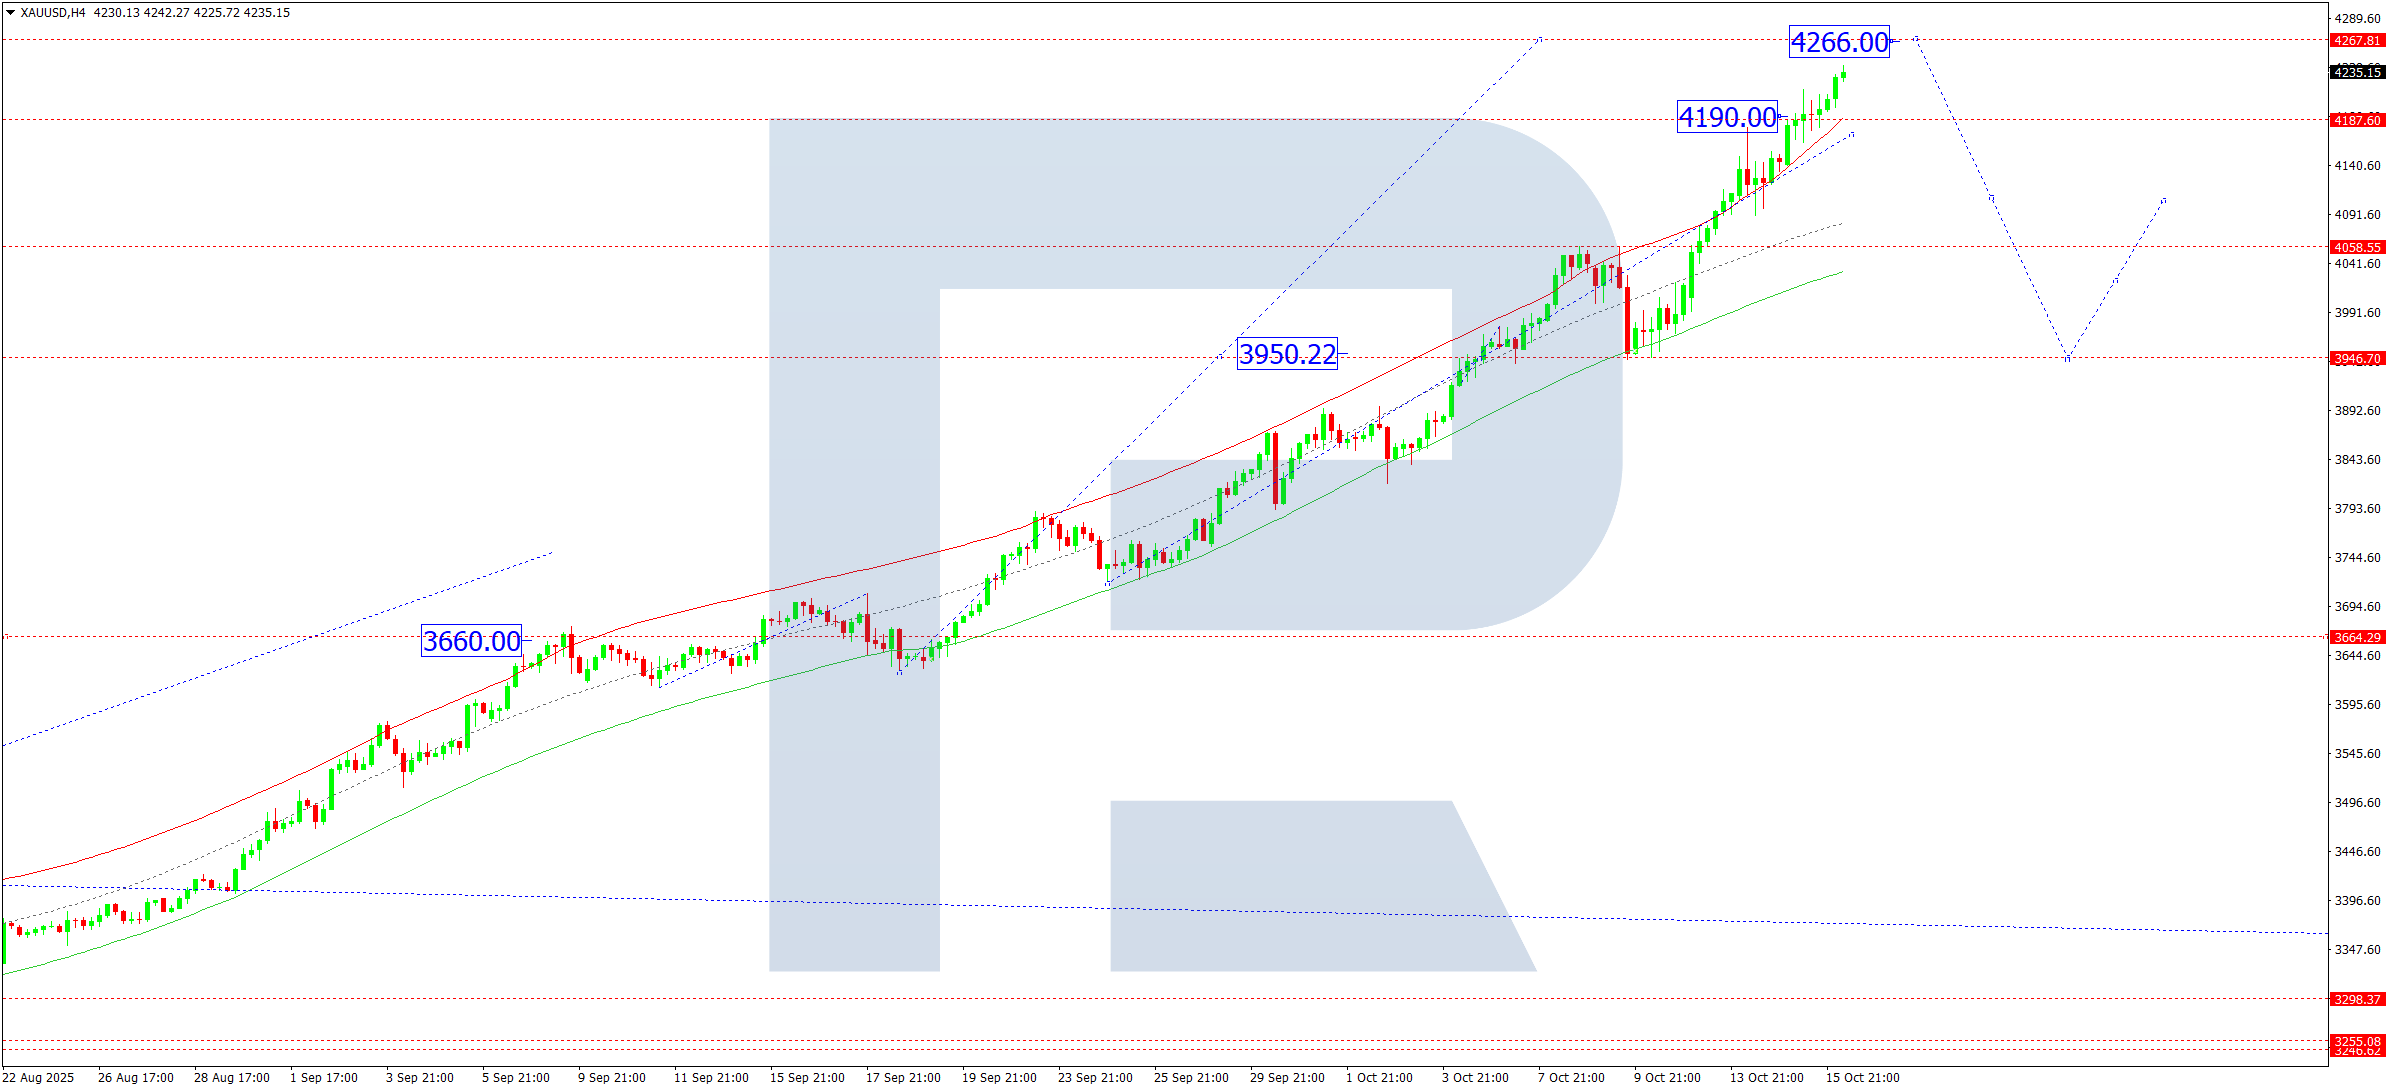
Gold reached 4,242, completing an upward wave. A correction toward 4,190 is possible today. If support holds, the next bullish target is 4,266, with potential for further upside toward 4,300. A break below 4,190 may lead to a deeper pullback to 3,950.
Elliott Wave structure and a bullish matrix indicate 3,660 as the long-term pivot. The current move is targeting the upper boundary of the Price Envelope near 4,266, before any significant retracement.
Technical outlook: Correction to 4,190 likely before a potential push to 4,266 and higher.
Brent Crude Oil Forecast
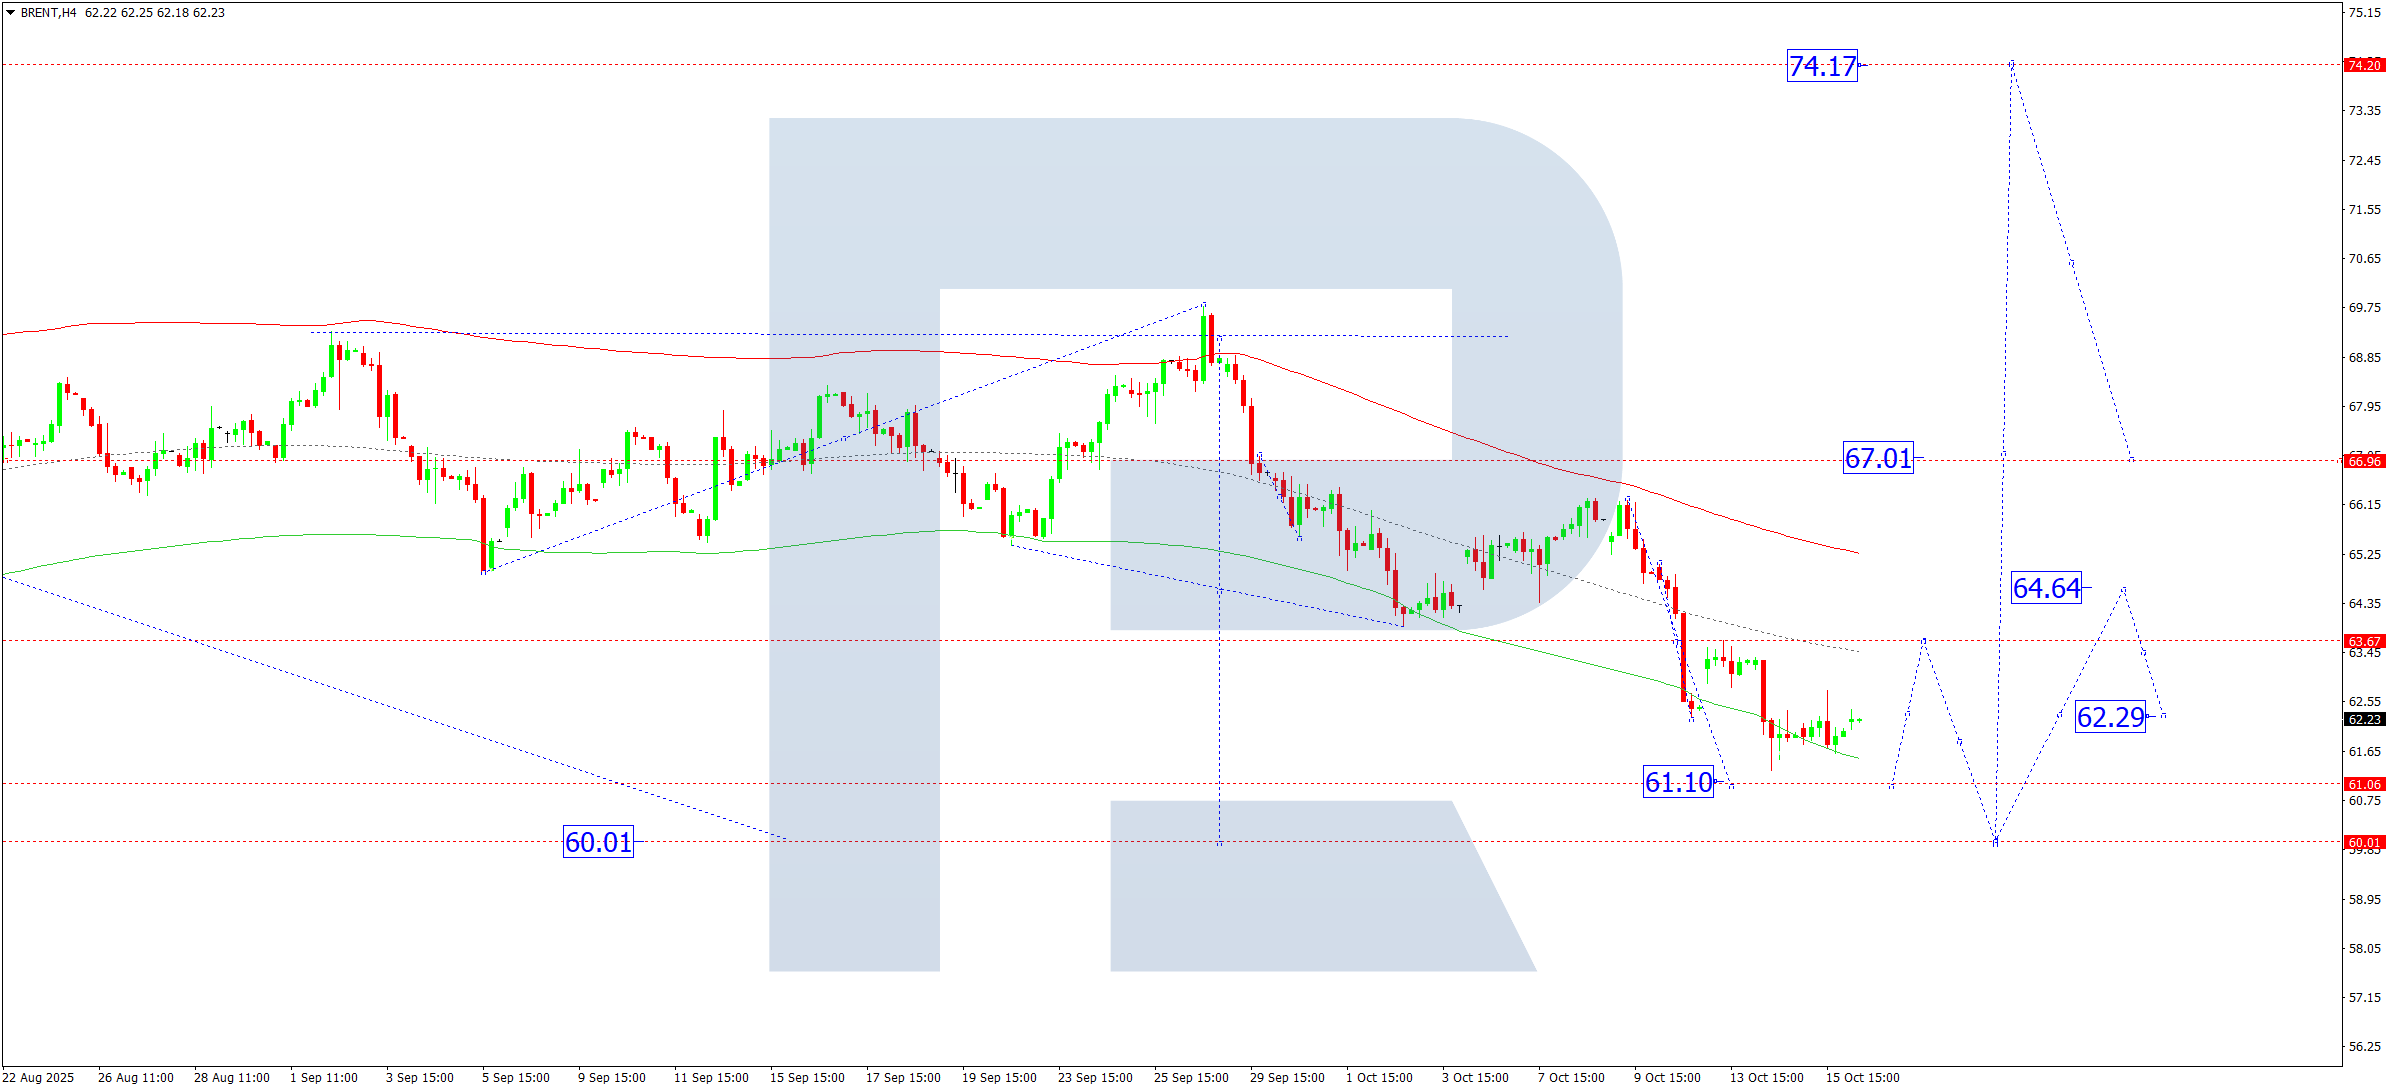
Brent is consolidating around 62.00. Today may see a move to 63.63 as a test of resistance. A breakout above could signal a rally toward 67.00, while a failure may send the price down to 61.10, with 60.00 as a potential extension.
Elliott Wave analysis and the bearish matrix point to 63.63 as a key pivot. Price action suggests a possible move toward the upper boundary of the range before resuming the downtrend.
Technical outlook: Possible short-term rise to 63.63, followed by a decline toward 61.10.
Risk Disclaimer:
Past performance is not indicative of future results. This analysis is for informational purposes only and does not constitute financial advice. Always manage risk carefully and consider your own financial situation before making trading decisions.
Leave a Reply