
Daily Technical Analysis and Forecast — 23 October 2025
EURUSD Forecast
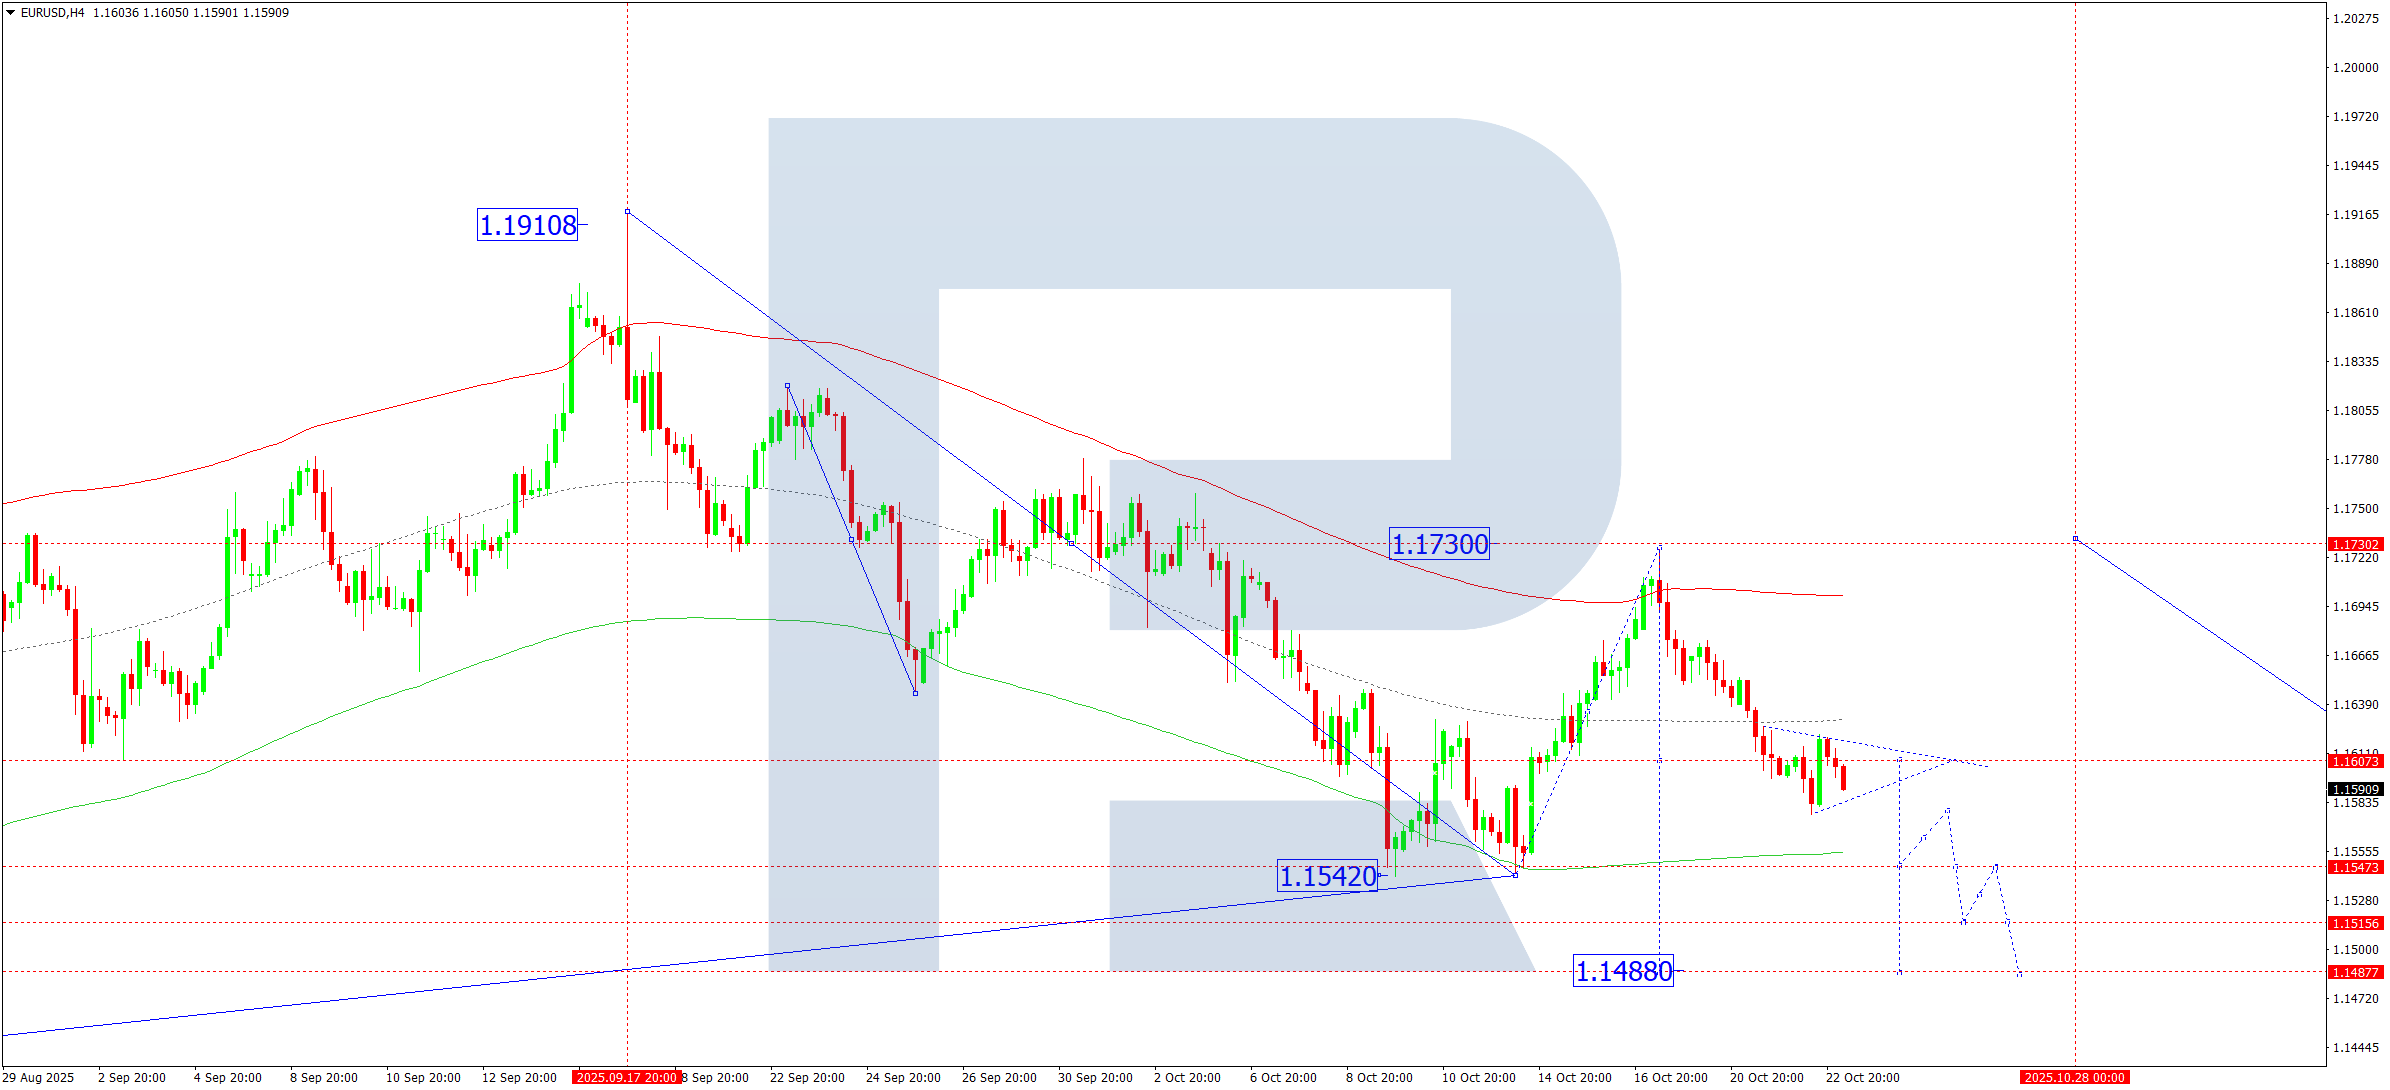
On the H4 chart, EURUSD has completed a downward wave toward 1.1577 and is currently consolidating around 1.1606.
If the range breaks to the upside, a corrective rise towards 1.1666 is likely. A downside breakout, however, may extend the decline to 1.1540 and possibly 1.1488, marking the midpoint of the third bearish wave within the broader downtrend.
This scenario aligns with the Elliott Wave structure and a bearish wave matrix, with a key pivot at 1.1730. A decline toward the lower band of the Price Envelope at 1.1540 is expected, followed by a potential rebound to the central line near 1.1606.
Outlook: Technical indicators favor a move lower toward 1.1540.
USDJPY Forecast
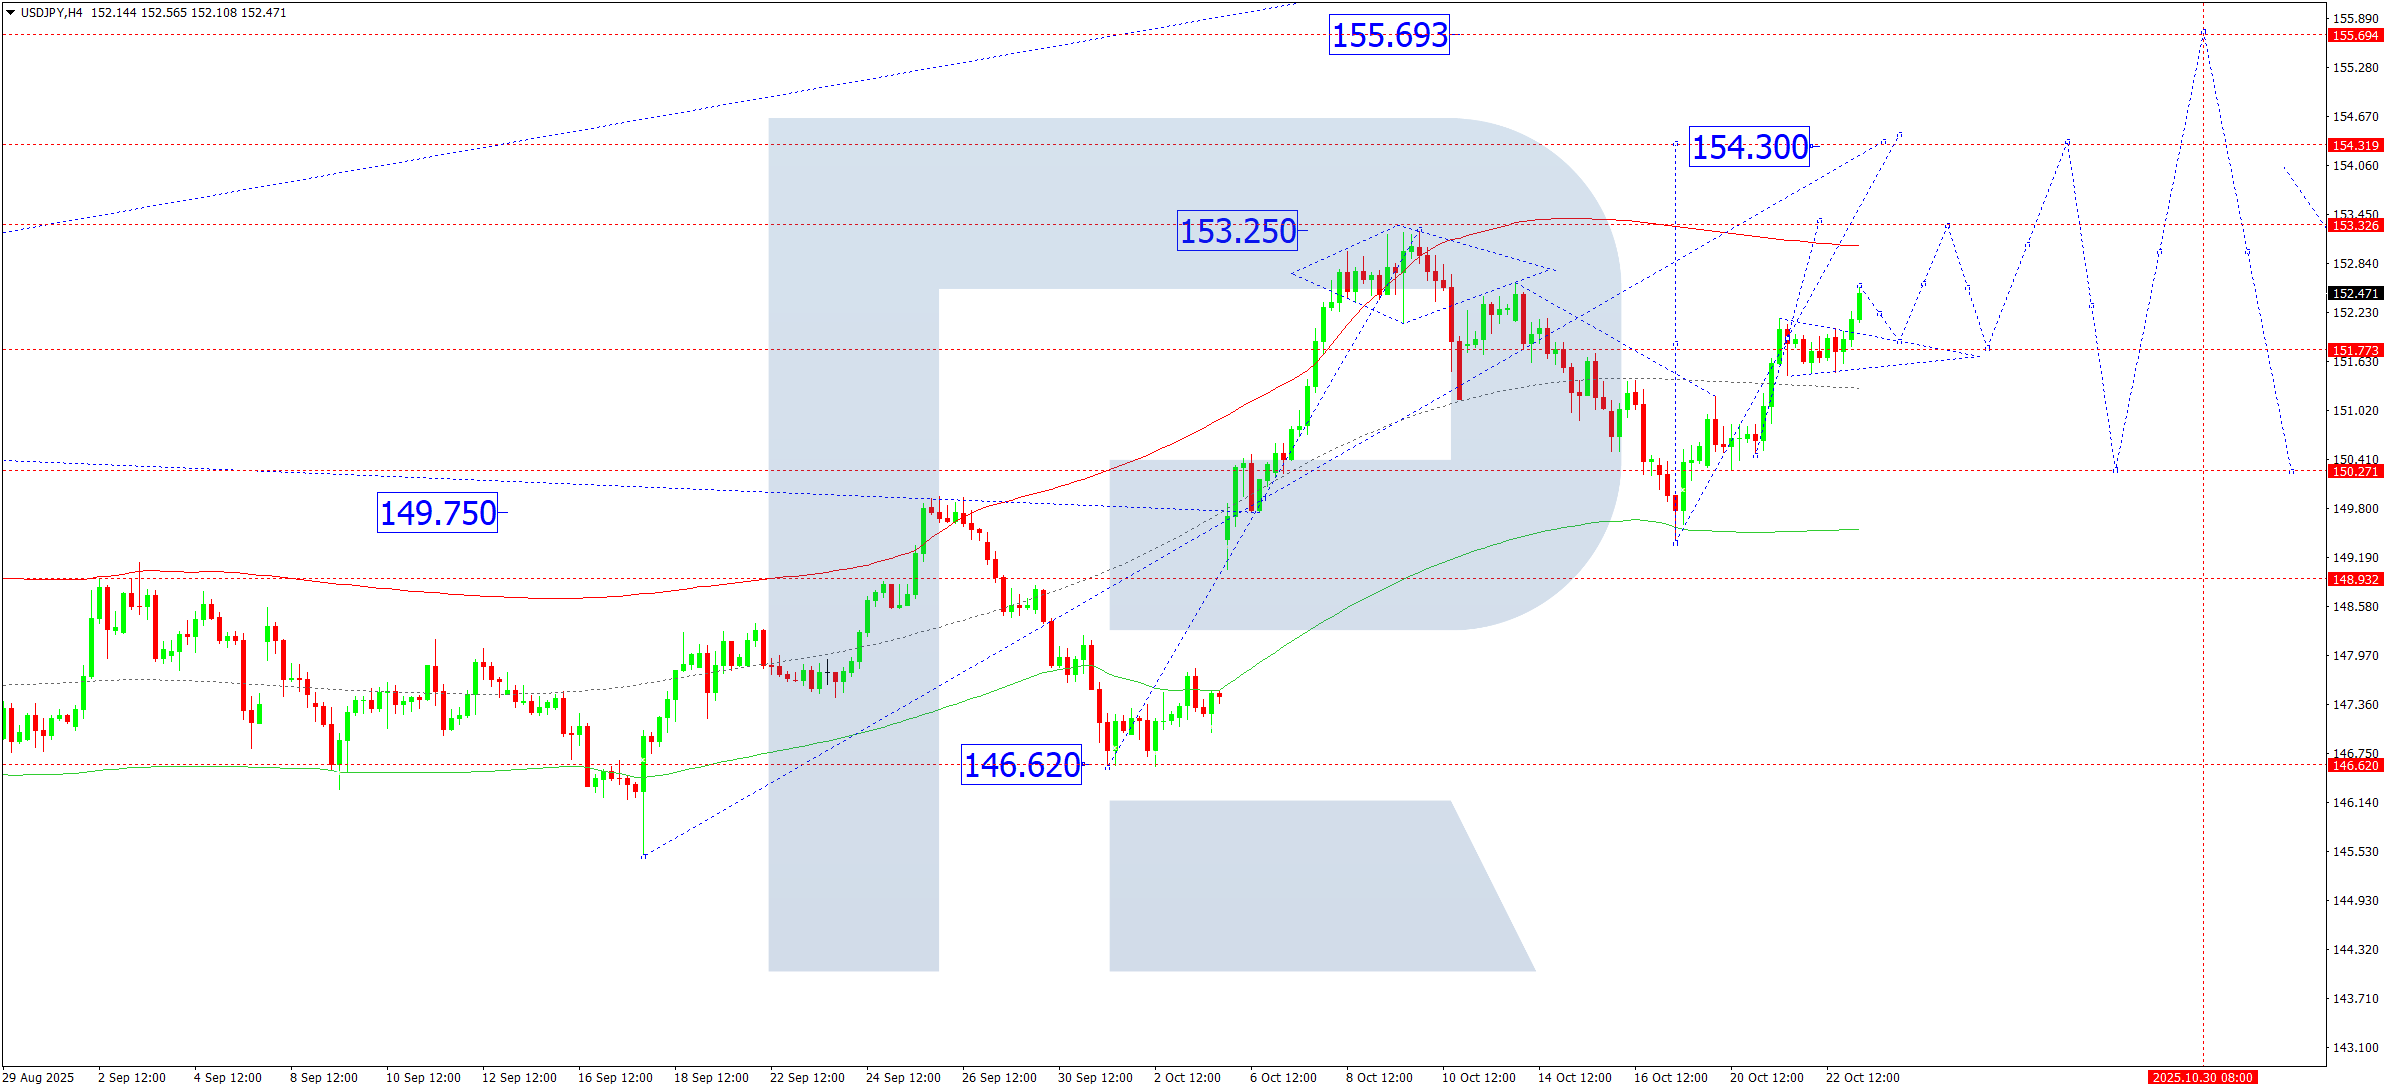
On the H4 chart, USDJPY has consolidated around 151.77 and recently broke upward.
The pair is expected to continue its rise toward 153.25, and a breakout above this level may drive further growth to 154.30.
The bullish scenario is confirmed by the Elliott Wave formation and wave matrix, with a key pivot at 149.75. The pair is now positioned near the central line of the Price Envelope at 151.77, with upside potential toward the upper boundary at 154.30.
Outlook: Technical indicators point to further gains toward 154.30.
GBPUSD Forecast
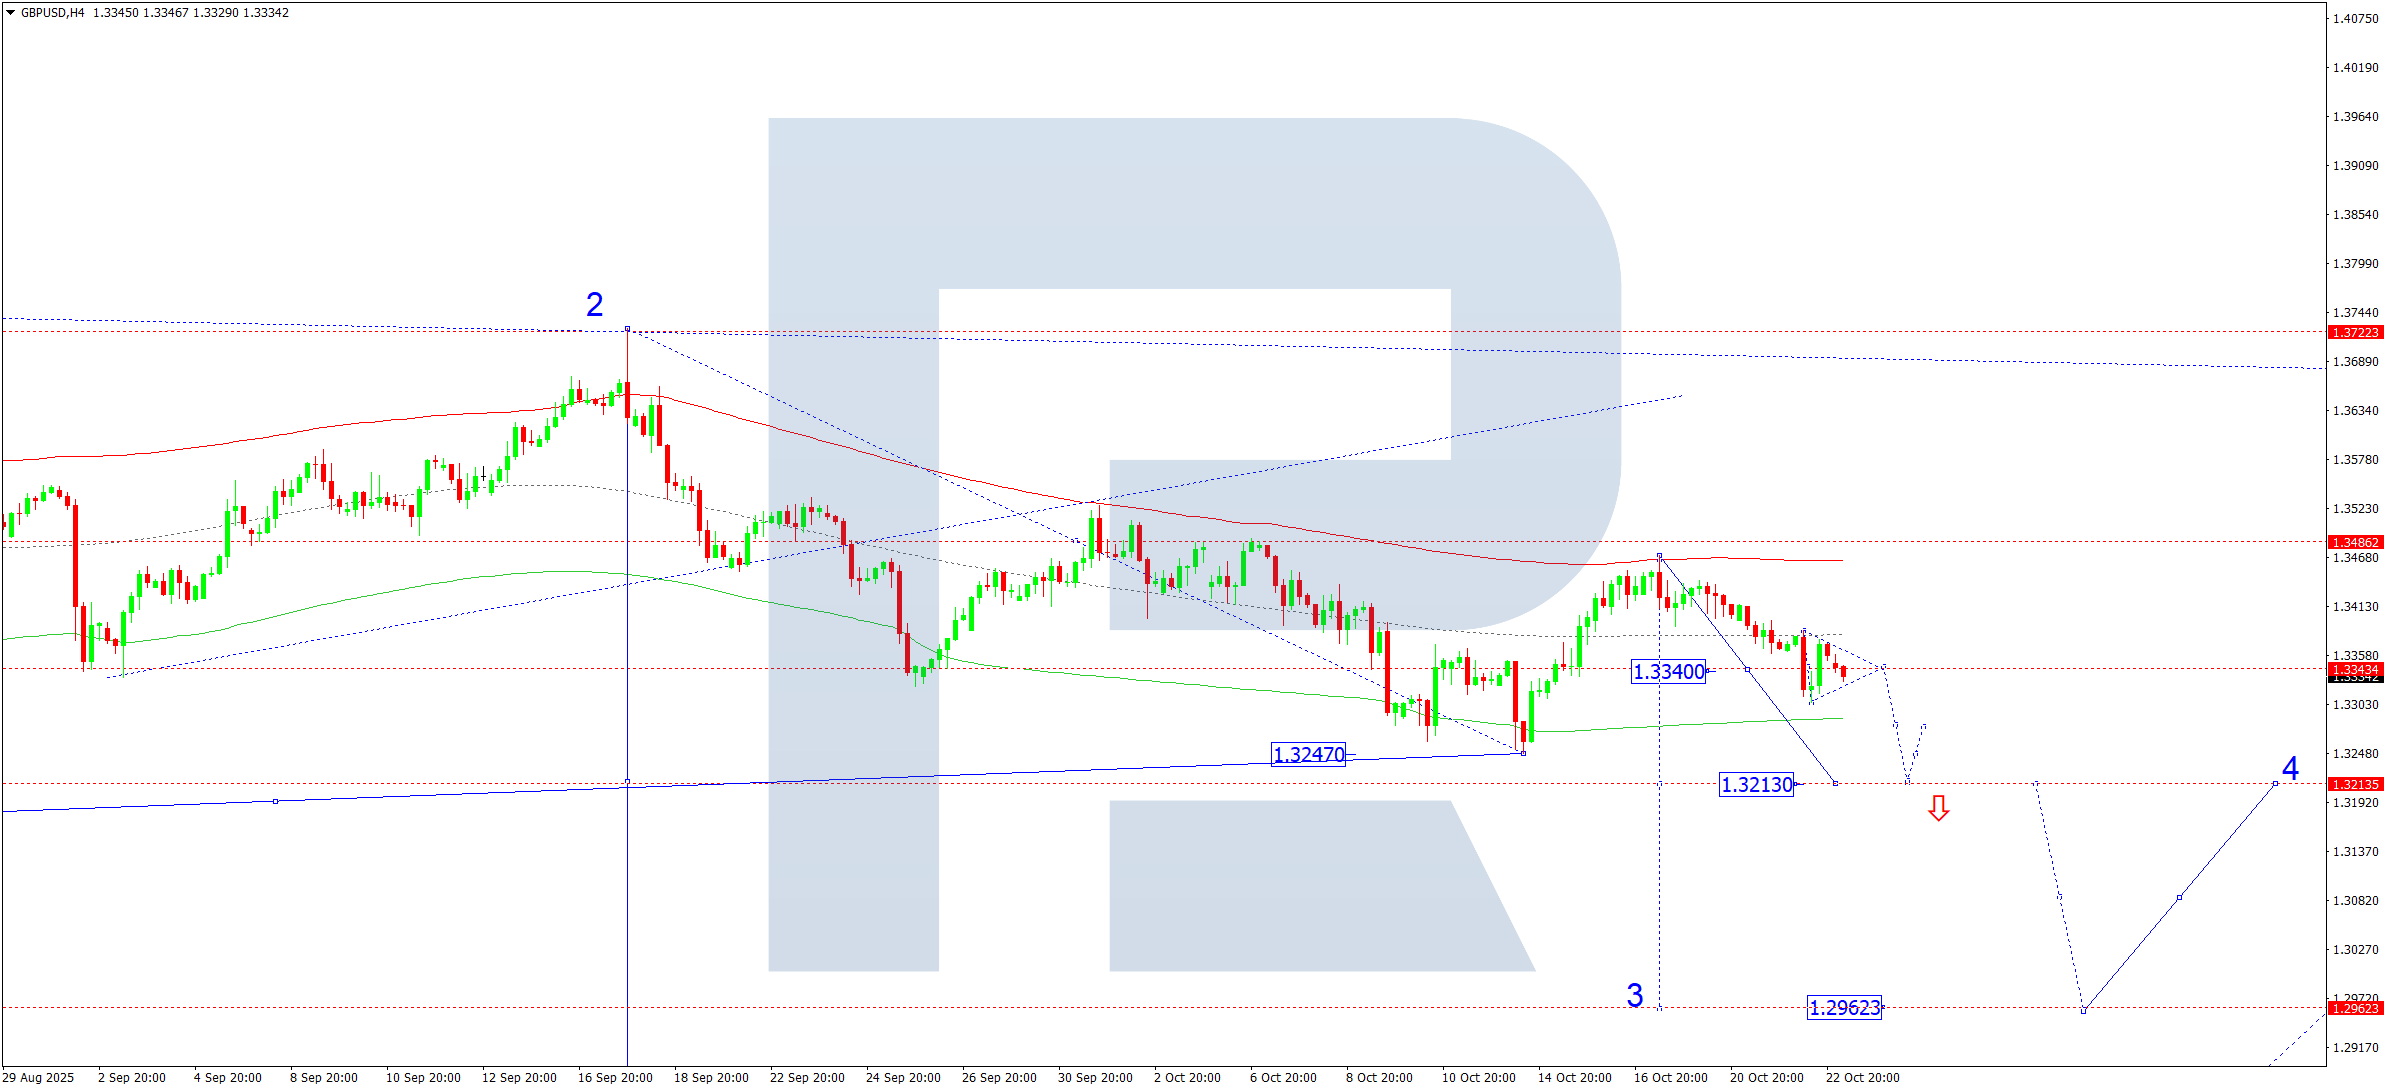
On the H4 chart, GBPUSD has been consolidating around 1.3340.
A breakout to the upside could trigger a short-term correction to 1.3400, while a break lower would likely extend the third downward wave toward 1.3213, continuing the prevailing bearish trend.
This view is supported by the Elliott Wave and bearish matrix setup, with a key pivot level at 1.3490. The pair is trading near the central line of the Price Envelope at 1.3340, with expectations of a move toward the lower boundary at 1.3213.
Outlook: Indicators suggest further decline toward 1.3213.
AUDUSD Forecast
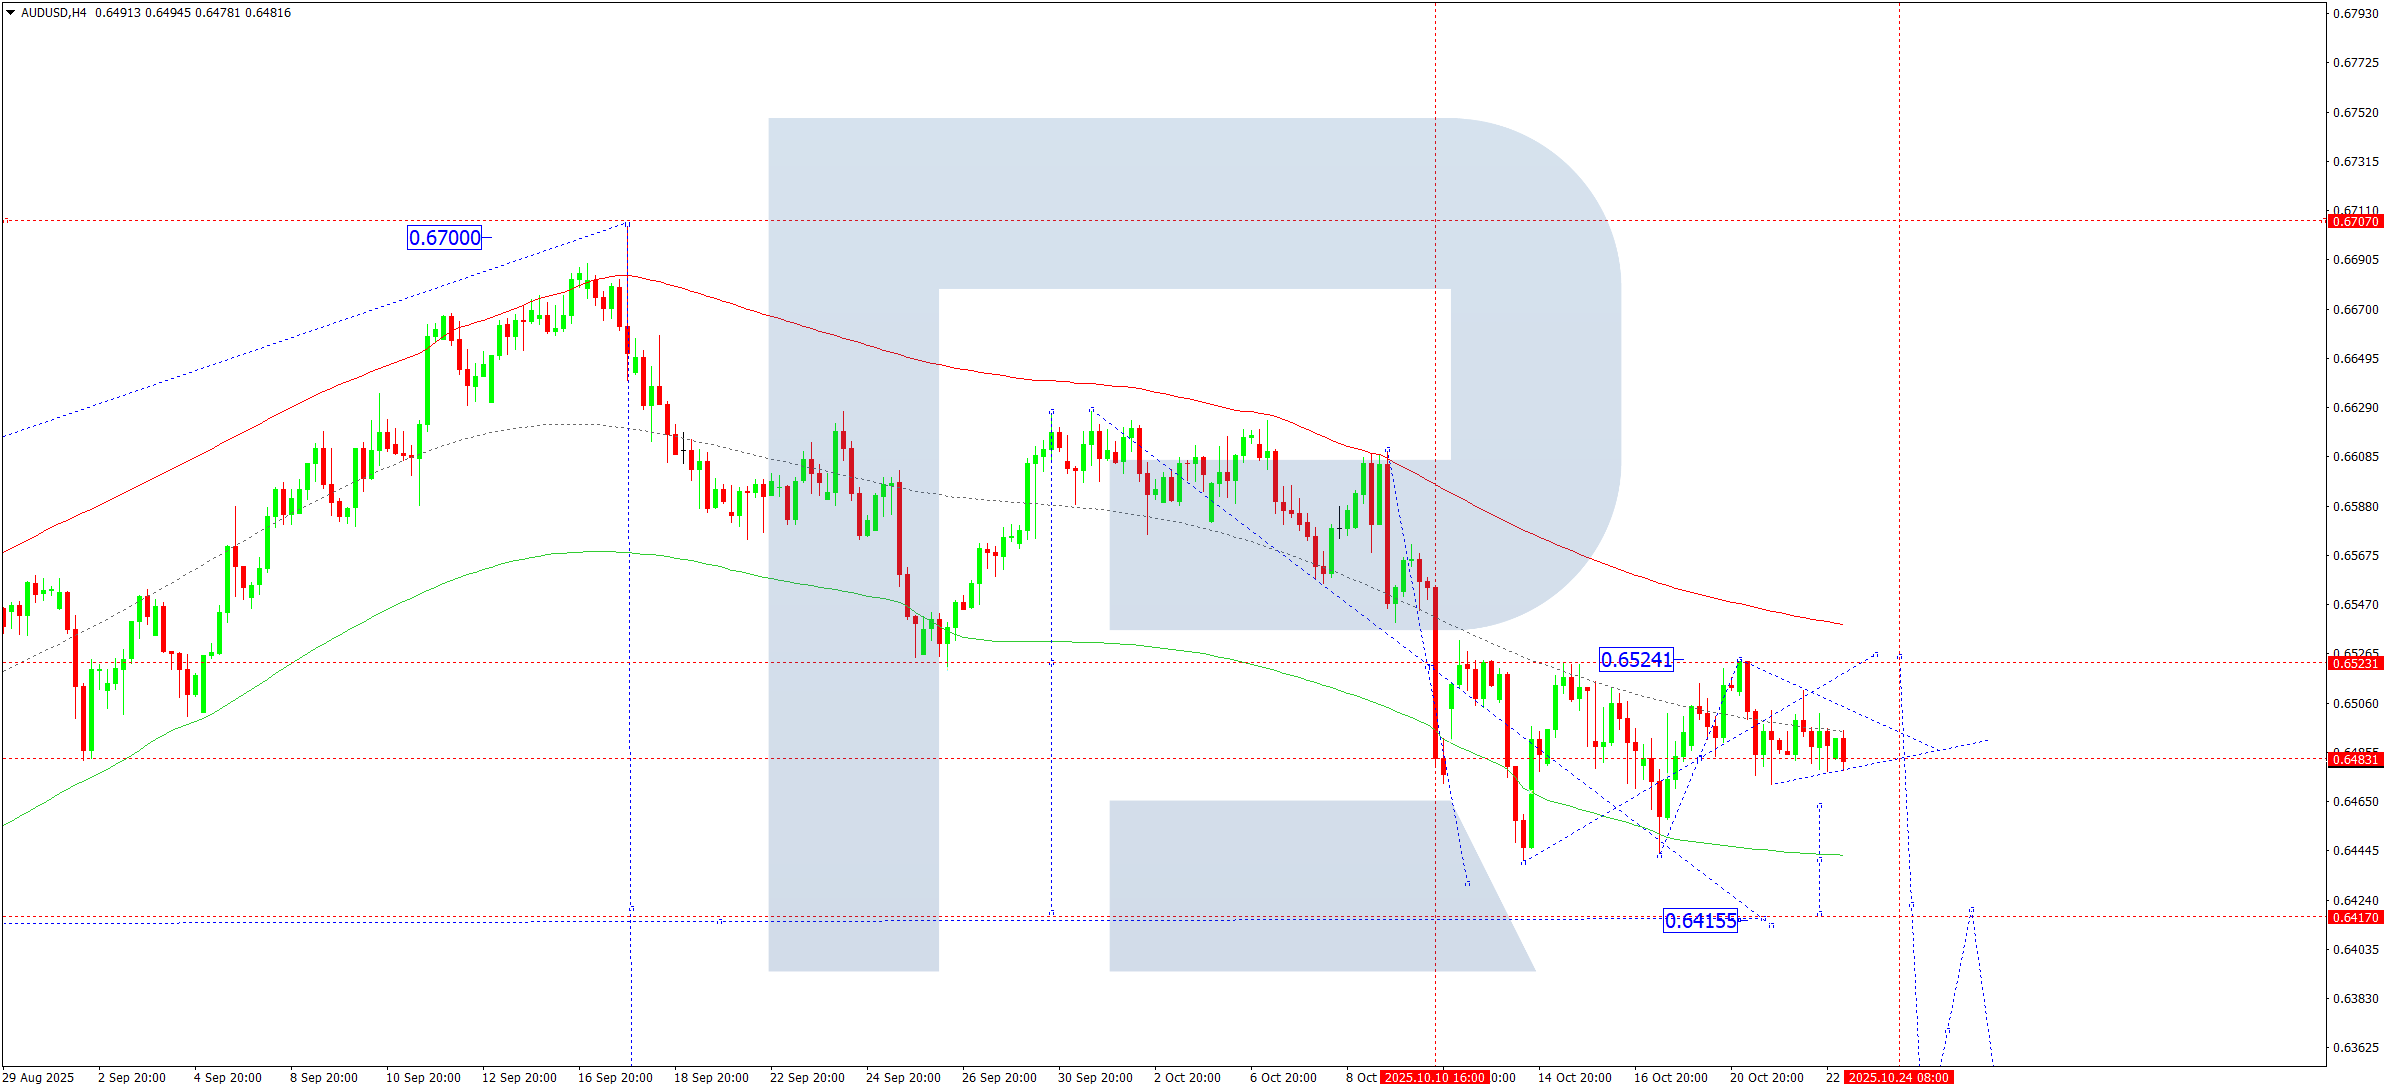
On the H4 chart, AUDUSD continues to trade within a tight consolidation zone around 0.6484.
An upward breakout could lift the pair to 0.6525, while a downside move would likely push it toward 0.6415.
The Elliott Wave structure supports a bearish outlook, with a key pivot at 0.6525. The pair previously tested the lower Price Envelope boundary at 0.6440 and corrected to the midpoint near 0.6524. A short-term rise to 0.6530 remains possible before the next downward phase toward 0.6415.
Outlook: Expect a brief rise to 0.6530, followed by a decline to 0.6415.
USDCAD Forecast
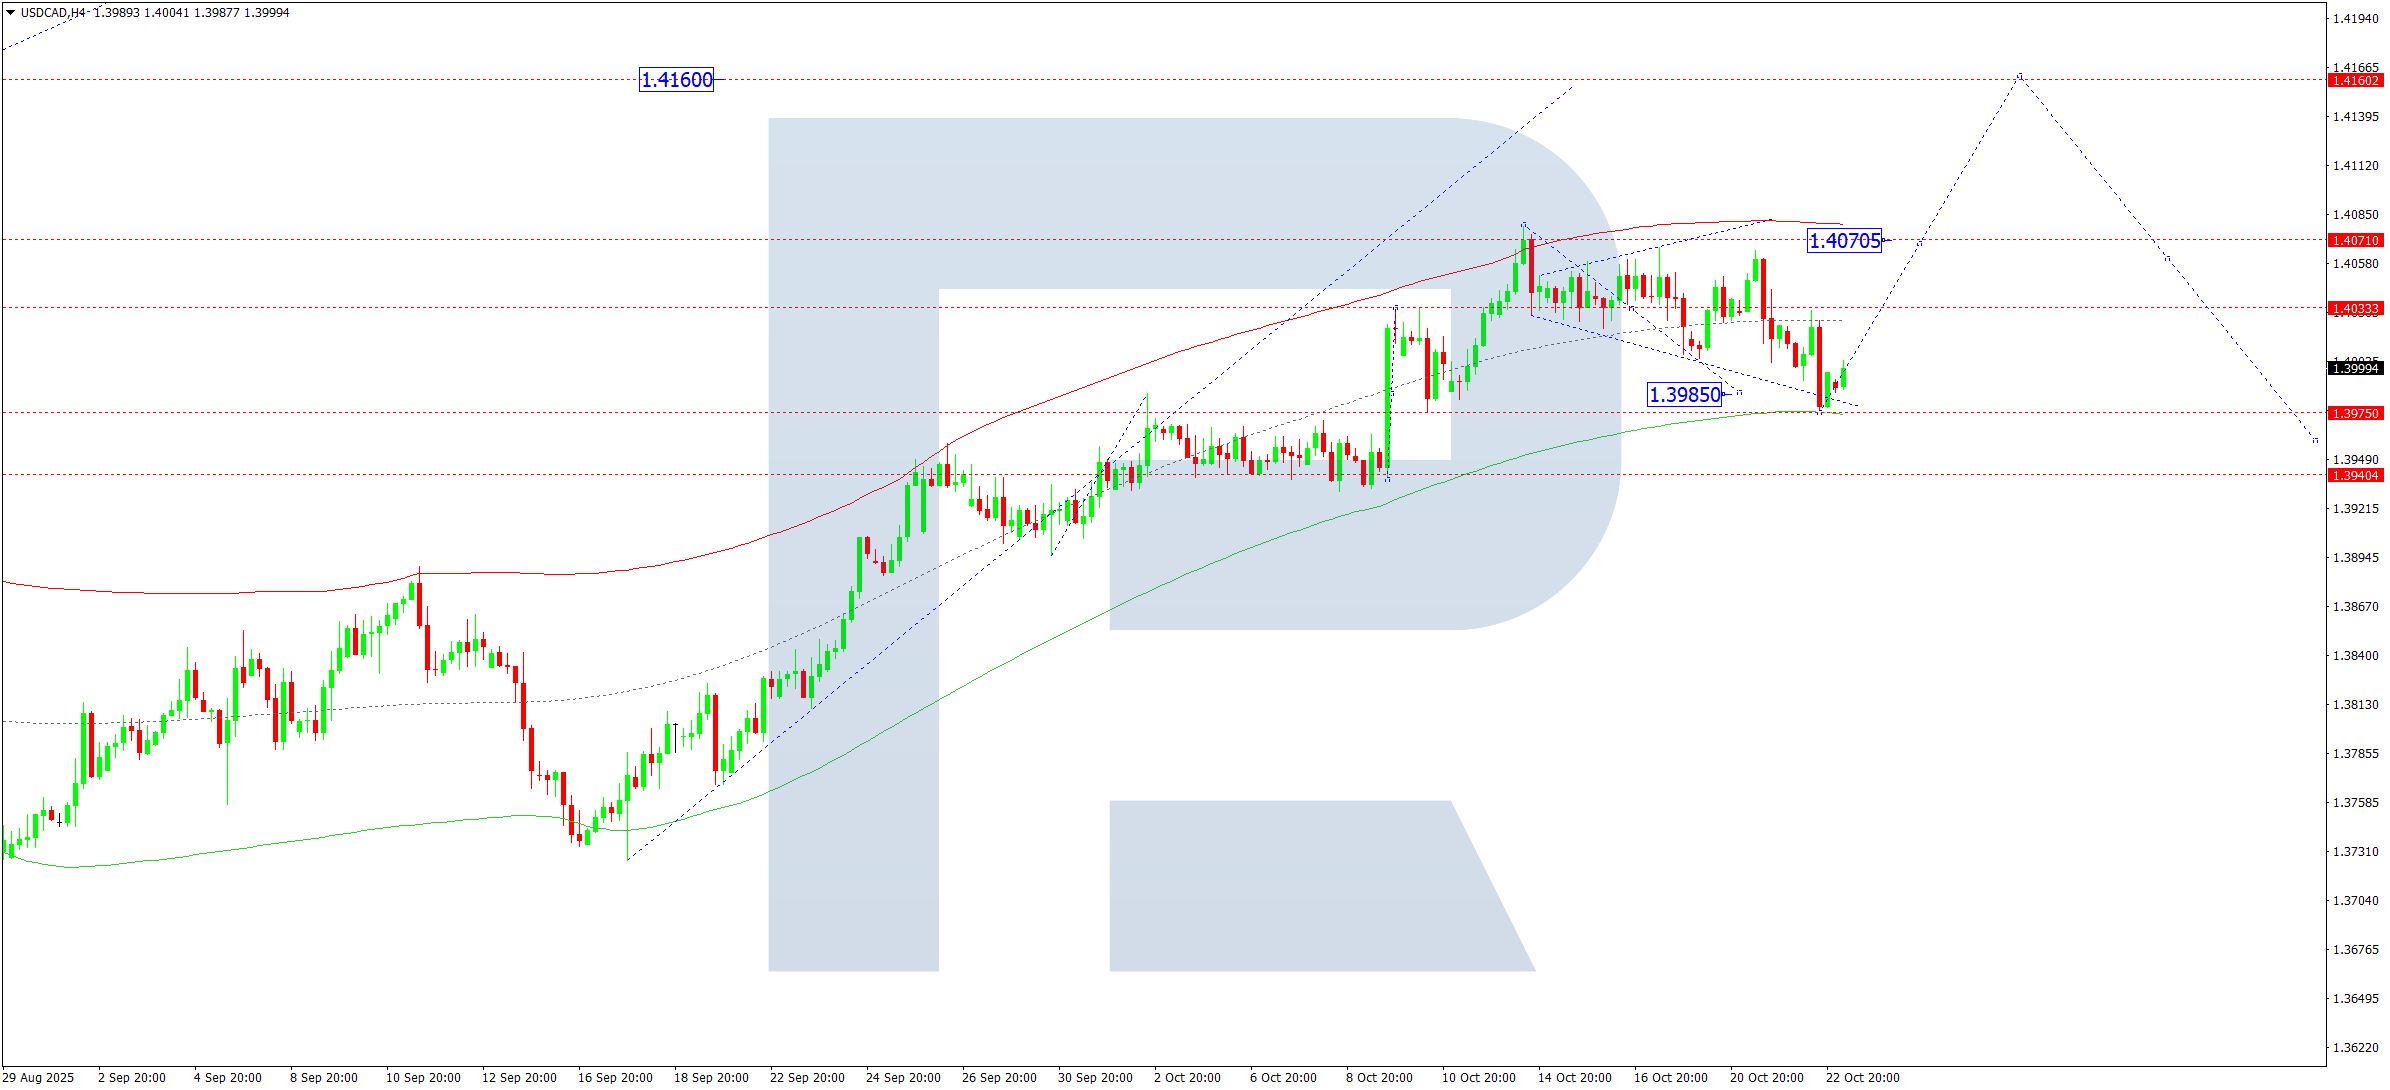
On the H4 chart, USDCAD completed a corrective move down to 1.3975.
The pair is now expected to resume its advance toward 1.4070, with potential continuation to 1.4160 if a breakout occurs.
This bullish setup is confirmed by the Elliott Wave analysis and the wave matrix, with a key pivot at 1.3940. The pair rebounded from the lower boundary of the Price Envelope at 1.3975, with upside targets at 1.4070 and 1.4160, before possibly testing support again near 1.3940.
Outlook: Indicators support further growth toward 1.4070–1.4160.
XAUUSD (Gold) Forecast
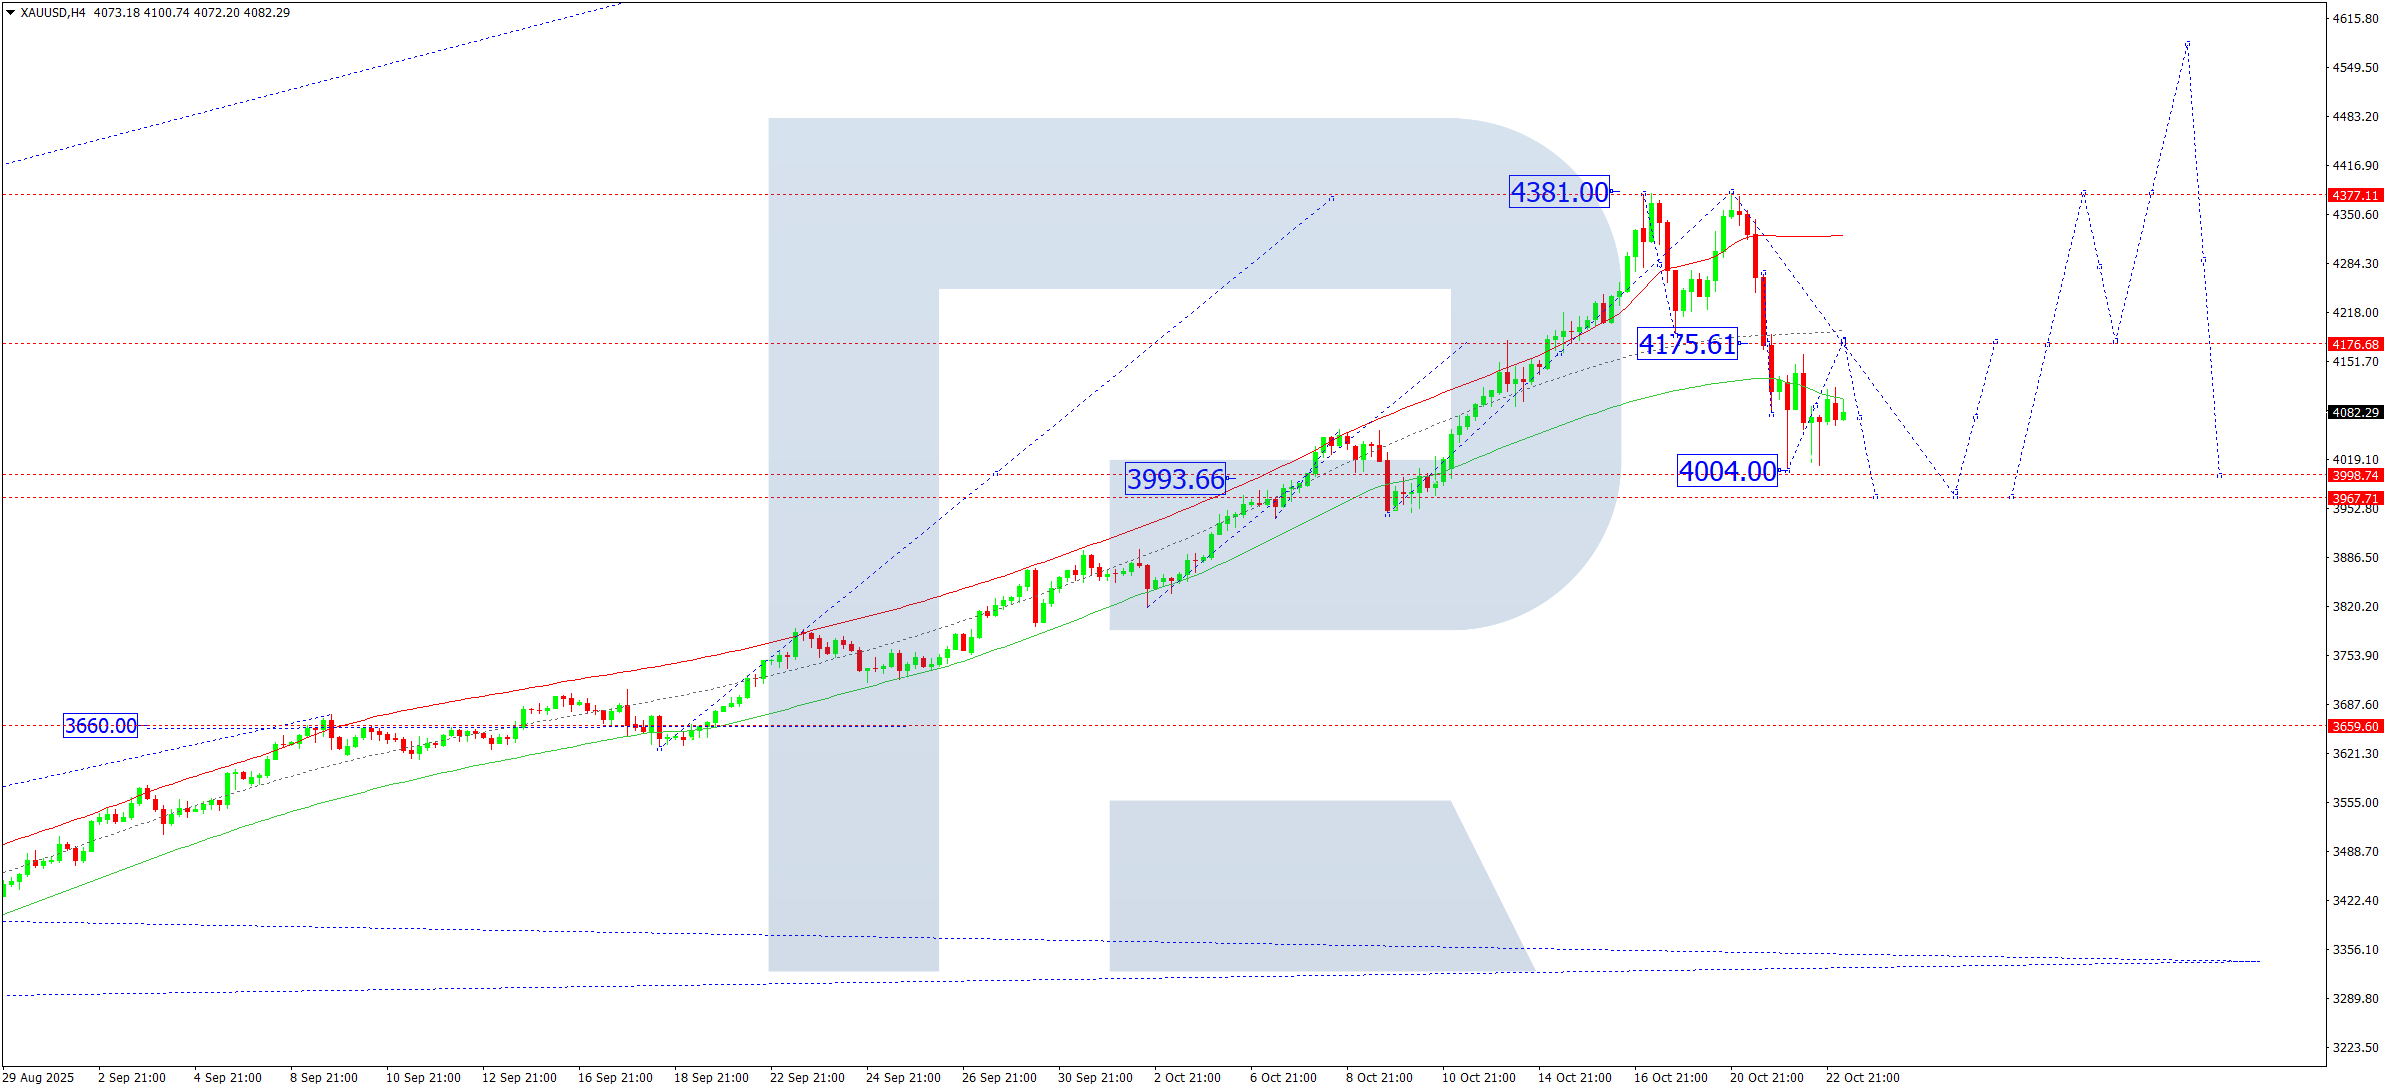
On the H4 chart, XAUUSD continues to consolidate near 4,090.
Expansion of the range is expected, with upside potential toward 4,175 and downside movement possible to 3,970. A break below 3,970 could extend the correction to 3,666, while a break above 4,175 would likely lead to further upside toward 4,400.
The Elliott Wave structure supports this scenario, with a key pivot at 3,660. Gold is currently shaping a correction toward the lower Price Envelope boundary at 3,970, before possibly rising toward 4,400.
Outlook: Indicators point to a continuation of the correction toward 3,970.
Brent Crude Forecast
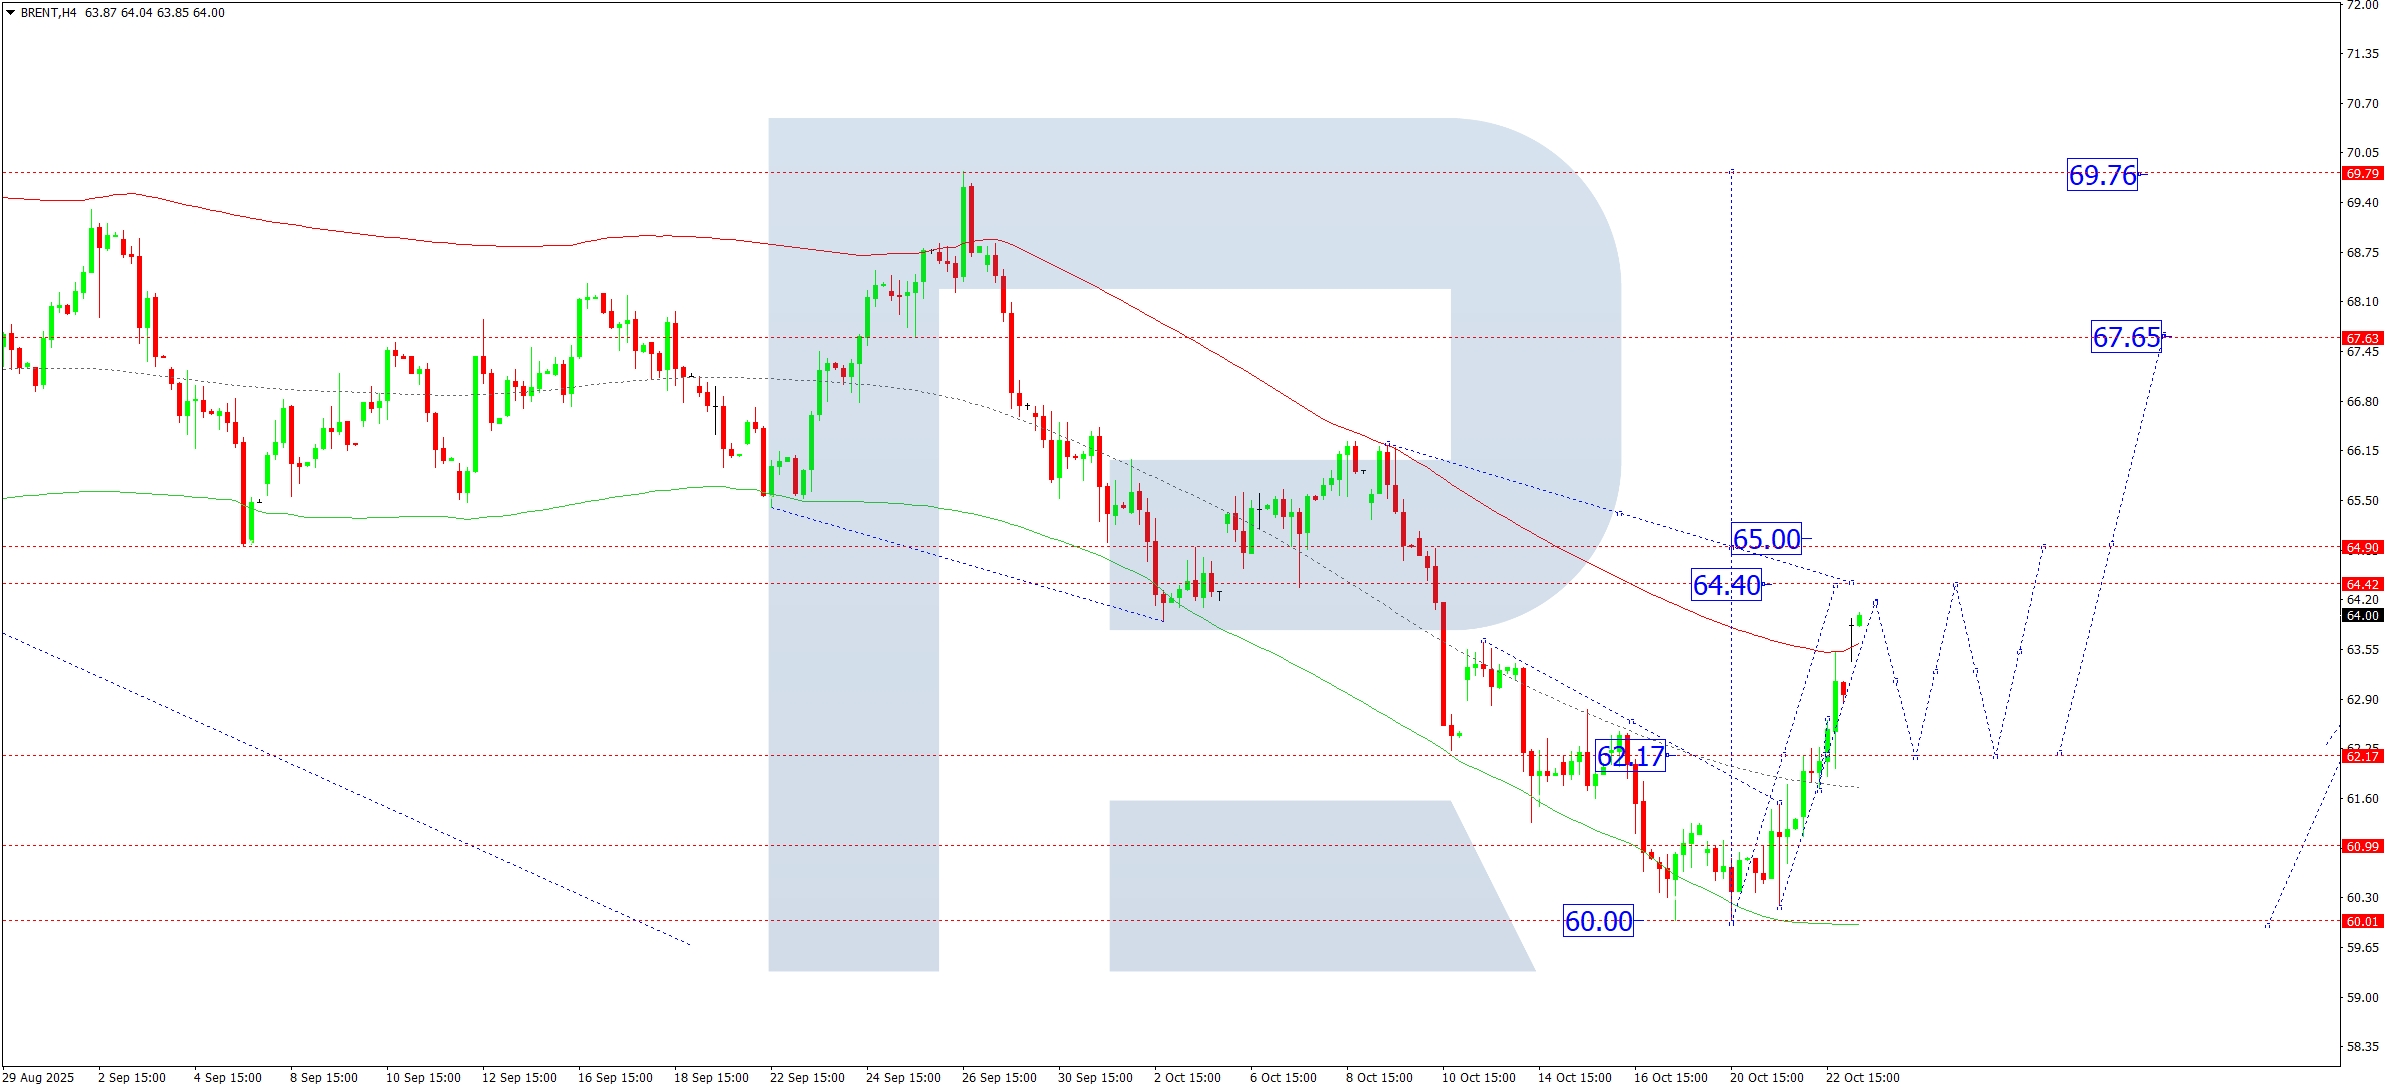
On the H4 chart, Brent has broken above 62.17 and continues to advance toward 64.40.
Once this target is reached, a short-term correction toward 62.20 is possible, followed by renewed growth to 65.00 and possibly 67.67.
This bullish outlook is supported by the Elliott Wave analysis and wave matrix, with a pivot at 62.20. After rebounding from the lower Price Envelope near 60.00, Brent remains poised to move toward its upper boundary around 65.00.
Outlook: Indicators suggest continued upward movement toward 65.00–67.67.
Risk Warning: Past performance is not indicative of future results. Trading in financial markets involves risk of loss.
Leave a Reply