
Daily Technical Analysis and Forecast – 28 October 2025
EURUSD Forecast
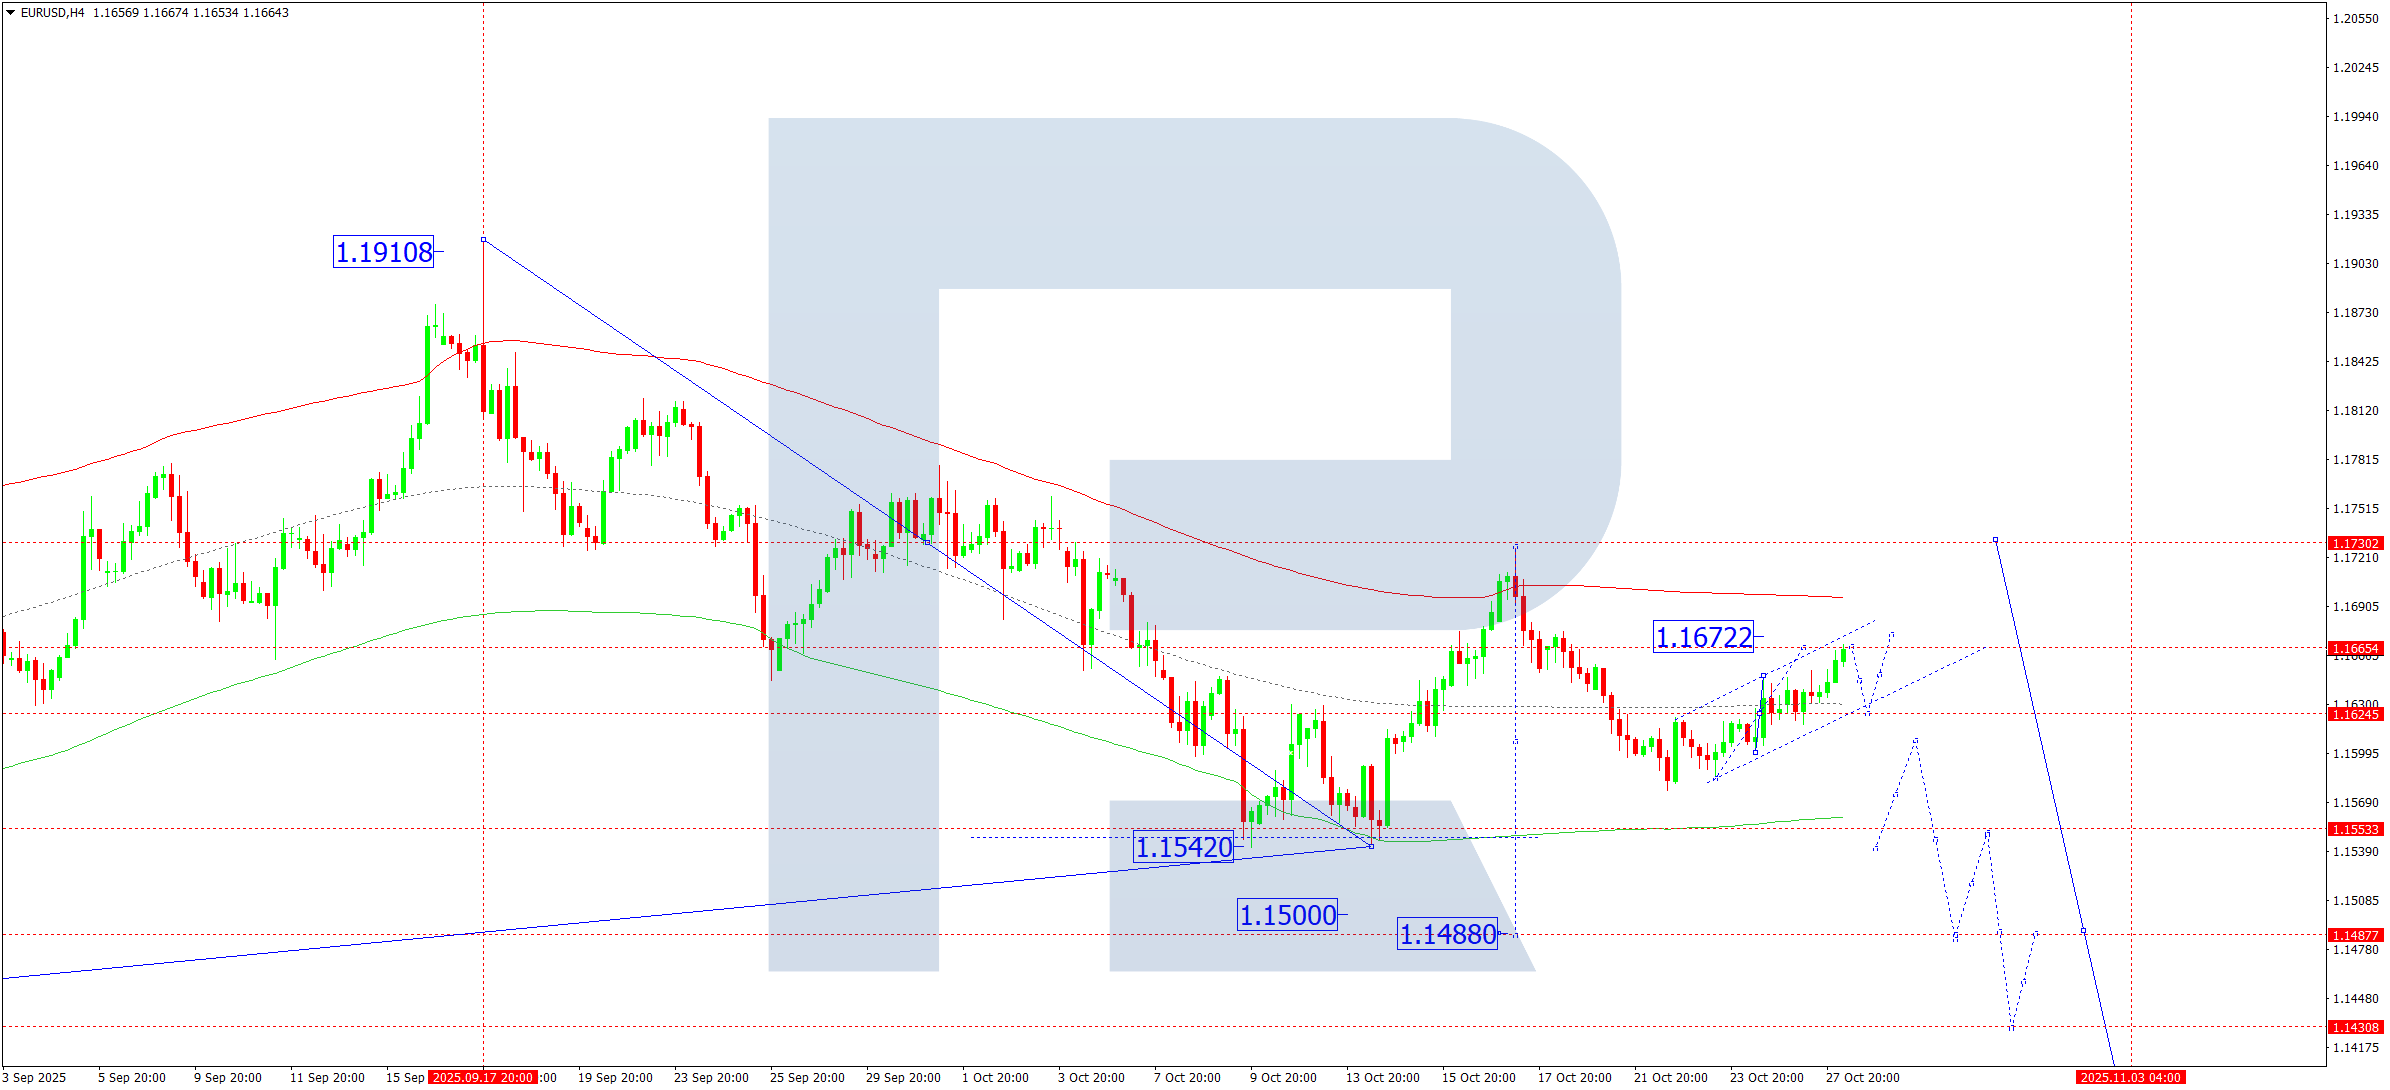
On the H4 chart, EURUSD has broken out of its consolidation range to the upside, extending a corrective phase toward 1.1666. During the session, the pair may test this level before pulling back to 1.1625. A further rise toward 1.1672 cannot be excluded, potentially completing the correction. Afterwards, a decline toward 1.1533 is expected, and a breakout below this level could open the way for a continuation of the downtrend toward 1.1488.
From an Elliott Wave perspective, the structure aligns with a bearish Wave Matrix, with a rotation centre at 1.1730 — a key level in the current setup. Price action is projected to reach the central line of the Price Envelope at 1.1625, followed by a potential rebound to its upper boundary near 1.1672.
Technical Outlook: Expect a short-term decline toward 1.1625, followed by a potential rise toward 1.1672.
USDJPY Forecast
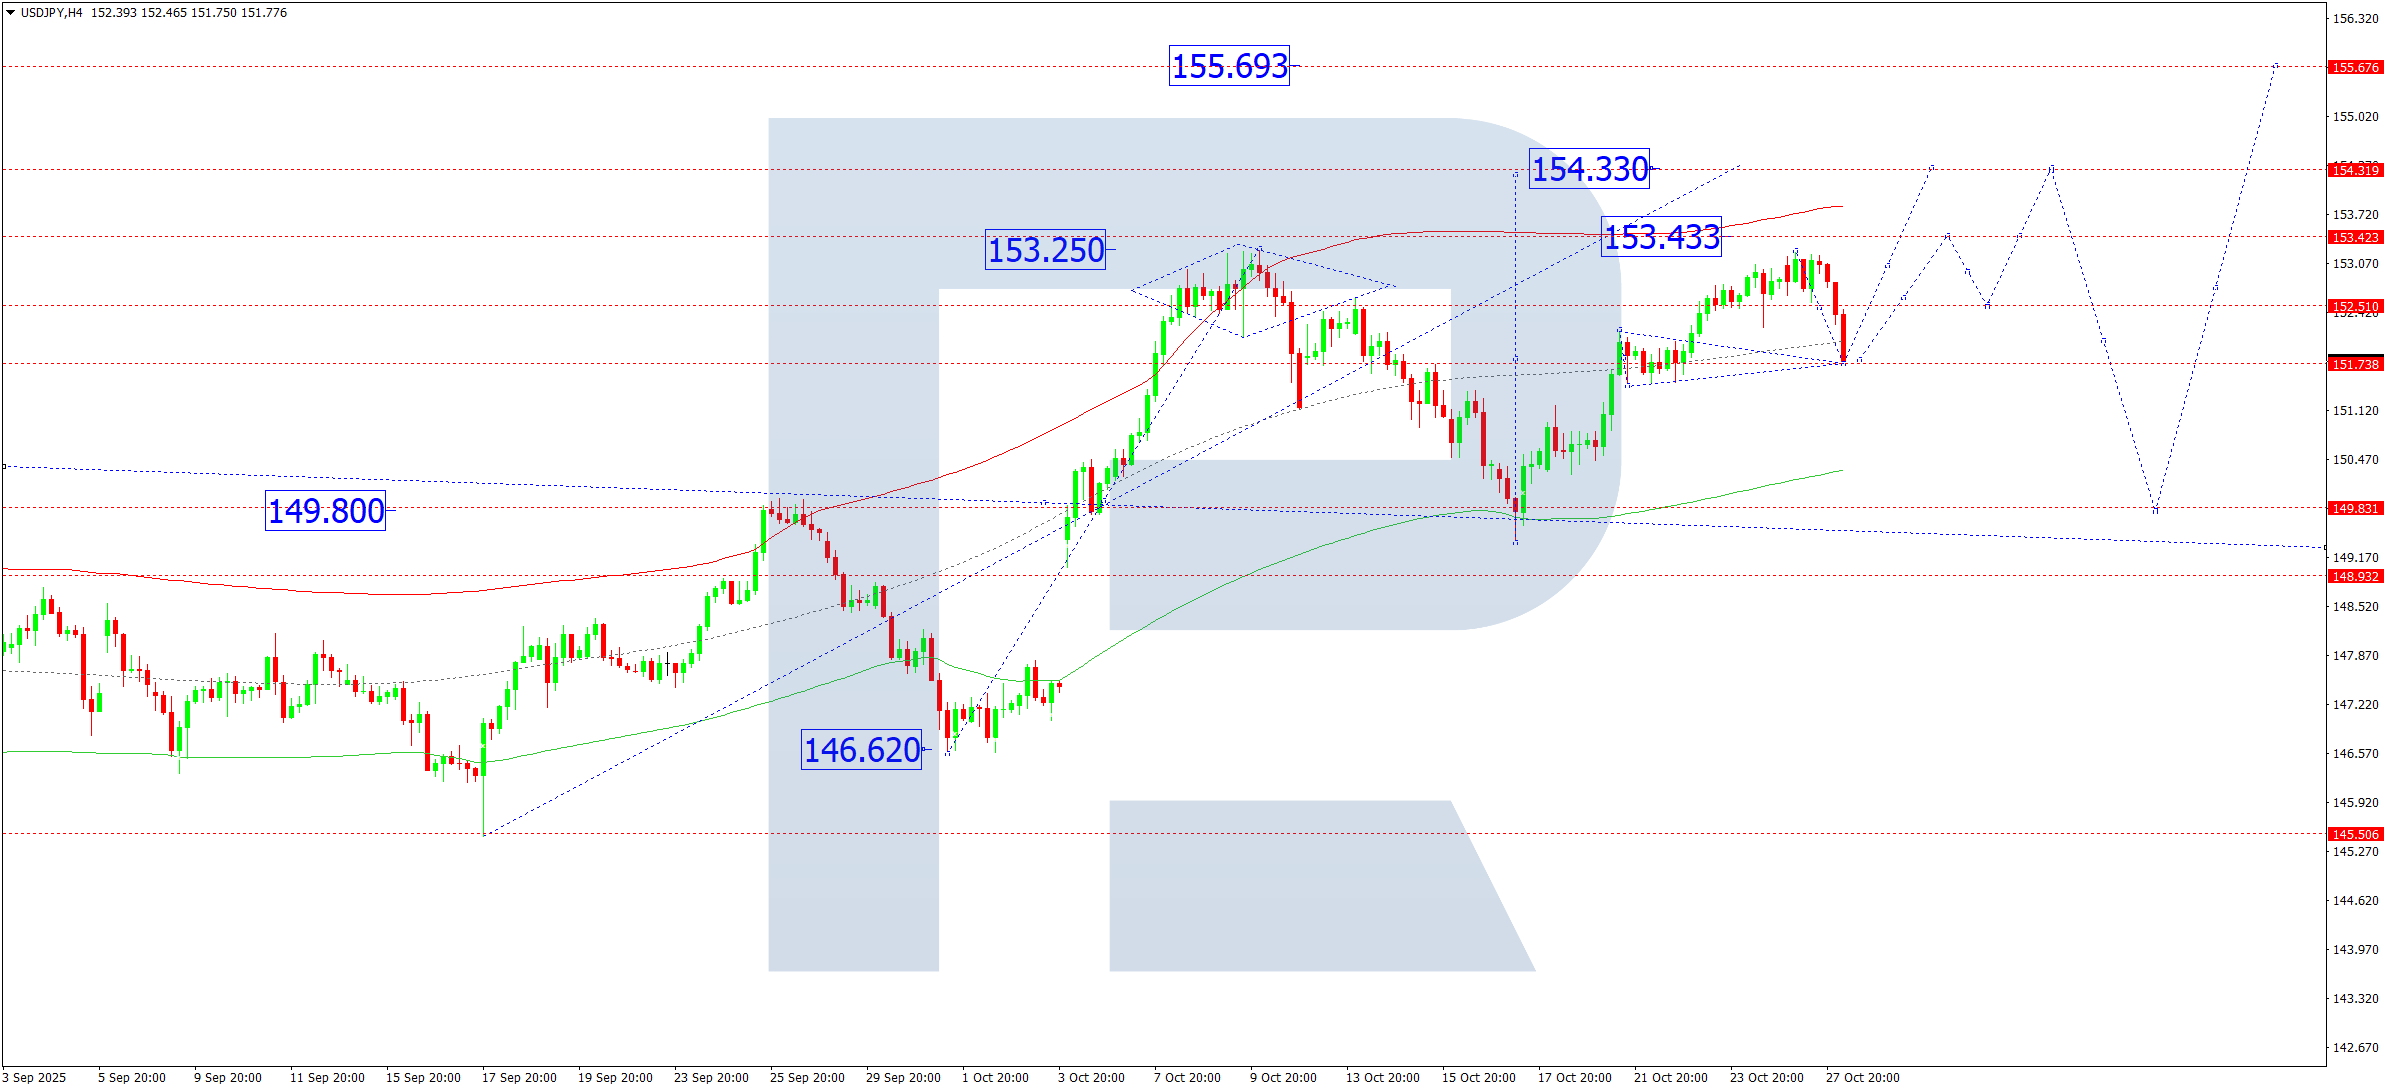
On the H4 chart, USDJPY has completed a corrective phase around 151.73. The pair is expected to rise toward 152.52, then possibly retrace to 151.70 before resuming growth toward 154.30, the local calculated target.
The Elliott Wave structure supports this bullish scenario, with a Wave Matrix rotation centre at 149.80 — the key pivot for this wave. Price has consolidated around the central line of the Price Envelope at 151.70, with upside potential toward 154.30.
Technical Outlook: Anticipate a short pullback to 151.70, followed by an advance toward 154.30.
GBPUSD Forecast
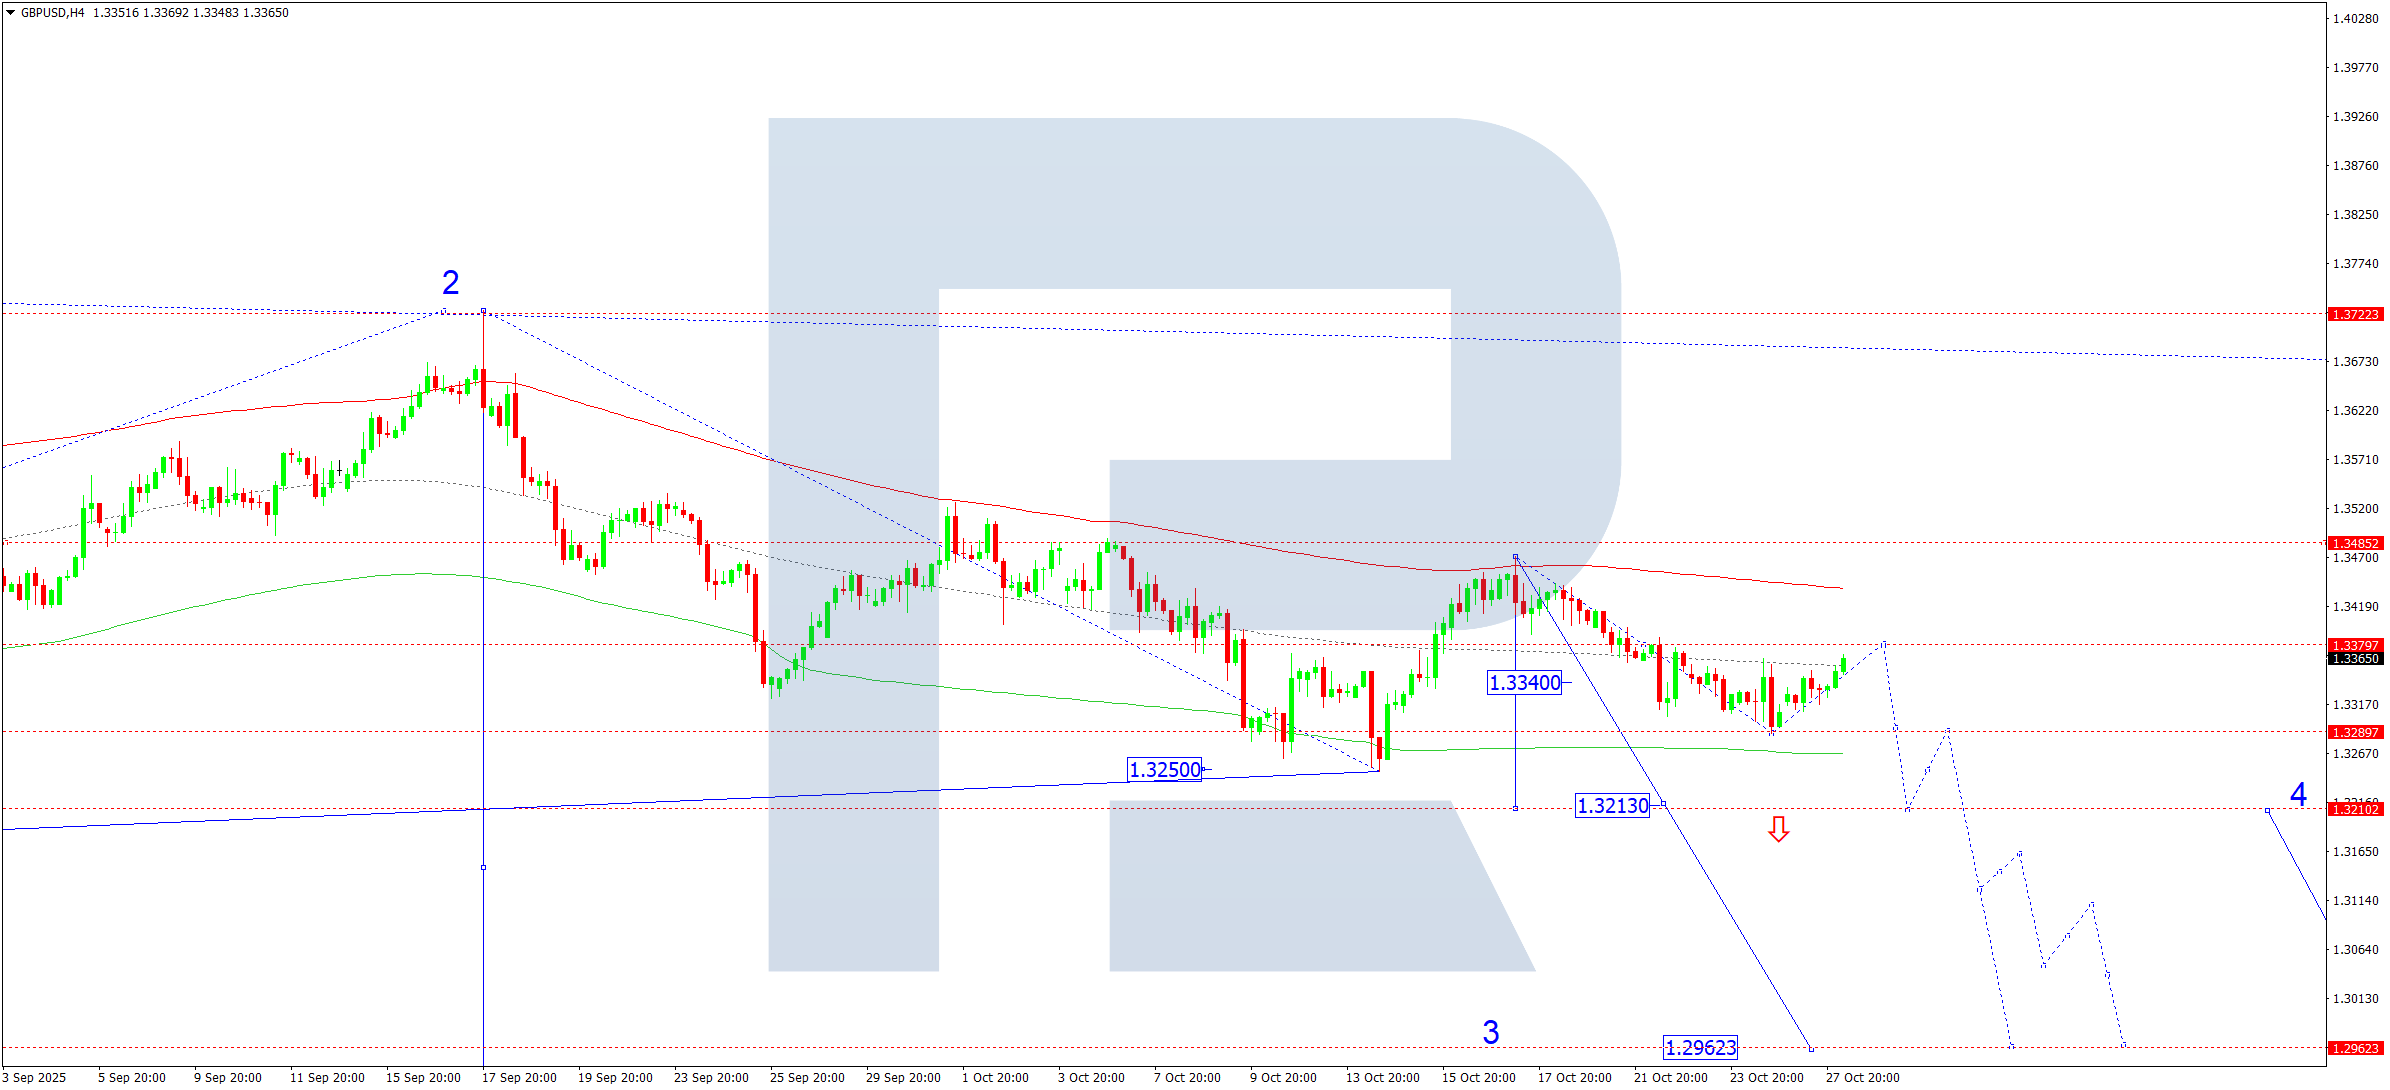
On the H4 chart, GBPUSD has broken above the consolidation range near 1.3333, indicating a corrective move toward 1.3380. This correction is expected to conclude at that level before the pair resumes its downtrend, developing a third bearish wave targeting 1.3213, with the broader objective near 1.2962.
The Elliott Wave structure confirms this bearish setup, featuring a rotation centre at 1.3490. A consolidation phase has formed around the Price Envelope’s midline at 1.3380, from where a decline toward 1.3213 is anticipated.
Technical Outlook: Look for a potential continuation of the downtrend toward 1.3213.
AUDUSD Forecast
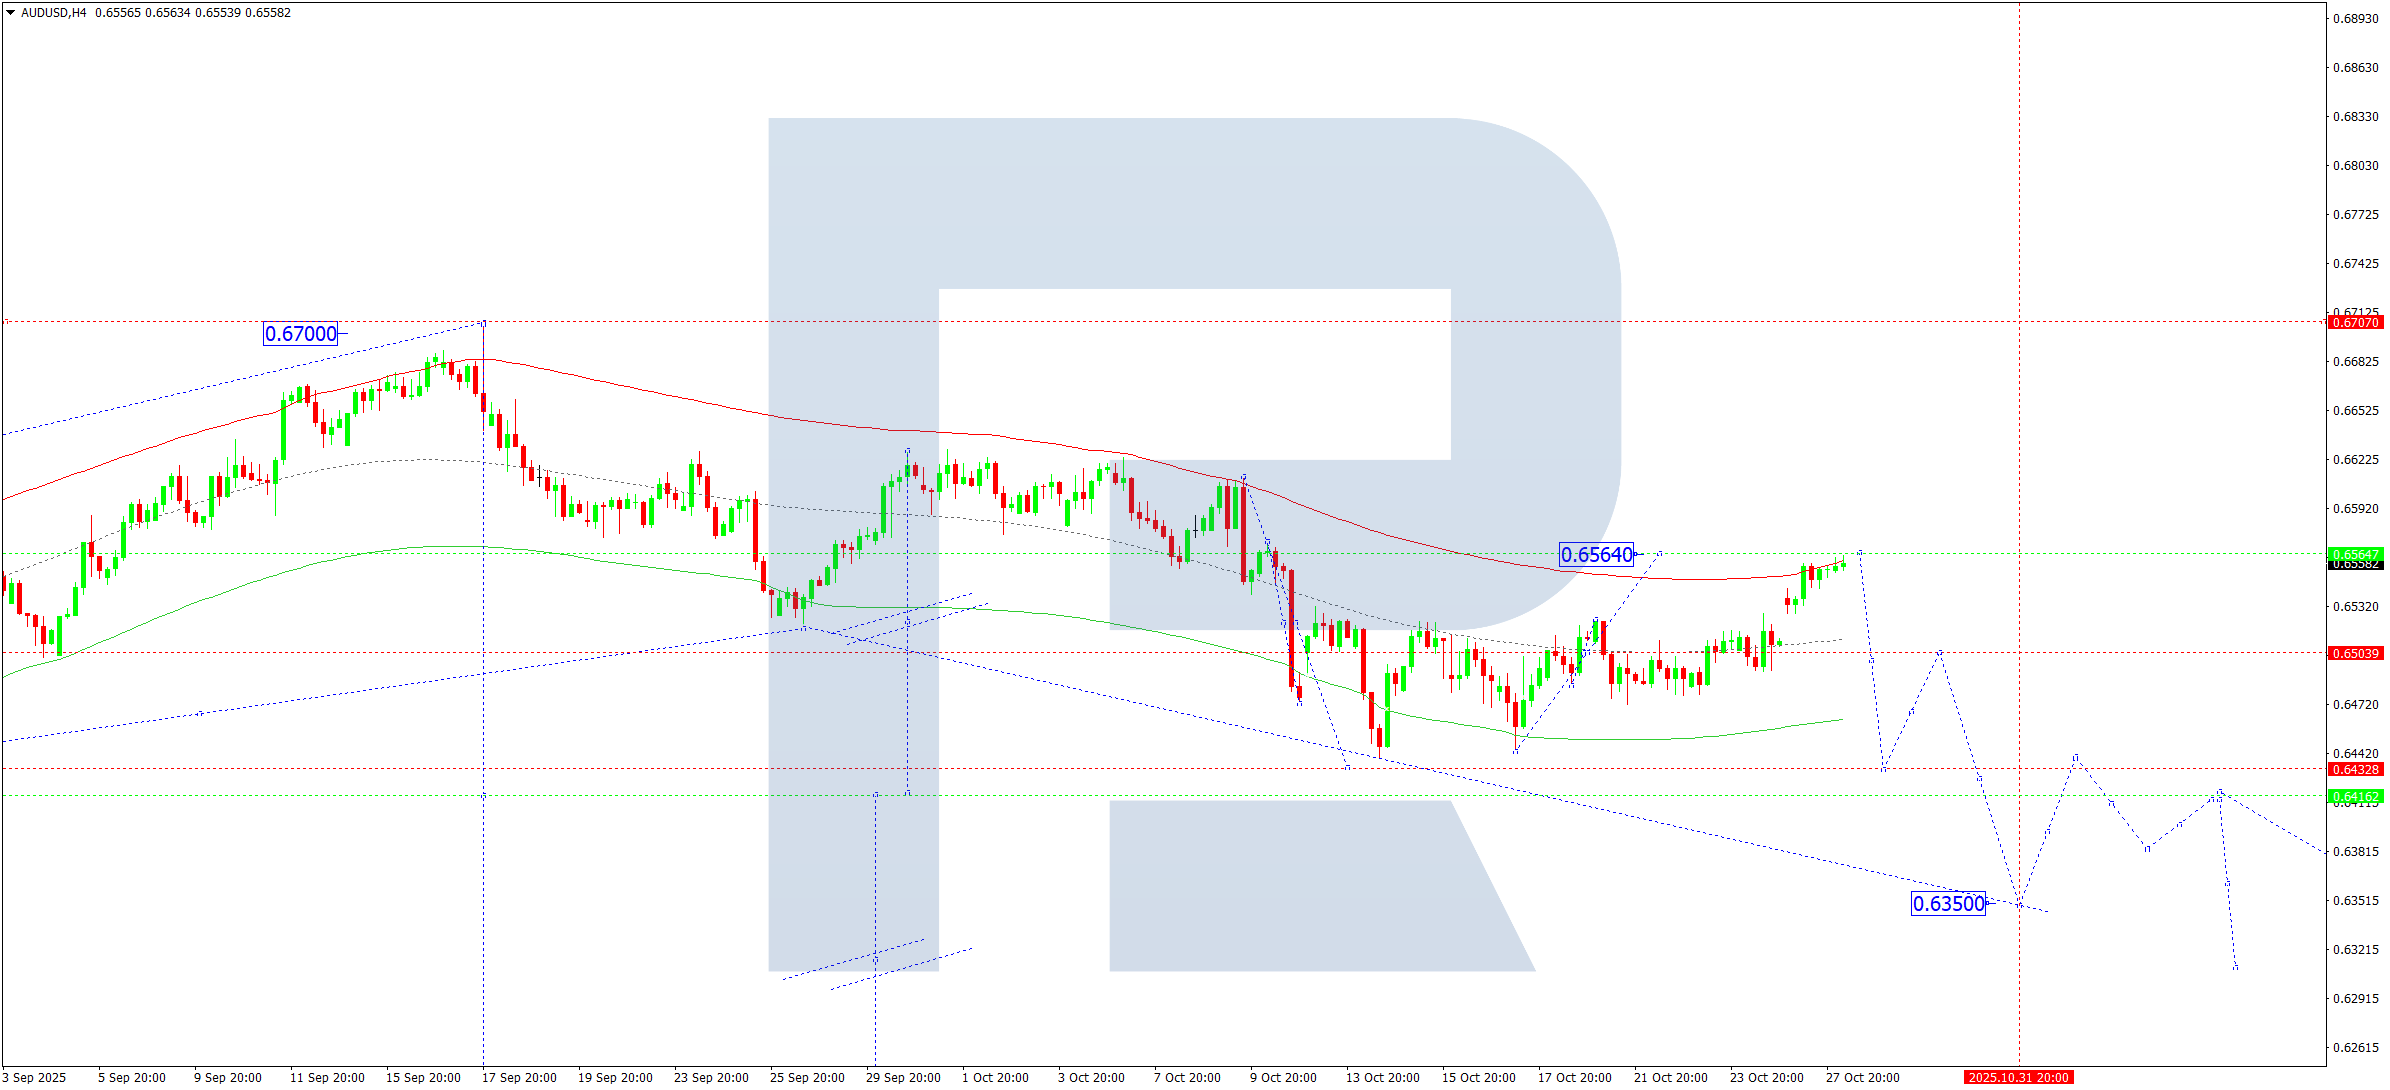
On the H4 chart, AUDUSD has extended its consolidation range toward 0.6564. The pair is expected to decline toward 0.6500, and a breakout below this level could trigger further downside movement toward 0.6432, possibly extending to 0.6350.
This scenario aligns with the bearish Elliott Wave formation, featuring a rotation centre at 0.6525. The corrective phase appears complete near the upper boundary of the Price Envelope at 0.6542, with a likely move toward the lower boundary at 0.6432.
Technical Outlook: A downward wave targeting 0.6432 may begin today.
USDCAD Forecast
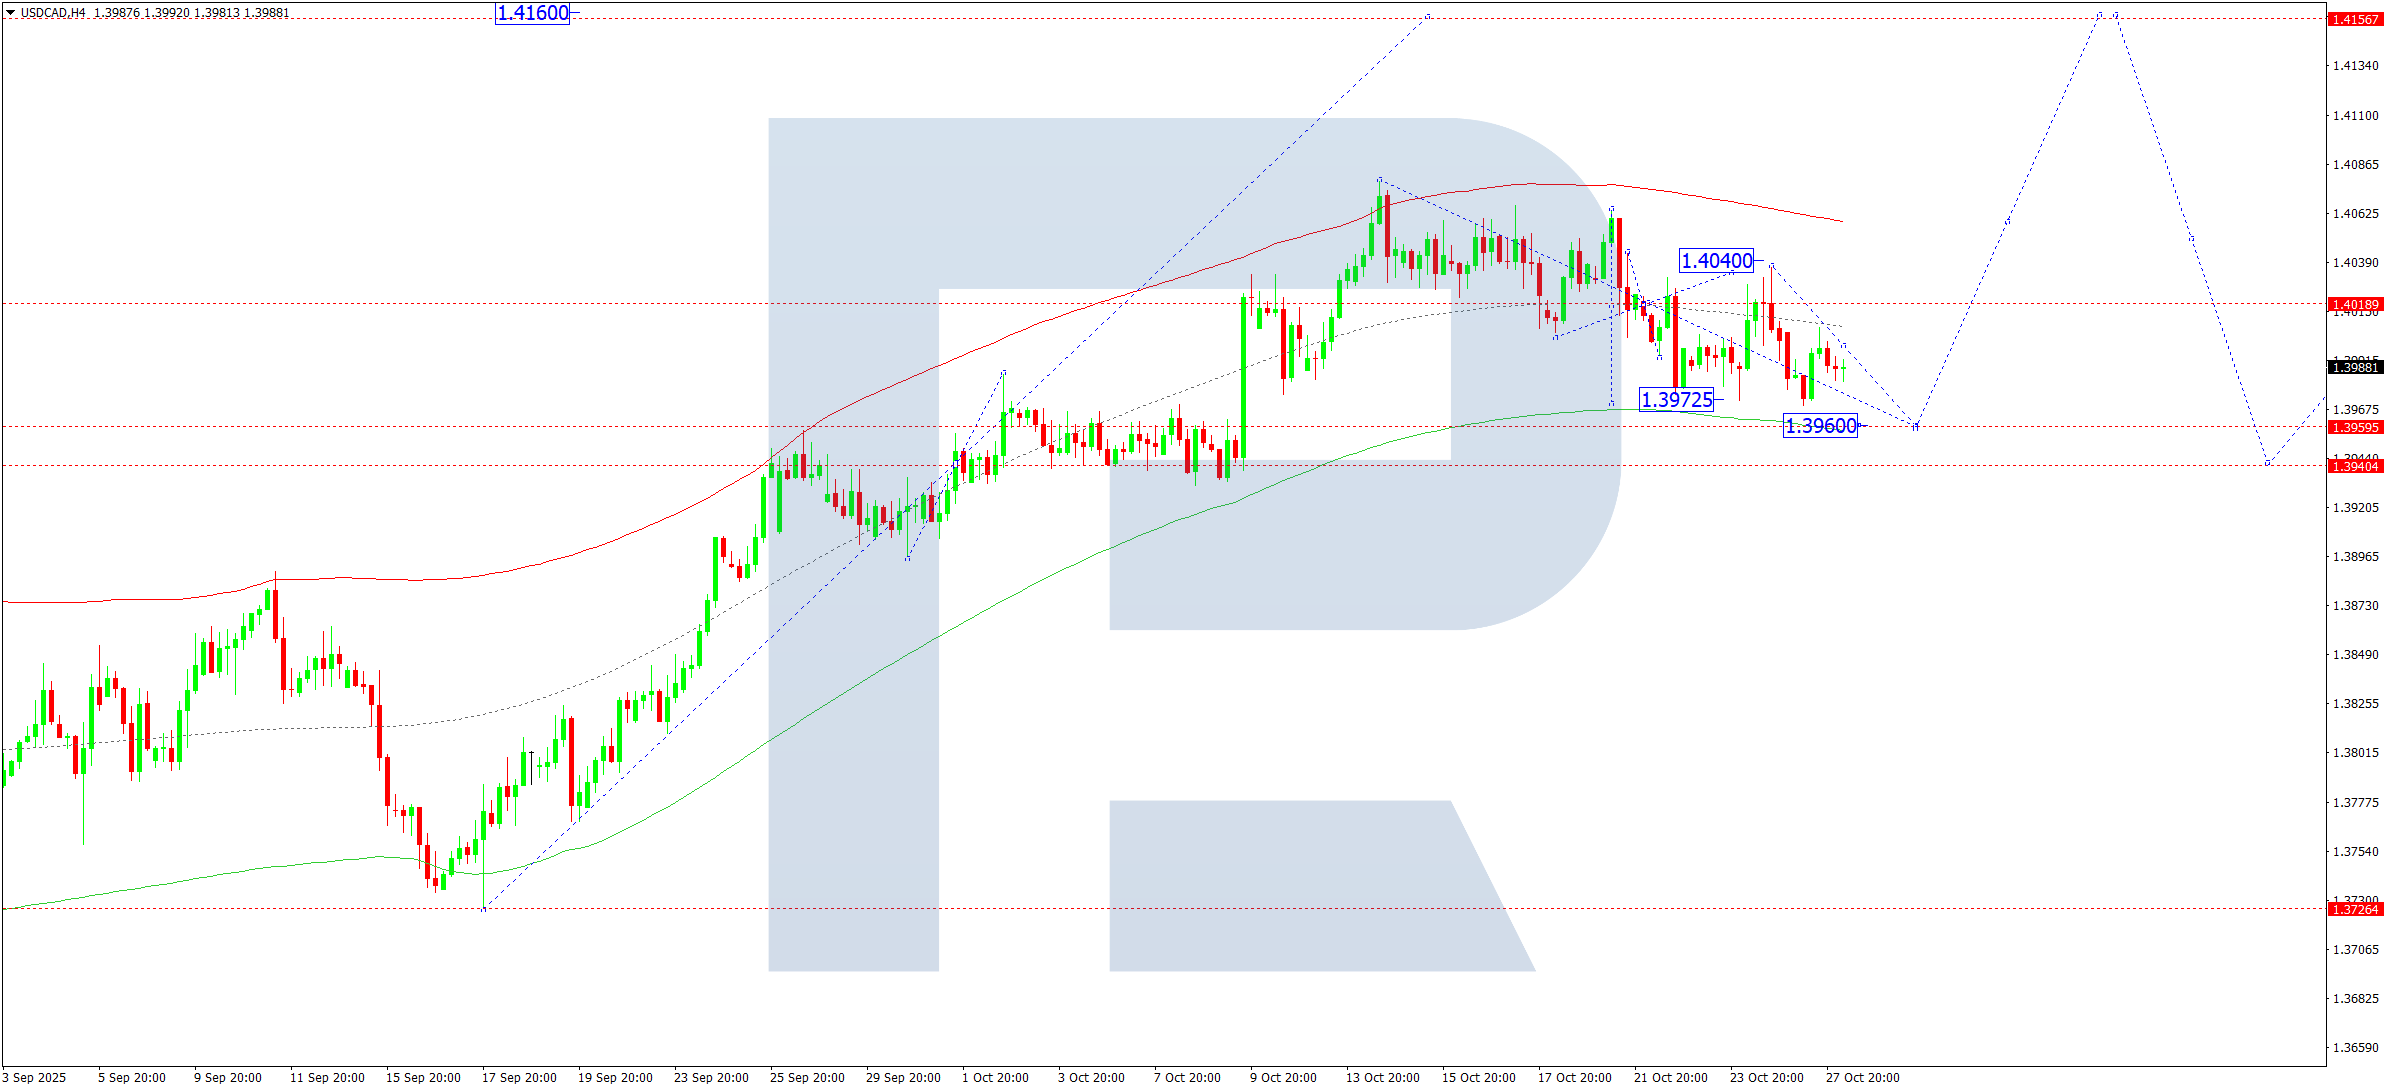
On the H4 chart, USDCAD continues consolidating around 1.4019. A short-term dip toward 1.3960 is possible before the price resumes its upward movement toward 1.4040. A breakout above this resistance could open the path for further gains toward 1.4160.
The Elliott Wave structure supports the bullish case, with a Wave Matrix rotation centre at 1.3940. The market may retest the lower boundary of the Price Envelope near 1.3960, then rebound toward 1.4040. A break above this level could extend the uptrend to 1.4160, followed by a potential retest of 1.3940 from above.
Technical Outlook: Expect an upward continuation toward 1.4040 and 1.4160.
XAUUSD (Gold) Forecast
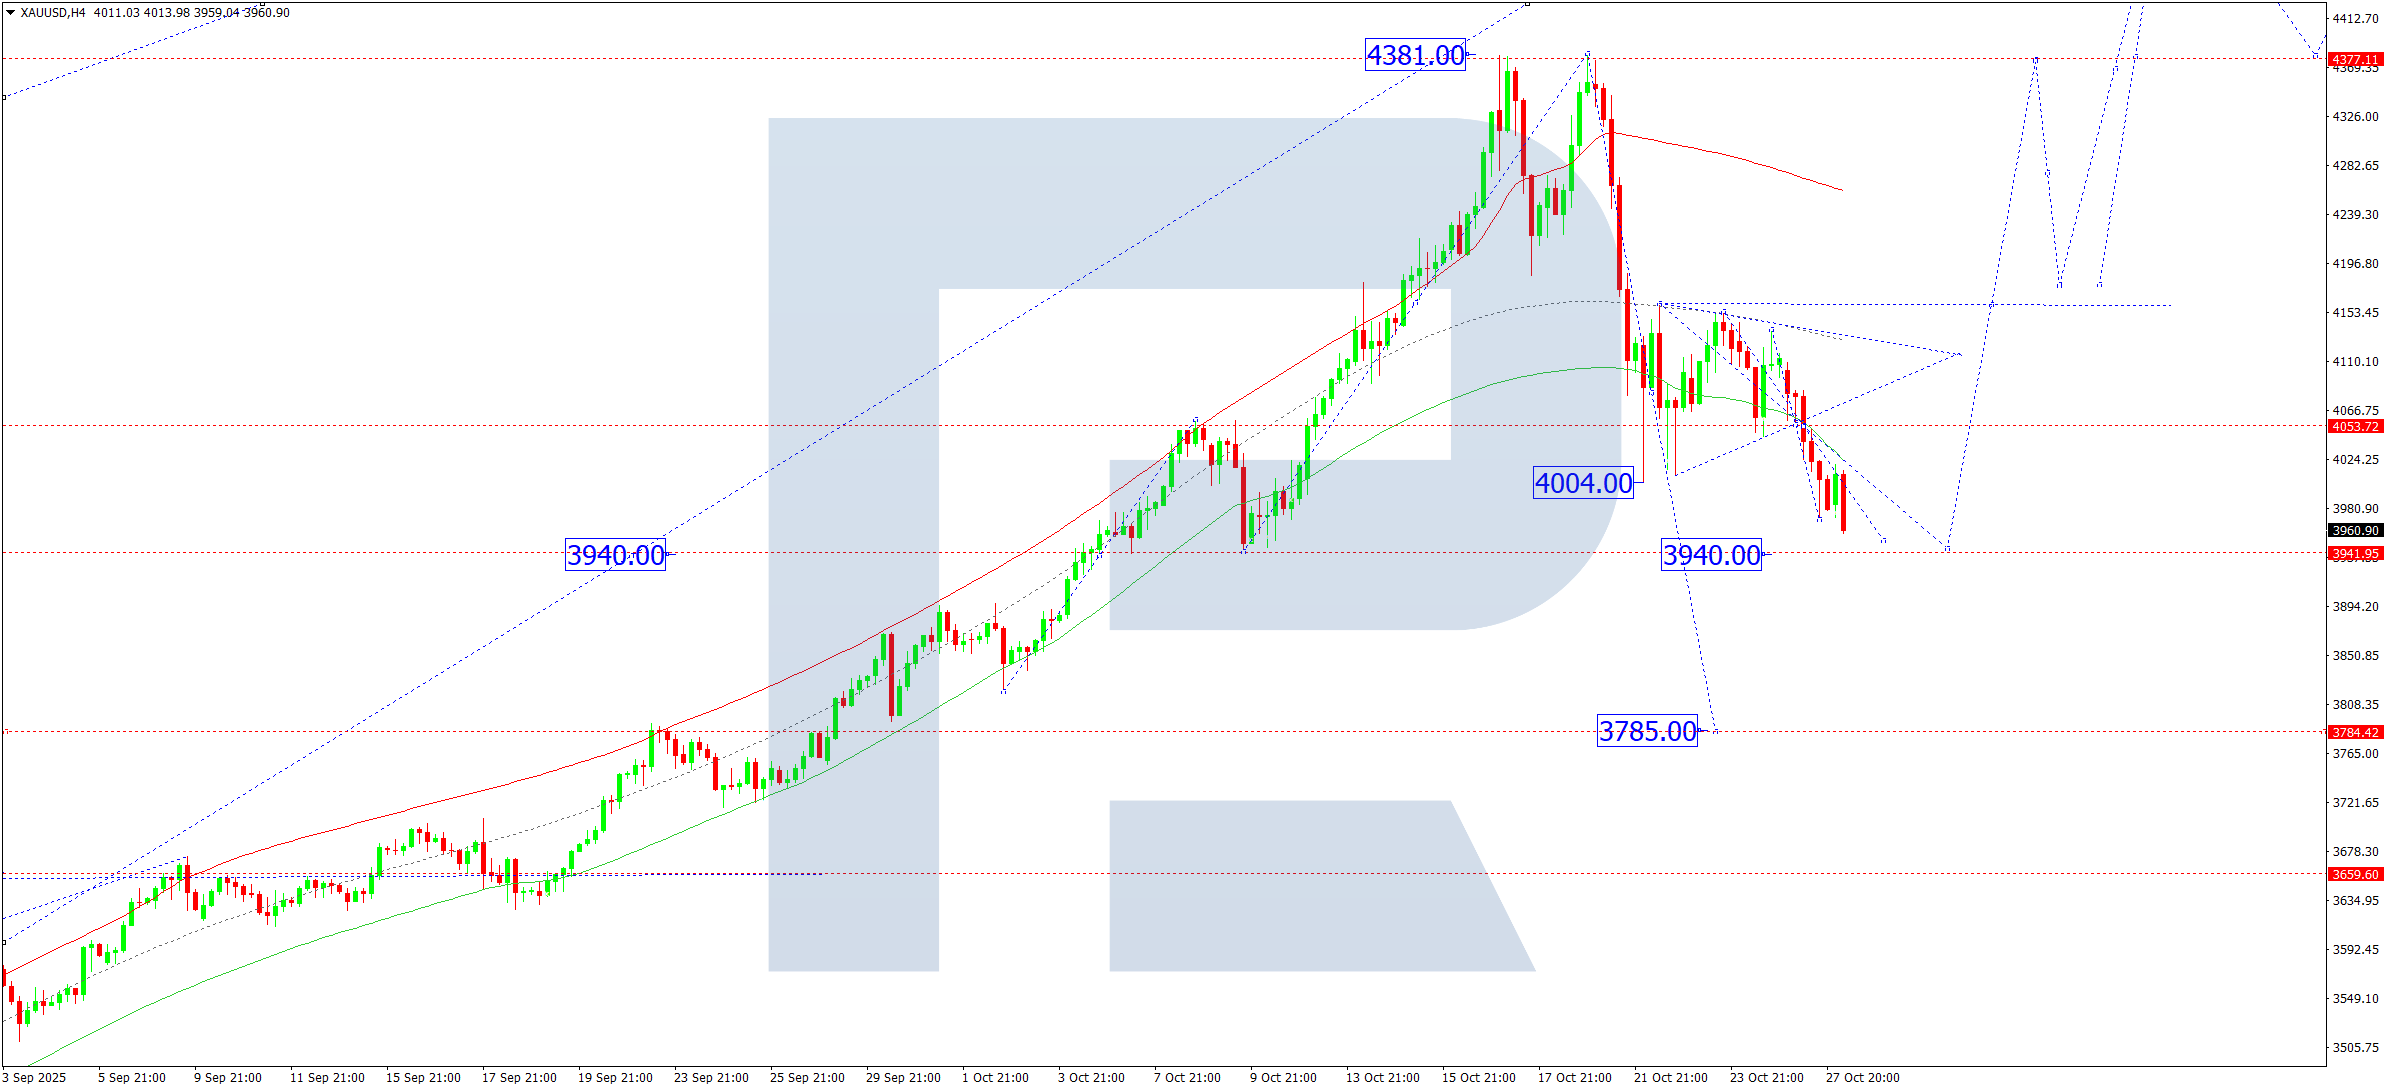
On the H4 chart, XAUUSD continues a corrective move toward 3,940. After reaching this area, a rebound toward 4,055 is expected, forming a new consolidation zone. A downward breakout may deepen the correction to 3,785 or even 3,666, while an upward breakout could signal a continuation of the bullish trend toward 4,400.
The Elliott Wave analysis shows a bullish Wave Matrix with a rotation centre at 3,660. The metal is currently testing the lower boundary of the Price Envelope near 3,940, with potential for a rebound toward 4,400.
Technical Outlook: The corrective phase toward 3,940 remains active.
Brent Crude Forecast
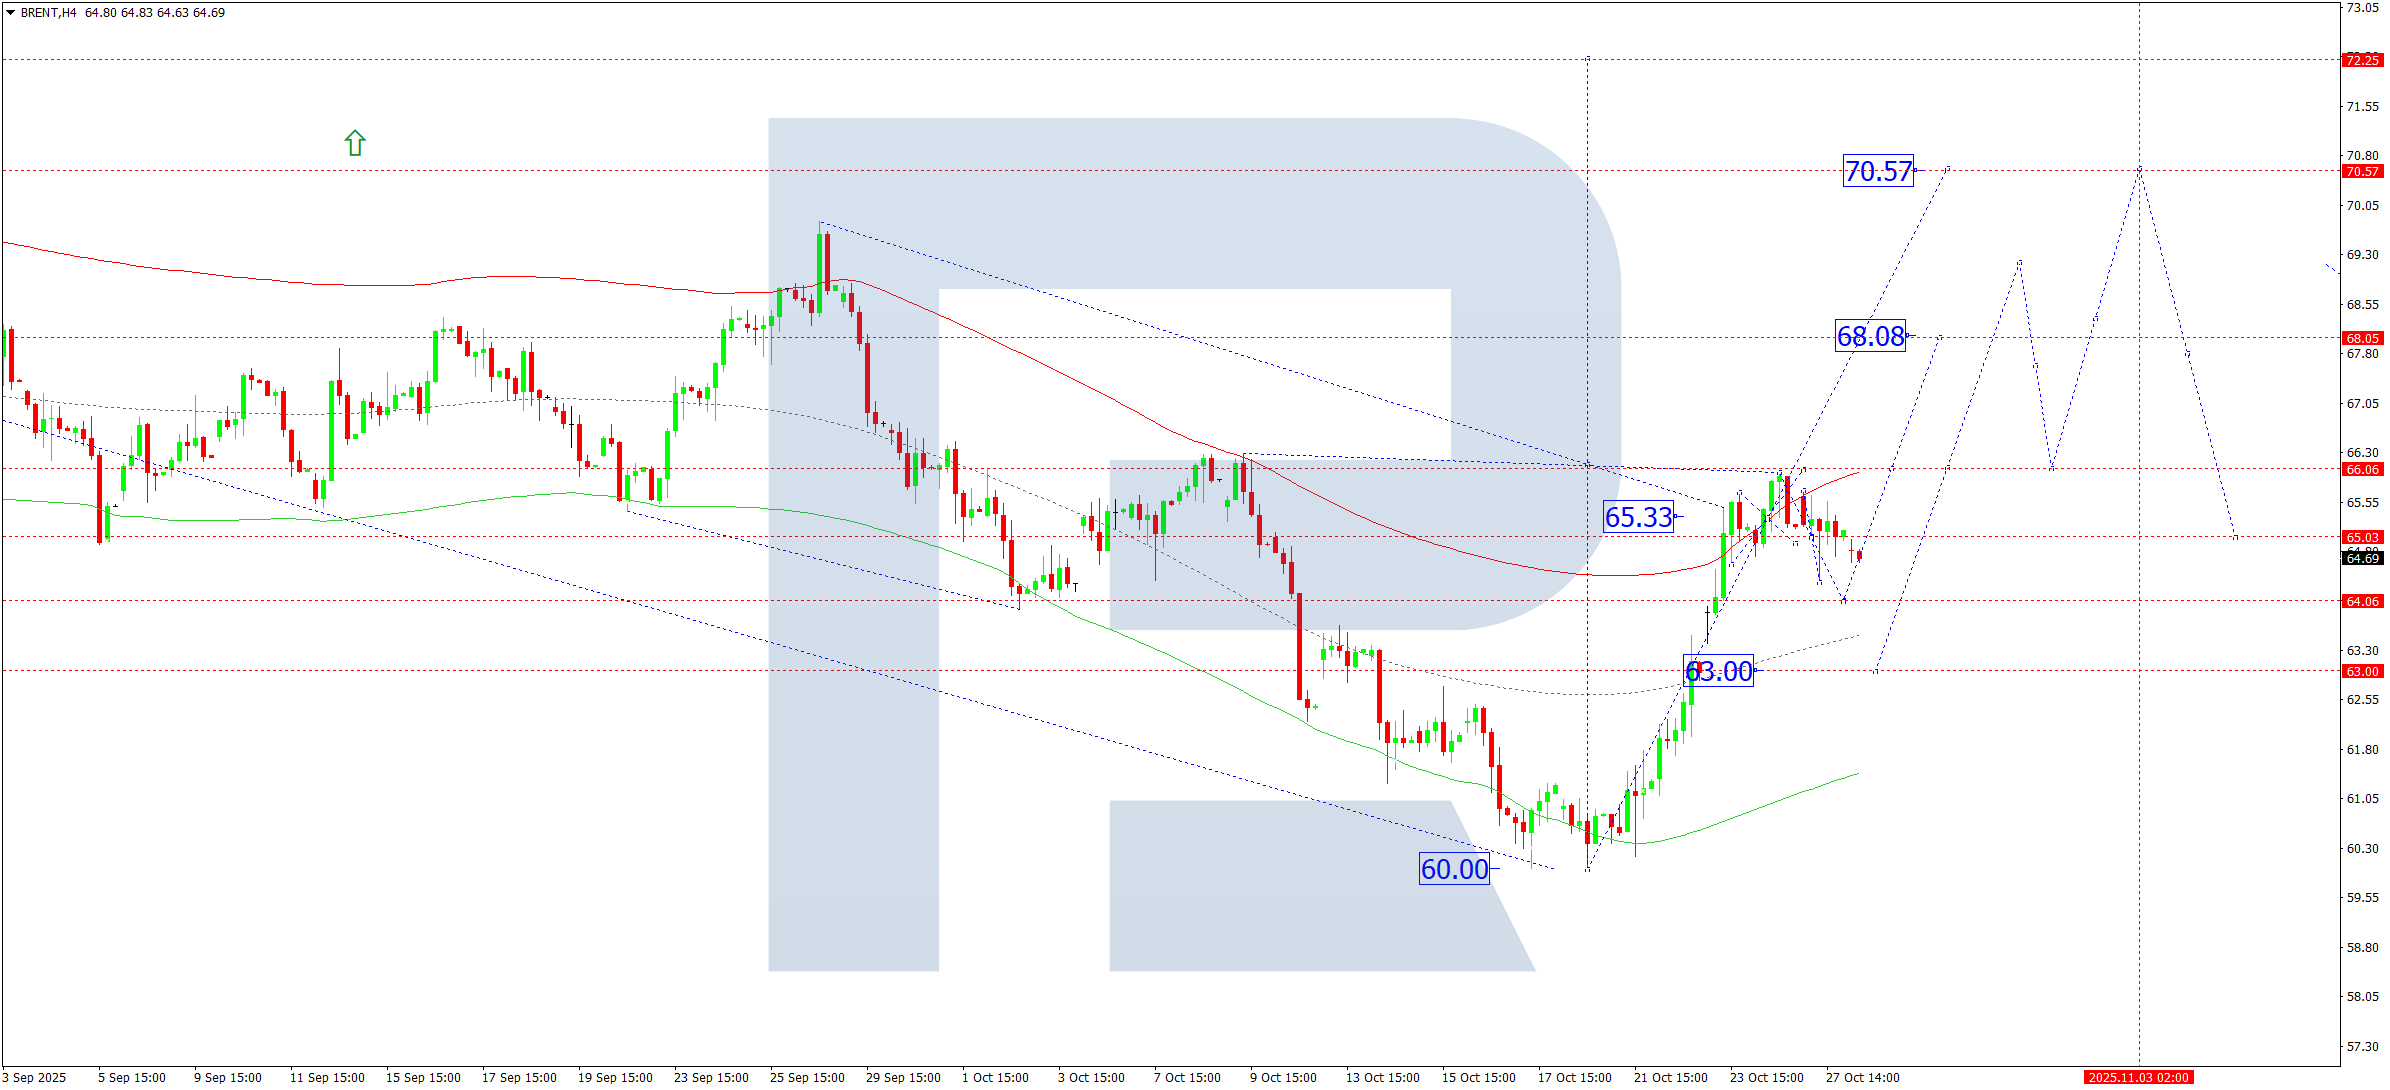
On the H4 chart, Brent crude is consolidating near the top of its recent impulse, around 65.00. A short-term dip to 64.00 is possible before a rebound toward 65.00. A breakout to the upside could lead to further gains toward 68.08, and possibly 70.77. Conversely, a downward breakout could trigger a correction to 63.00, followed by a recovery toward 68.08.
Elliott Wave analysis confirms a bullish Wave Matrix with a rotation centre at 63.00, marking this level as a key support zone. Price action is currently oscillating around the upper boundary of the Price Envelope at 65.99, preparing for the next upward impulse.
Technical Outlook: The correction may soon end, setting the stage for an advance toward 68.08 and 70.77.
Risk Warning:
Trading in financial markets involves significant risk and may result in the loss of invested capital. Past performance is not indicative of future results. Always conduct your own analysis or consult a financial advisor before making trading decisions.
Leave a Reply