
Daily Technical Analysis and Forecast — 31 October 2025
EURUSD Forecast
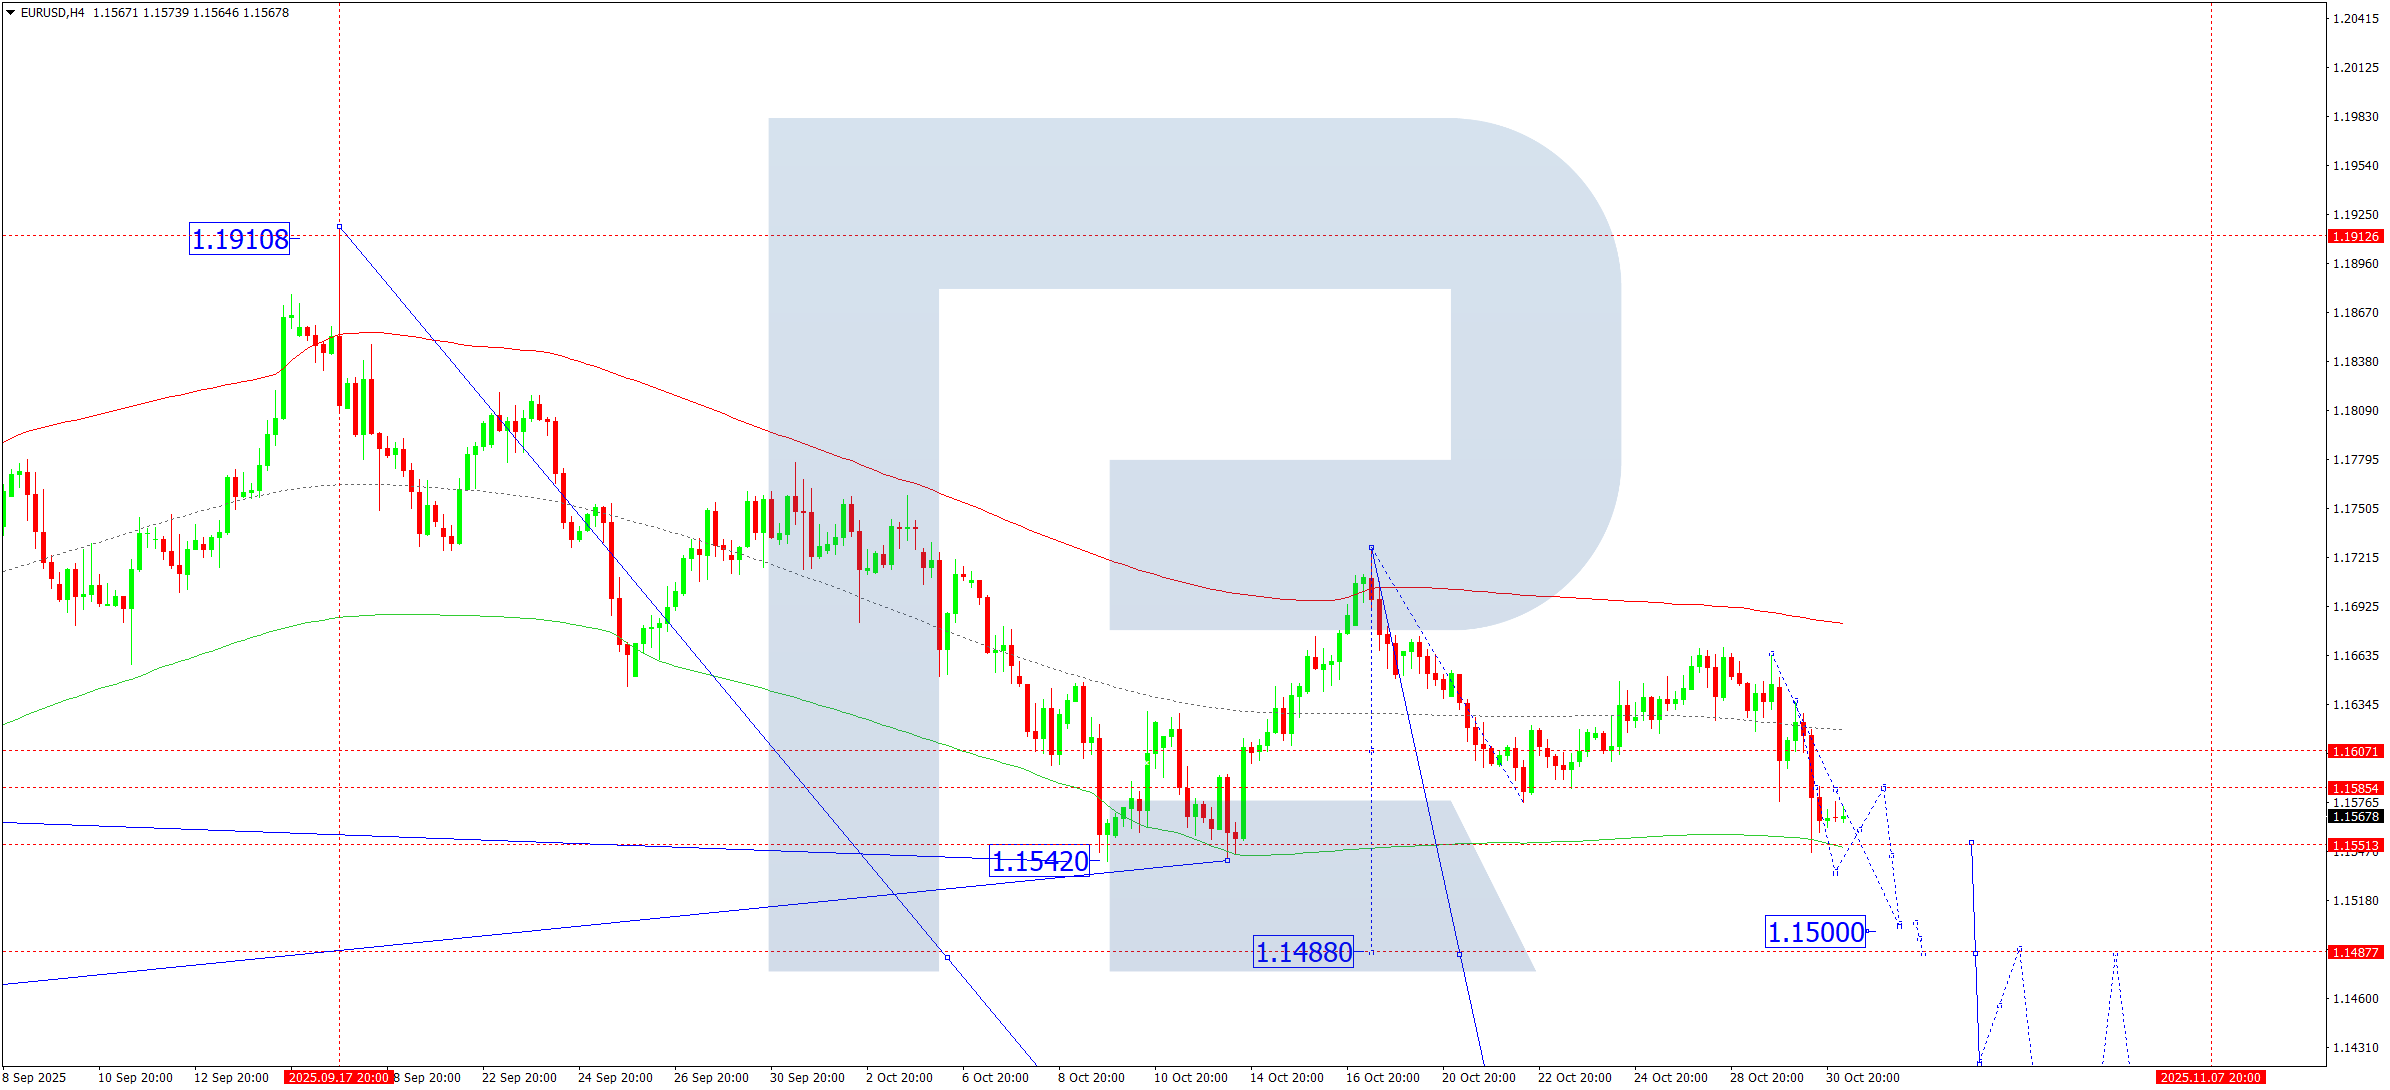
On the H4 chart, EURUSD has completed a downward wave to 1.1547. On 31 October 2025, the pair may extend its decline to 1.1500, potentially reaching 1.1488. Afterward, a period of consolidation around this level is likely. A breakout to the downside would open the way towards 1.1420, with the main target at 1.1240.
This outlook is supported by the Elliott Wave structure and the bearish wave matrix, with a key pivot point at 1.1585. The price is expected to test the lower boundary of the Price Envelope near 1.1488, followed by a possible corrective rebound towards the central line at 1.1550.
Technical indicators point to a continued decline towards 1.1500 and 1.1488.
Risk Warning: Past trading performance does not guarantee future results.
USDJPY Forecast
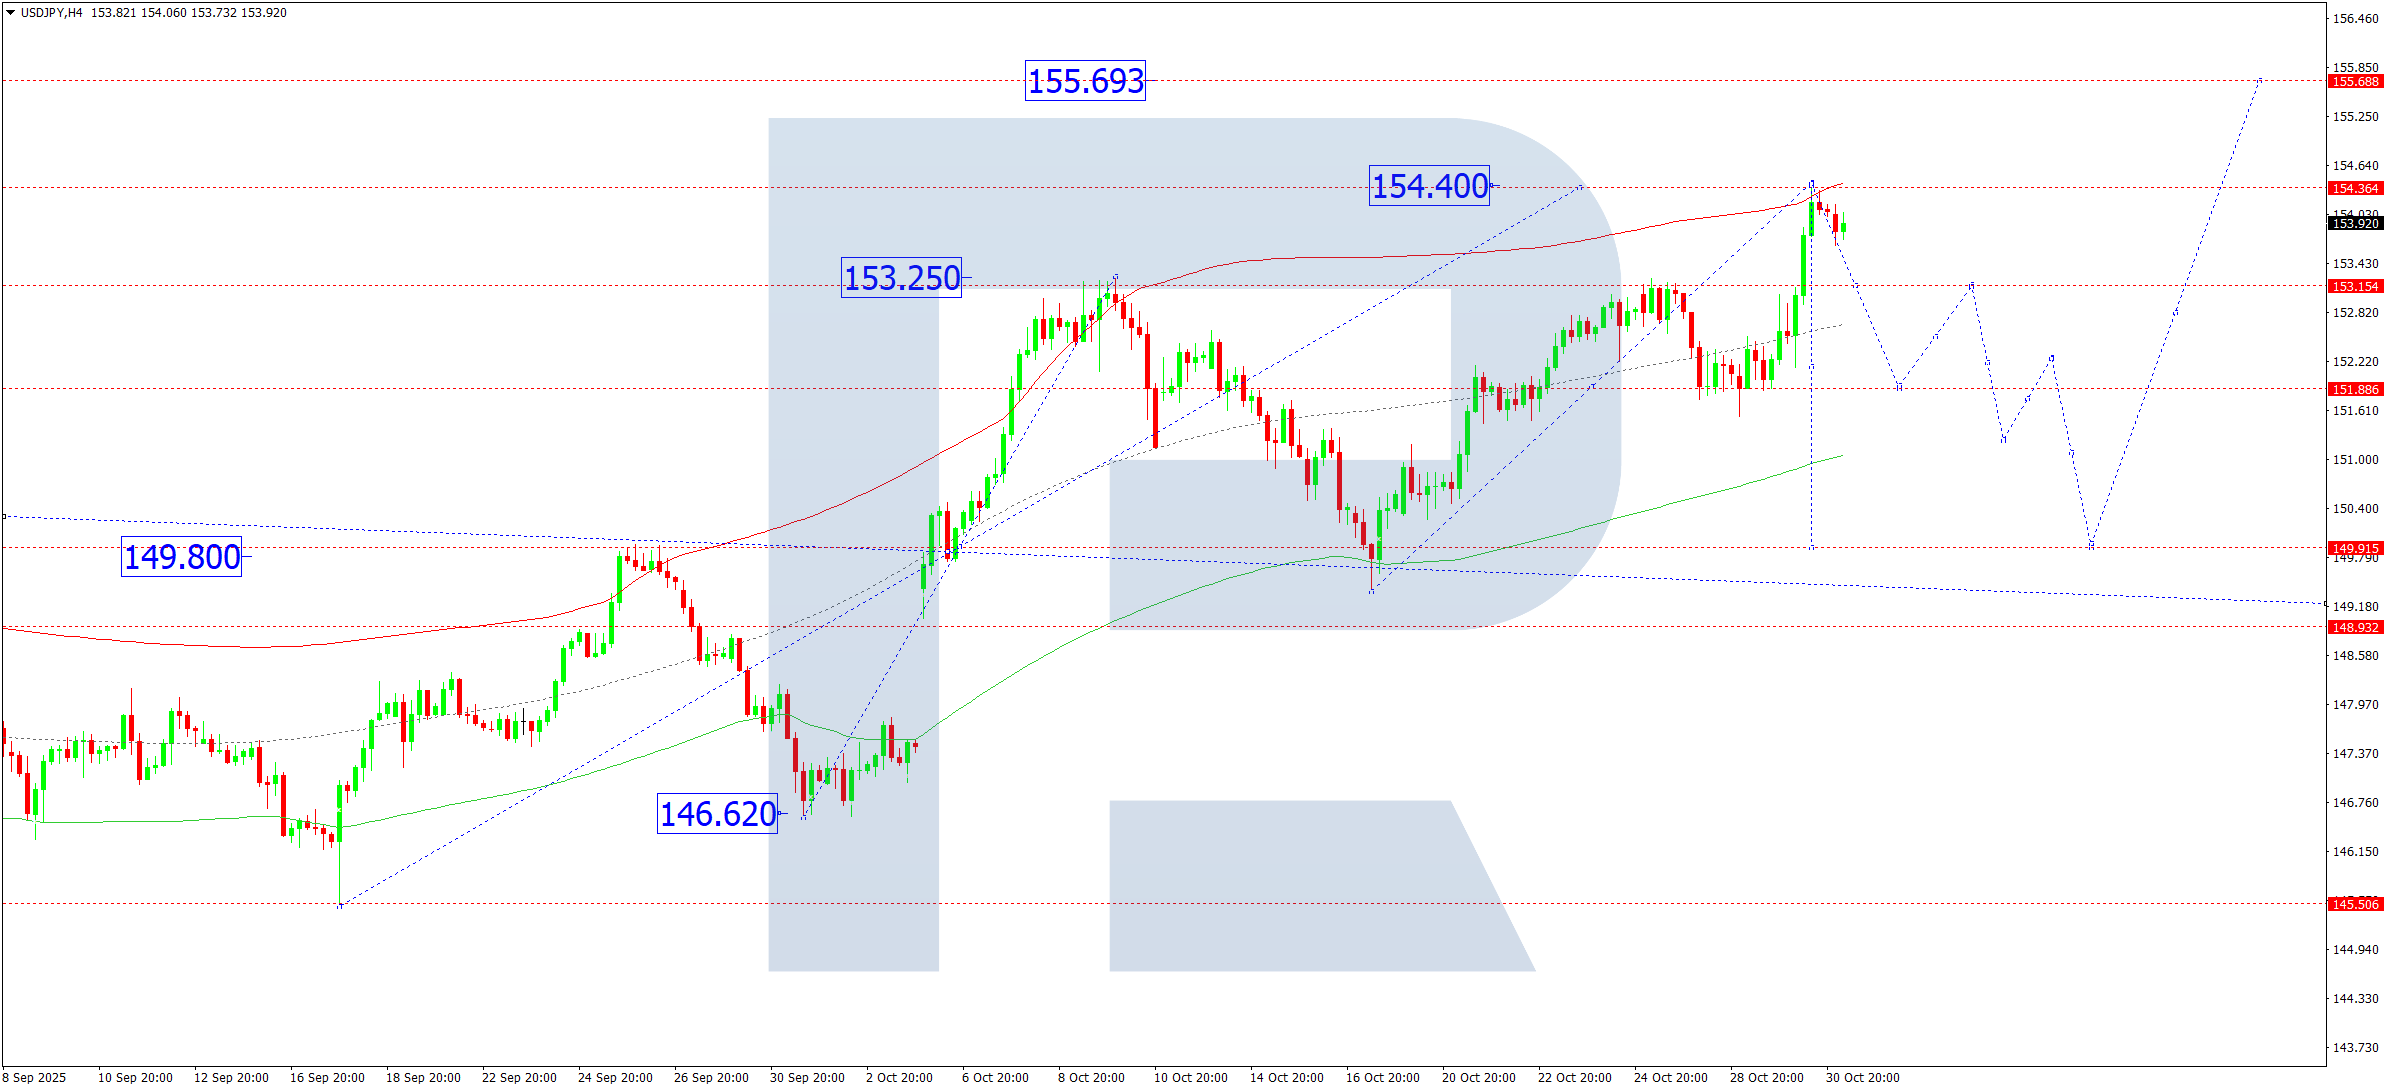
On the H4 chart, USDJPY completed an upward wave to 154.40. On 31 October 2025, a consolidation phase below this level is expected. A breakout to the upside could trigger further growth towards 155.70, with an extended target at 157.57. Conversely, a downside breakout could initiate a correction towards 151.88.
This scenario is confirmed by the Elliott Wave structure and bullish wave matrix, with the key pivot point at 151.88. Having reached the upper boundary of the Price Envelope at 154.40, the pair may pull back to the central line at 153.15, and possibly to the lower boundary near 151.88.
Technical indicators suggest a correction towards 153.15 and 151.88.
Risk Warning: Past trading performance does not guarantee future results.
GBPUSD Forecast
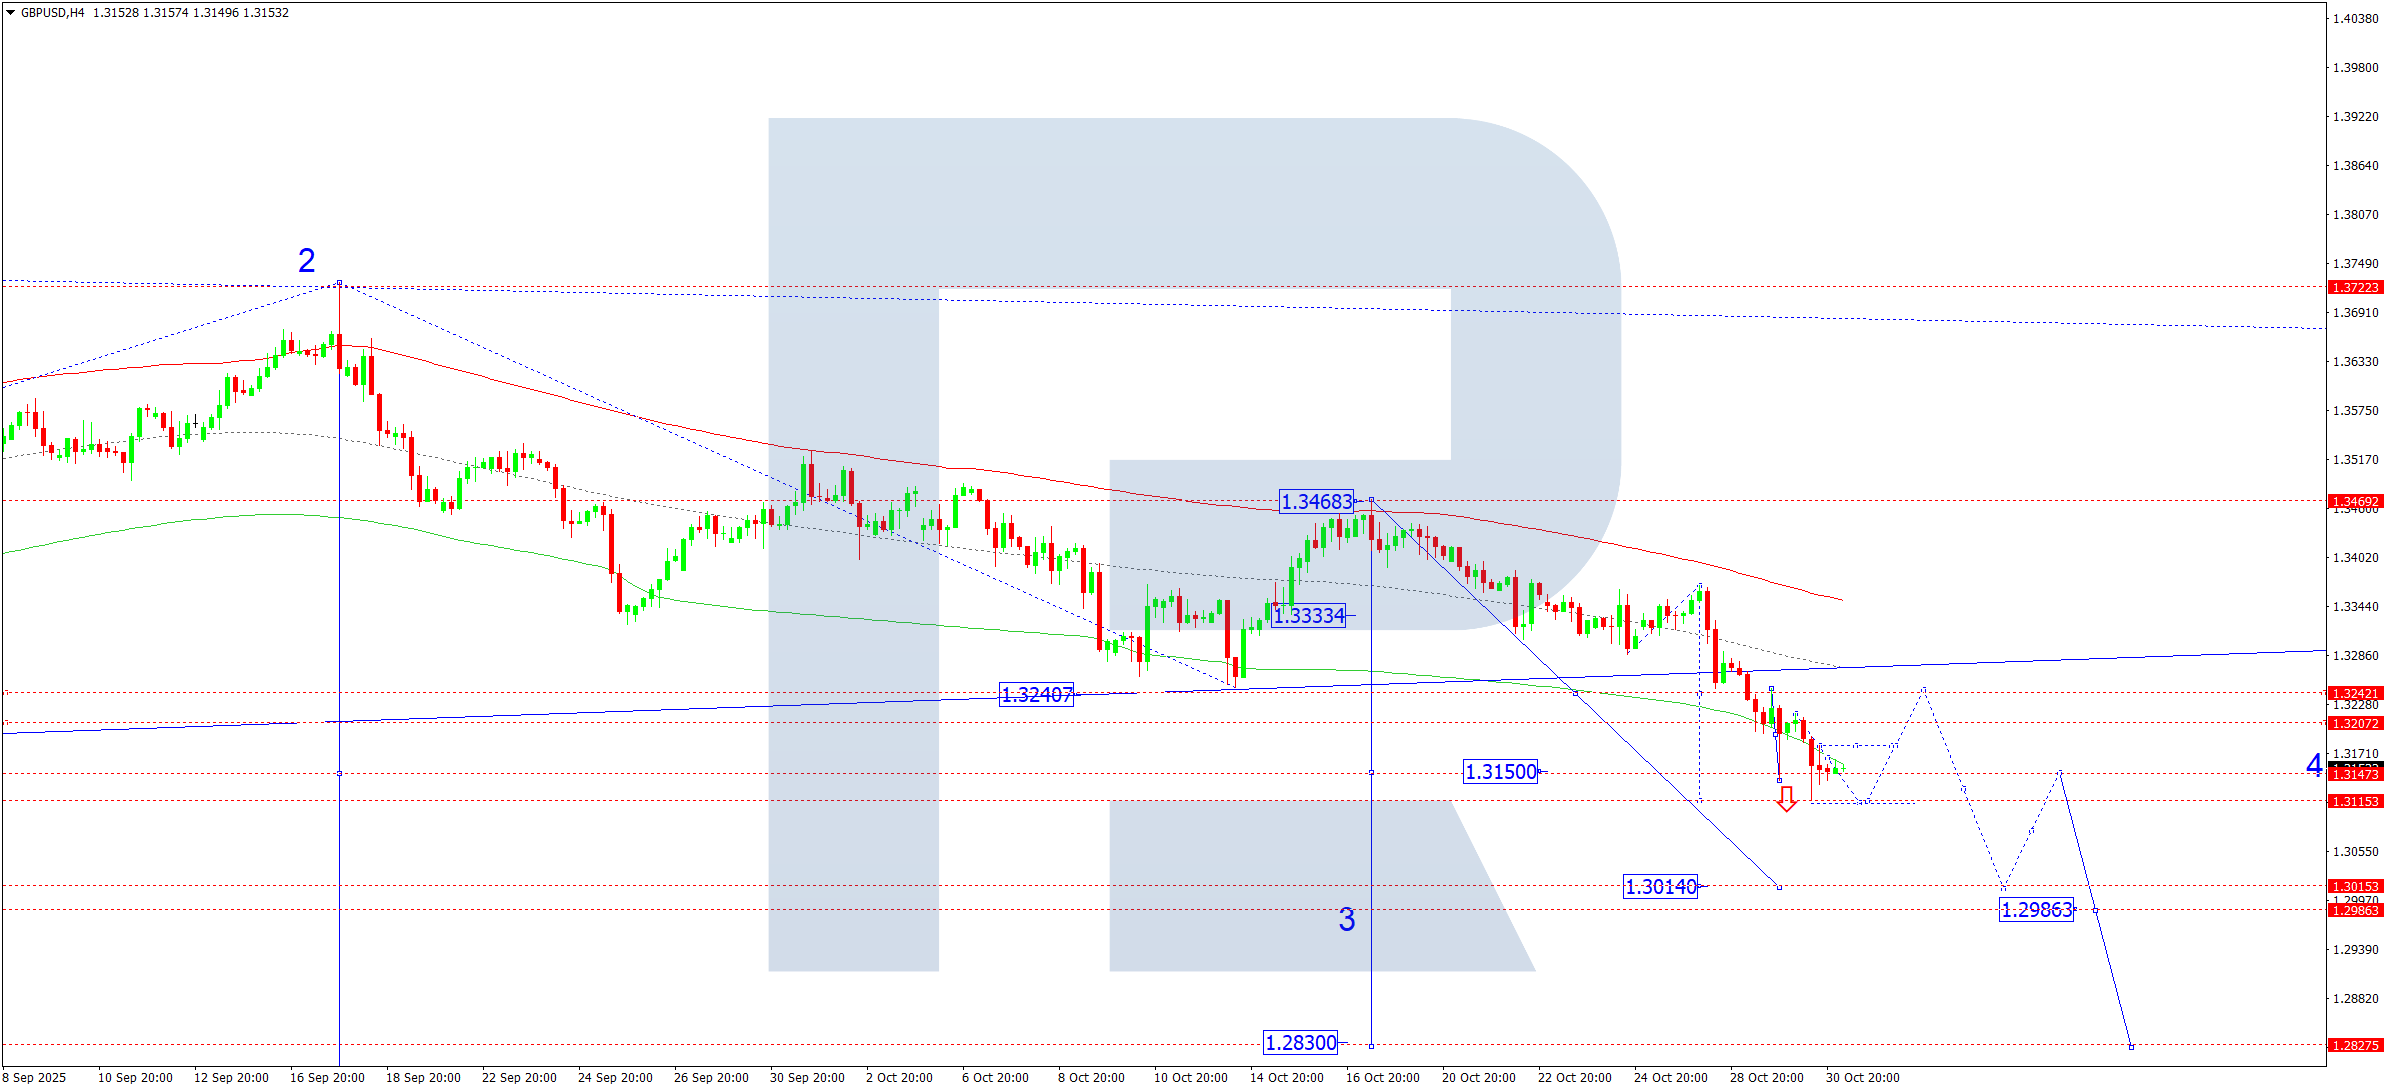
On the H4 chart, GBPUSD has reached its decline target at 1.3116. On 31 October 2025, consolidation around 1.3150 is likely. A breakout to the upside could lead to a corrective move towards 1.3242, while a downside breakout would signal a continuation of the downtrend towards 1.3014.
The Elliott Wave analysis and bearish wave matrix confirm this scenario, with a key pivot point at 1.3242. The market has completed a downward move to the lower boundary of the Price Envelope at 1.3116 and may now correct towards the central line at 1.3242 before resuming its decline to 1.3014.
Technical indicators suggest a correction towards 1.3242, followed by renewed weakness towards 1.3014.
Risk Warning: Past trading performance does not guarantee future results.
AUDUSD Forecast
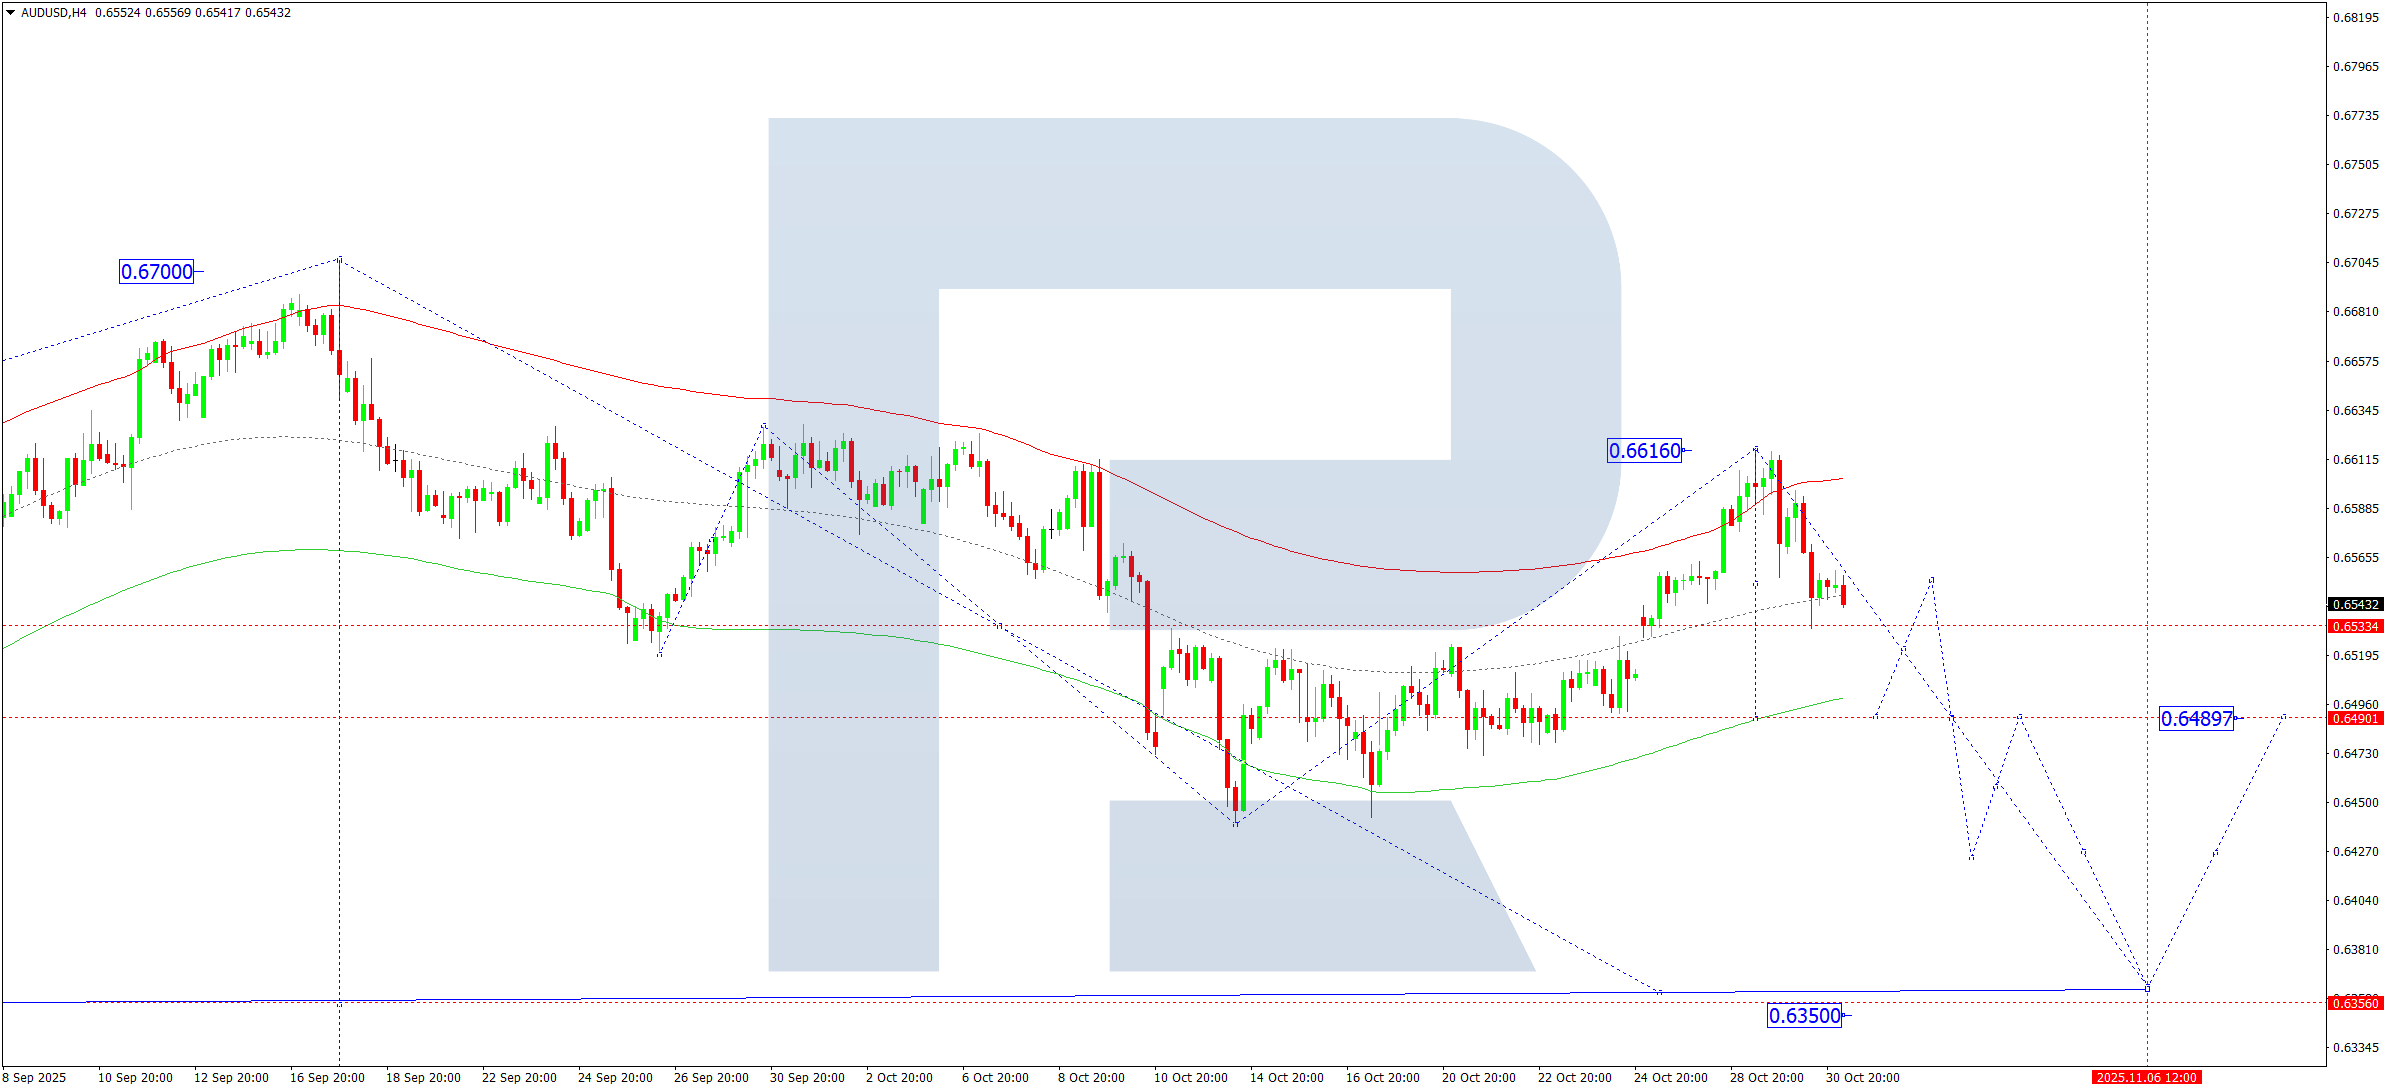
On the H4 chart, AUDUSD has completed a downward wave to 0.6532. On 31 October 2025, the pair is consolidating above this level. A breakout below could extend the decline towards 0.6489, with the trend possibly reaching 0.6350.
This setup is consistent with the Elliott Wave formation and bearish wave matrix, where 0.6533 acts as the key pivot level. After correcting to the upper boundary of the Price Envelope at 0.6616, a move towards the lower boundary at 0.6489 is expected.
Technical indicators point to a continuation of the downward wave towards 0.6489.
Risk Warning: Past trading performance does not guarantee future results.
USDCAD Forecast
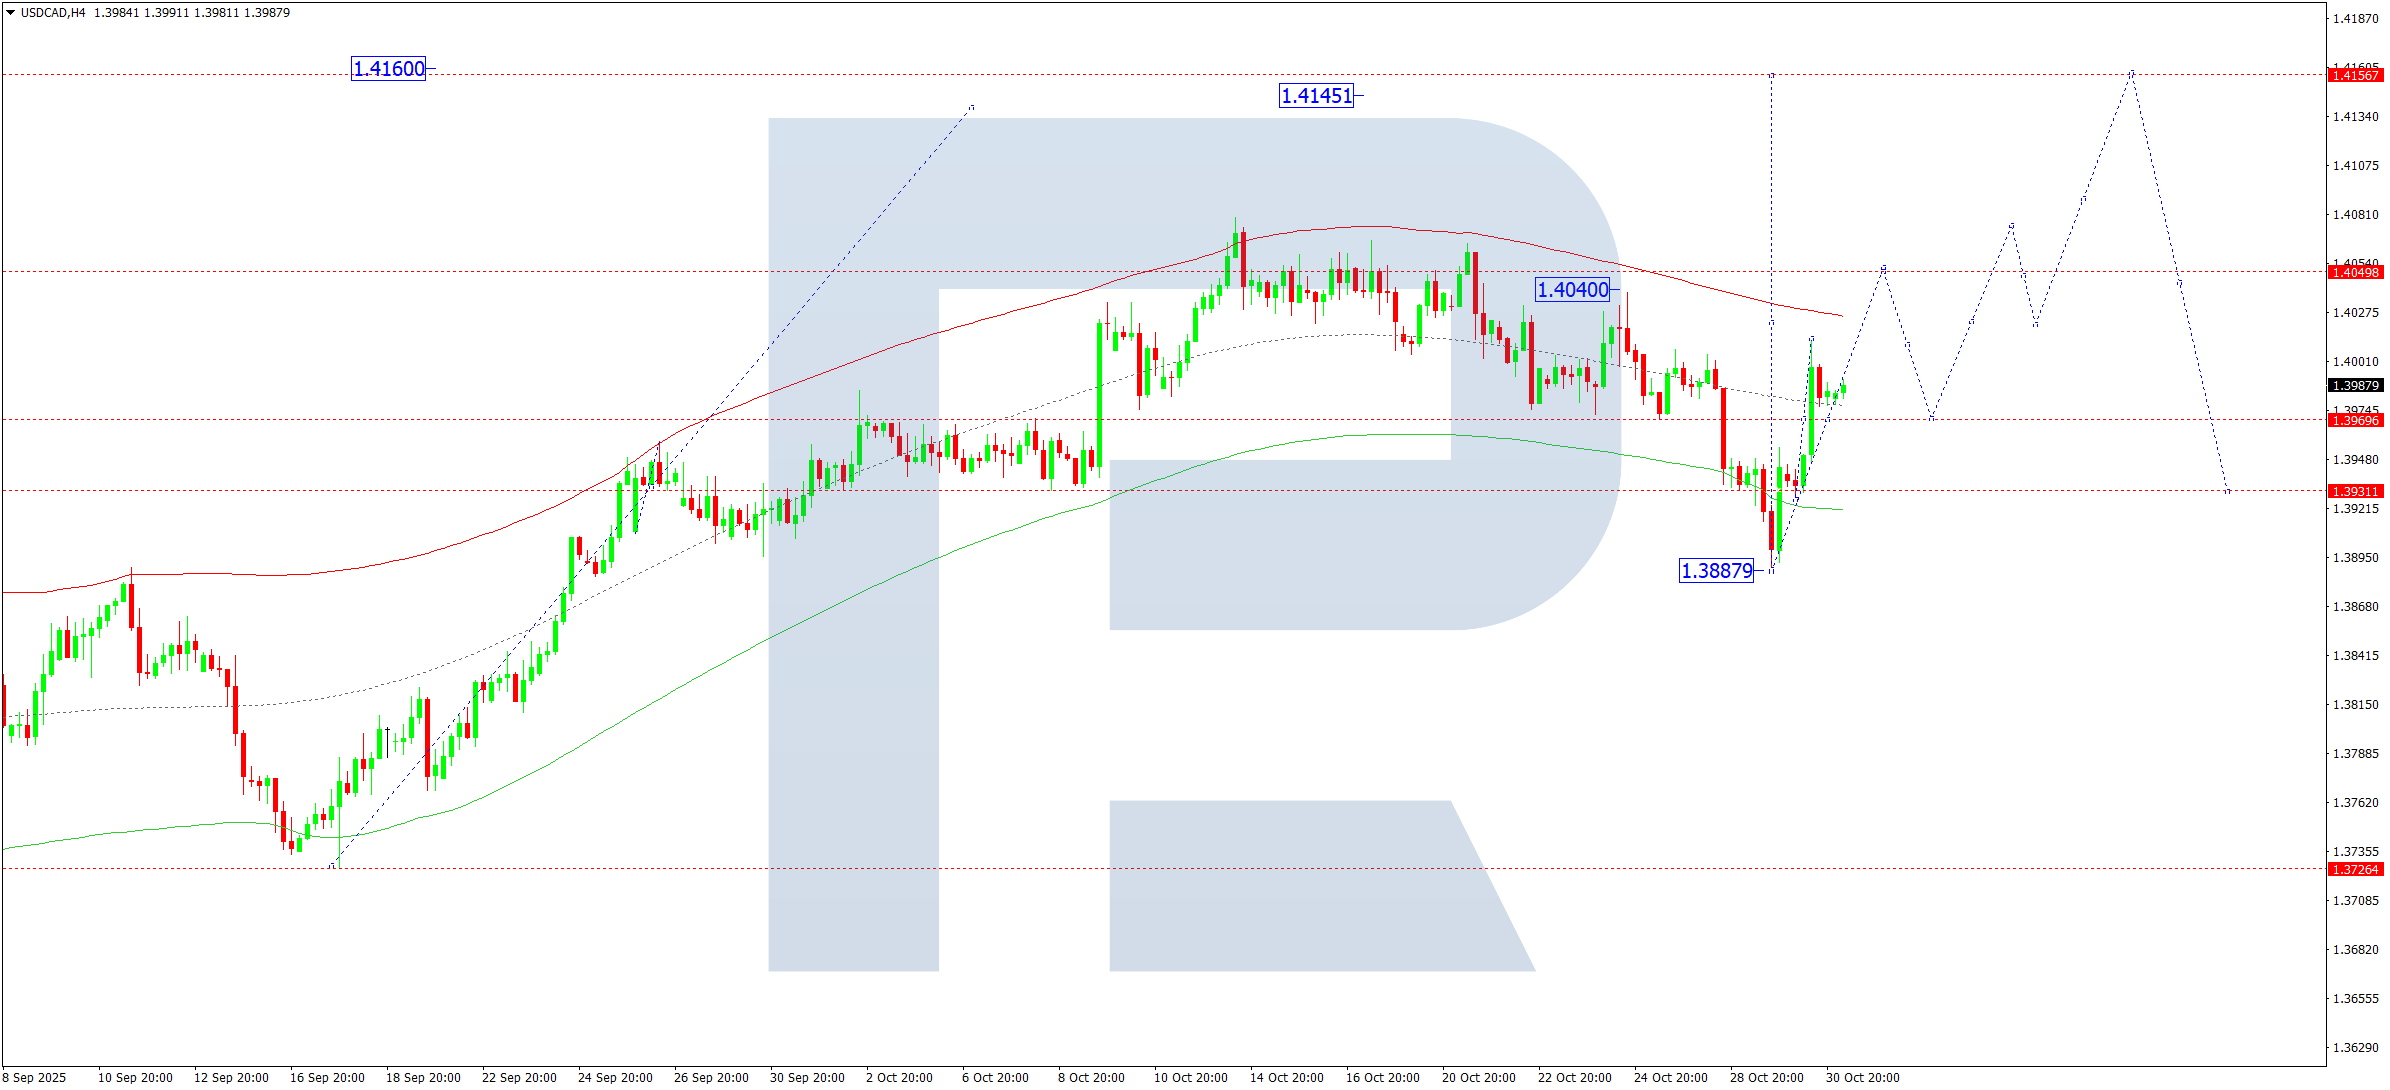
On the H4 chart, USDCAD continues to develop an upward wave targeting 1.4050. On 31 October 2025, the pair is expected to reach this level before correcting towards 1.3969. A consolidation near this area may follow. A breakout above 1.3969 would open the way for growth to 1.4141, with potential extension to 1.4160.
The Elliott Wave structure and bullish wave matrix support this view, with 1.3969 as the key pivot point. After a correction to the lower boundary of the Price Envelope at 1.3888, a rise towards 1.4050 is anticipated, followed by a possible pullback to 1.3969 for a retest.
Technical indicators suggest that the upward wave could continue towards 1.4050.
Risk Warning: Past trading performance does not guarantee future results.
XAUUSD Forecast (Gold)
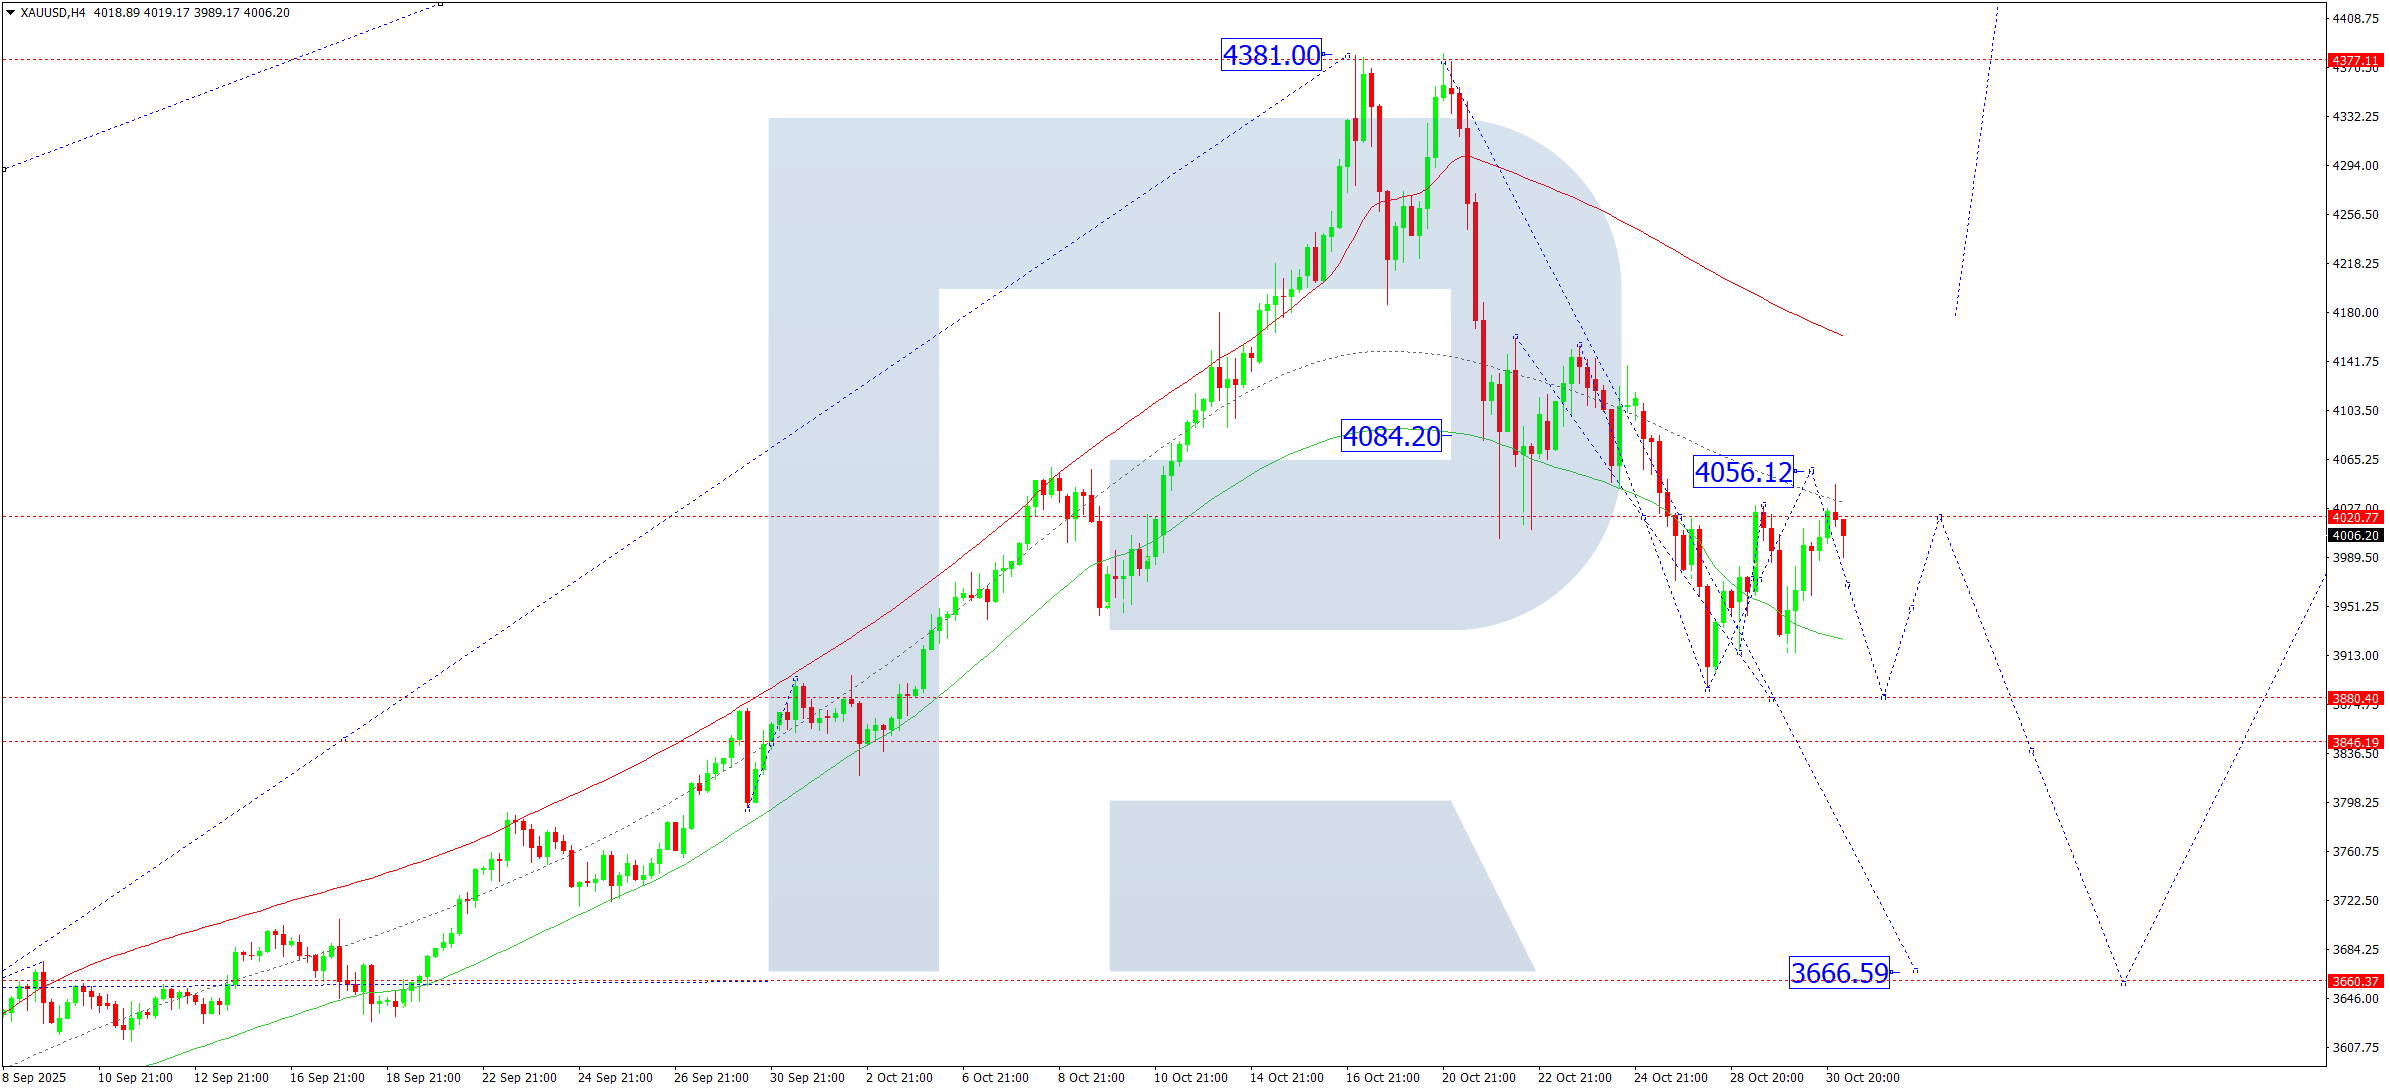
On the H4 chart, XAUUSD is forming a consolidation range around 3,974. On 31 October 2025, the range may expand upward to 4,056, then decline towards 3,880, followed by another rise to 4,020. This will likely form a broader sideways range around 4,020. A breakout to the downside would pave the way for a correction to 3,785, with potential extension to 3,660. Conversely, an upward breakout could drive the price towards 4,400.
The Elliott Wave pattern and bullish wave matrix validate this outlook, with 3,660 serving as the key pivot. The price is expected to test the lower boundary of the Price Envelope near 3,880, followed by a recovery to the central line at 4,020.
Technical indicators point to a continuation of the correction towards 3,880.
Risk Warning: Past trading performance does not guarantee future results.
Brent Forecast
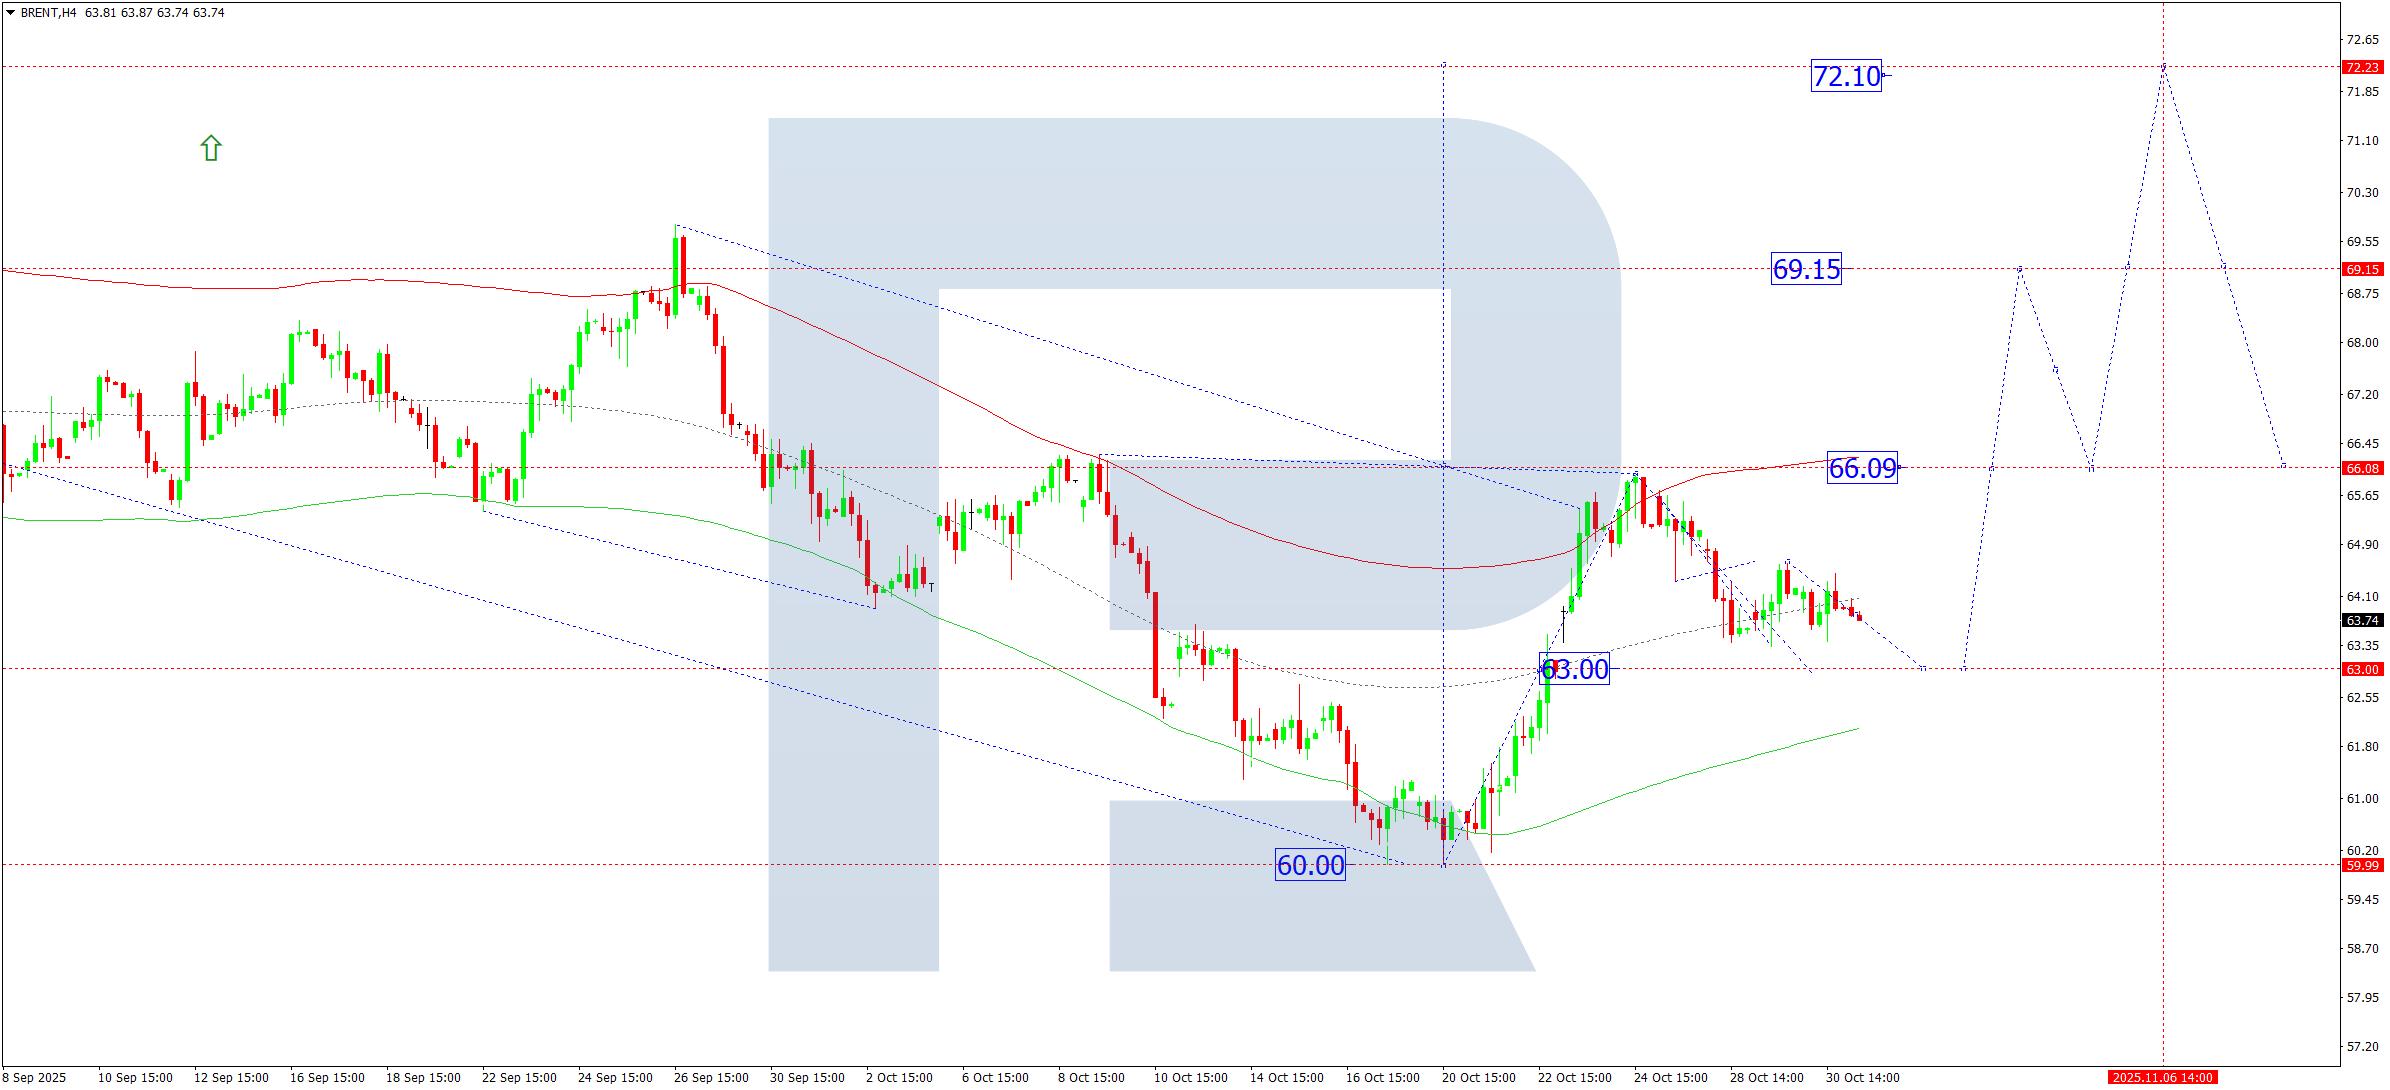
On the H4 chart, Brent crude is completing a corrective move towards 63.00. On 31 October 2025, the correction may end around this level, paving the way for growth towards 66.10. A breakout above this resistance could trigger further bullish momentum towards 69.15, with an extended target at 72.22.
This scenario is confirmed by the Elliott Wave structure and bullish wave matrix, with a key pivot at 66.00. The market reached the upper boundary of the Price Envelope near 65.99 and continues to correct towards the lower boundary at 63.00. Upon completion, an upward move towards 69.15 is anticipated.
Technical indicators suggest the correction may complete near 63.00, followed by renewed growth towards 69.15.
Risk Warning: Past trading performance does not guarantee future results.
Leave a Reply