
Daily Technical Analysis and Forecast – 5 November 2025
EURUSD Forecast
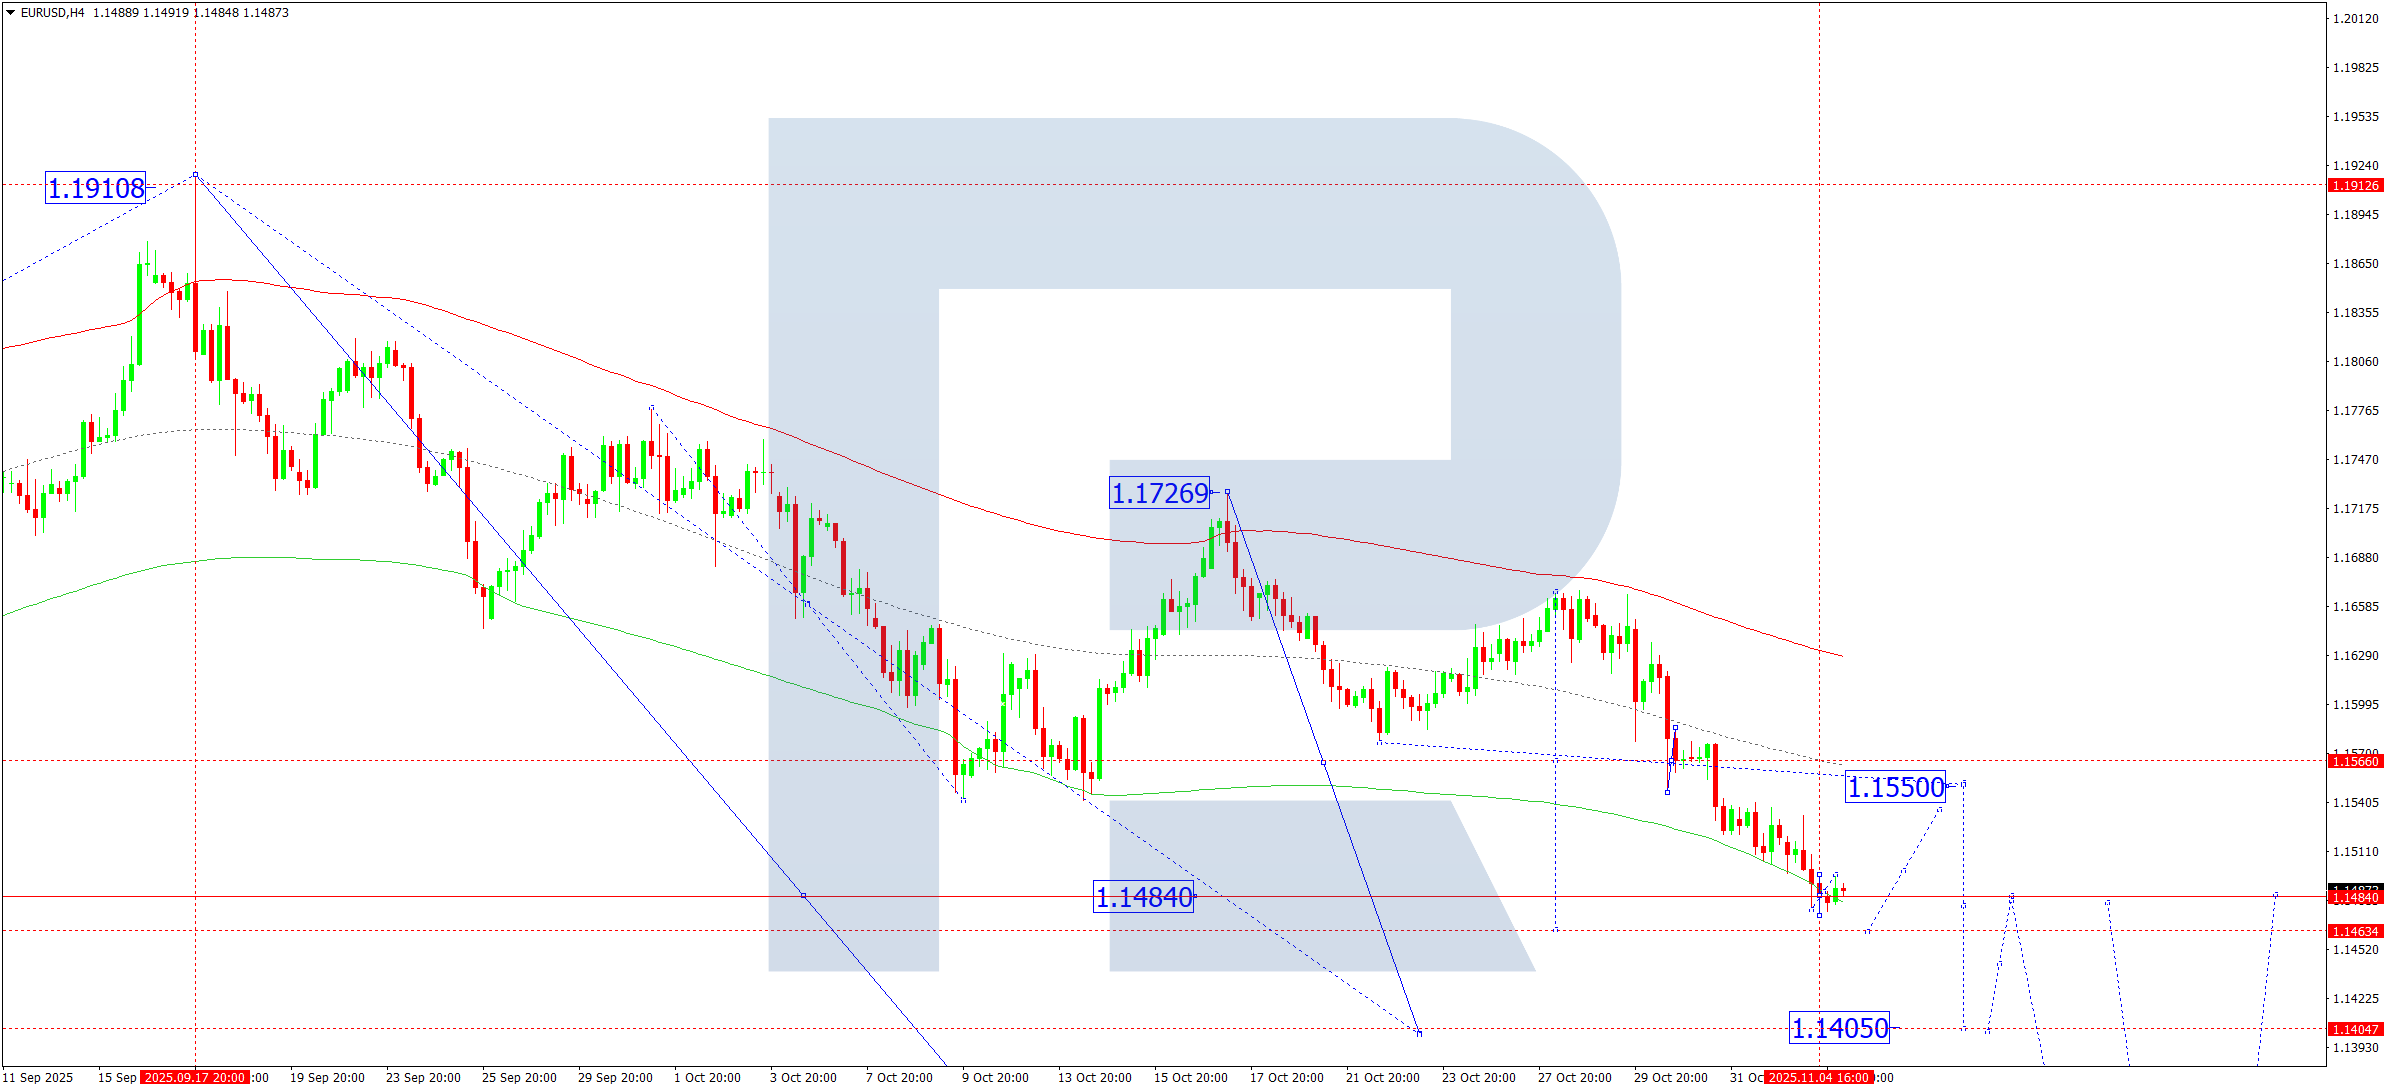
On the H4 chart, EURUSD has completed a downward movement towards 1.1473. On 5 November 2025, a consolidation range is expected to form around this level. A breakout to the upside could initiate a corrective phase towards 1.1550, while a downside breakout would signal continuation of the third downward wave towards 1.1460, with an extended target near 1.1405.
This scenario aligns with the Elliott Wave structure, which reflects a bearish wave matrix and defines the key pivot at 1.1566. A move toward the lower boundary of the Price Envelope near 1.1460 is anticipated today, followed by a short-term rebound towards its central line at 1.1550.
Technical outlook: Expect a decline to 1.1460, followed by the start of a corrective rise towards 1.1550.
USDJPY Forecast
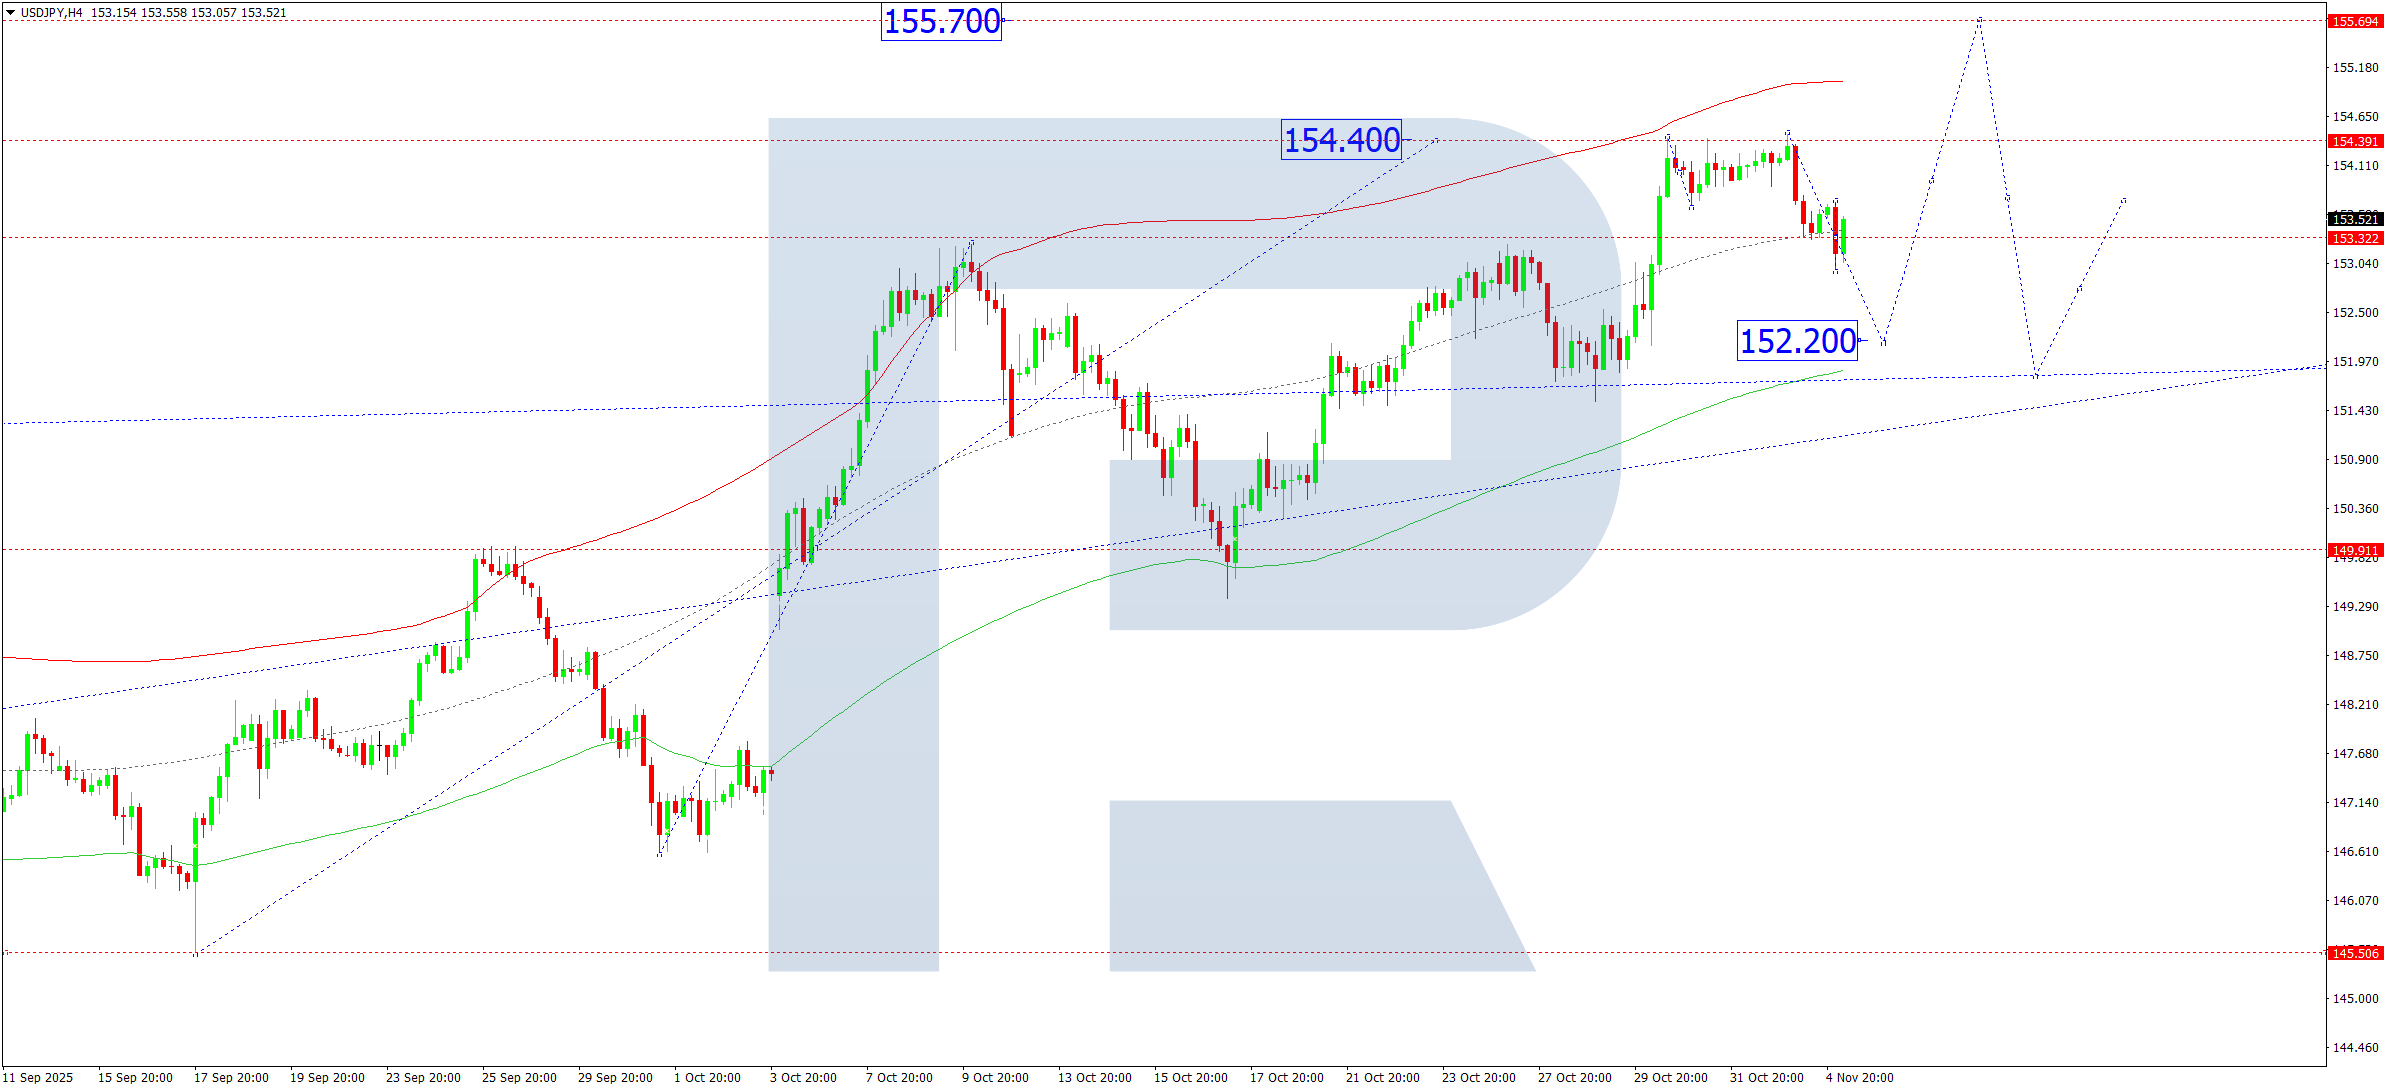
On the H4 chart, USDJPY is consolidating around 153.33. An upside breakout would pave the way for continued growth towards 155.70, potentially extending to 157.57 as a local target. A downside breakout could trigger a correction to 152.22, followed by renewed growth towards 155.70.
This setup is confirmed by a bullish Elliott Wave matrix with a key pivot at 151.90. The market is currently oscillating near the Price Envelope’s midline at 153.33. A brief pullback towards the lower boundary at 152.22 is possible before the next upward impulse.
Technical outlook: A correction towards 152.22 remains likely today.
GBPUSD Forecast
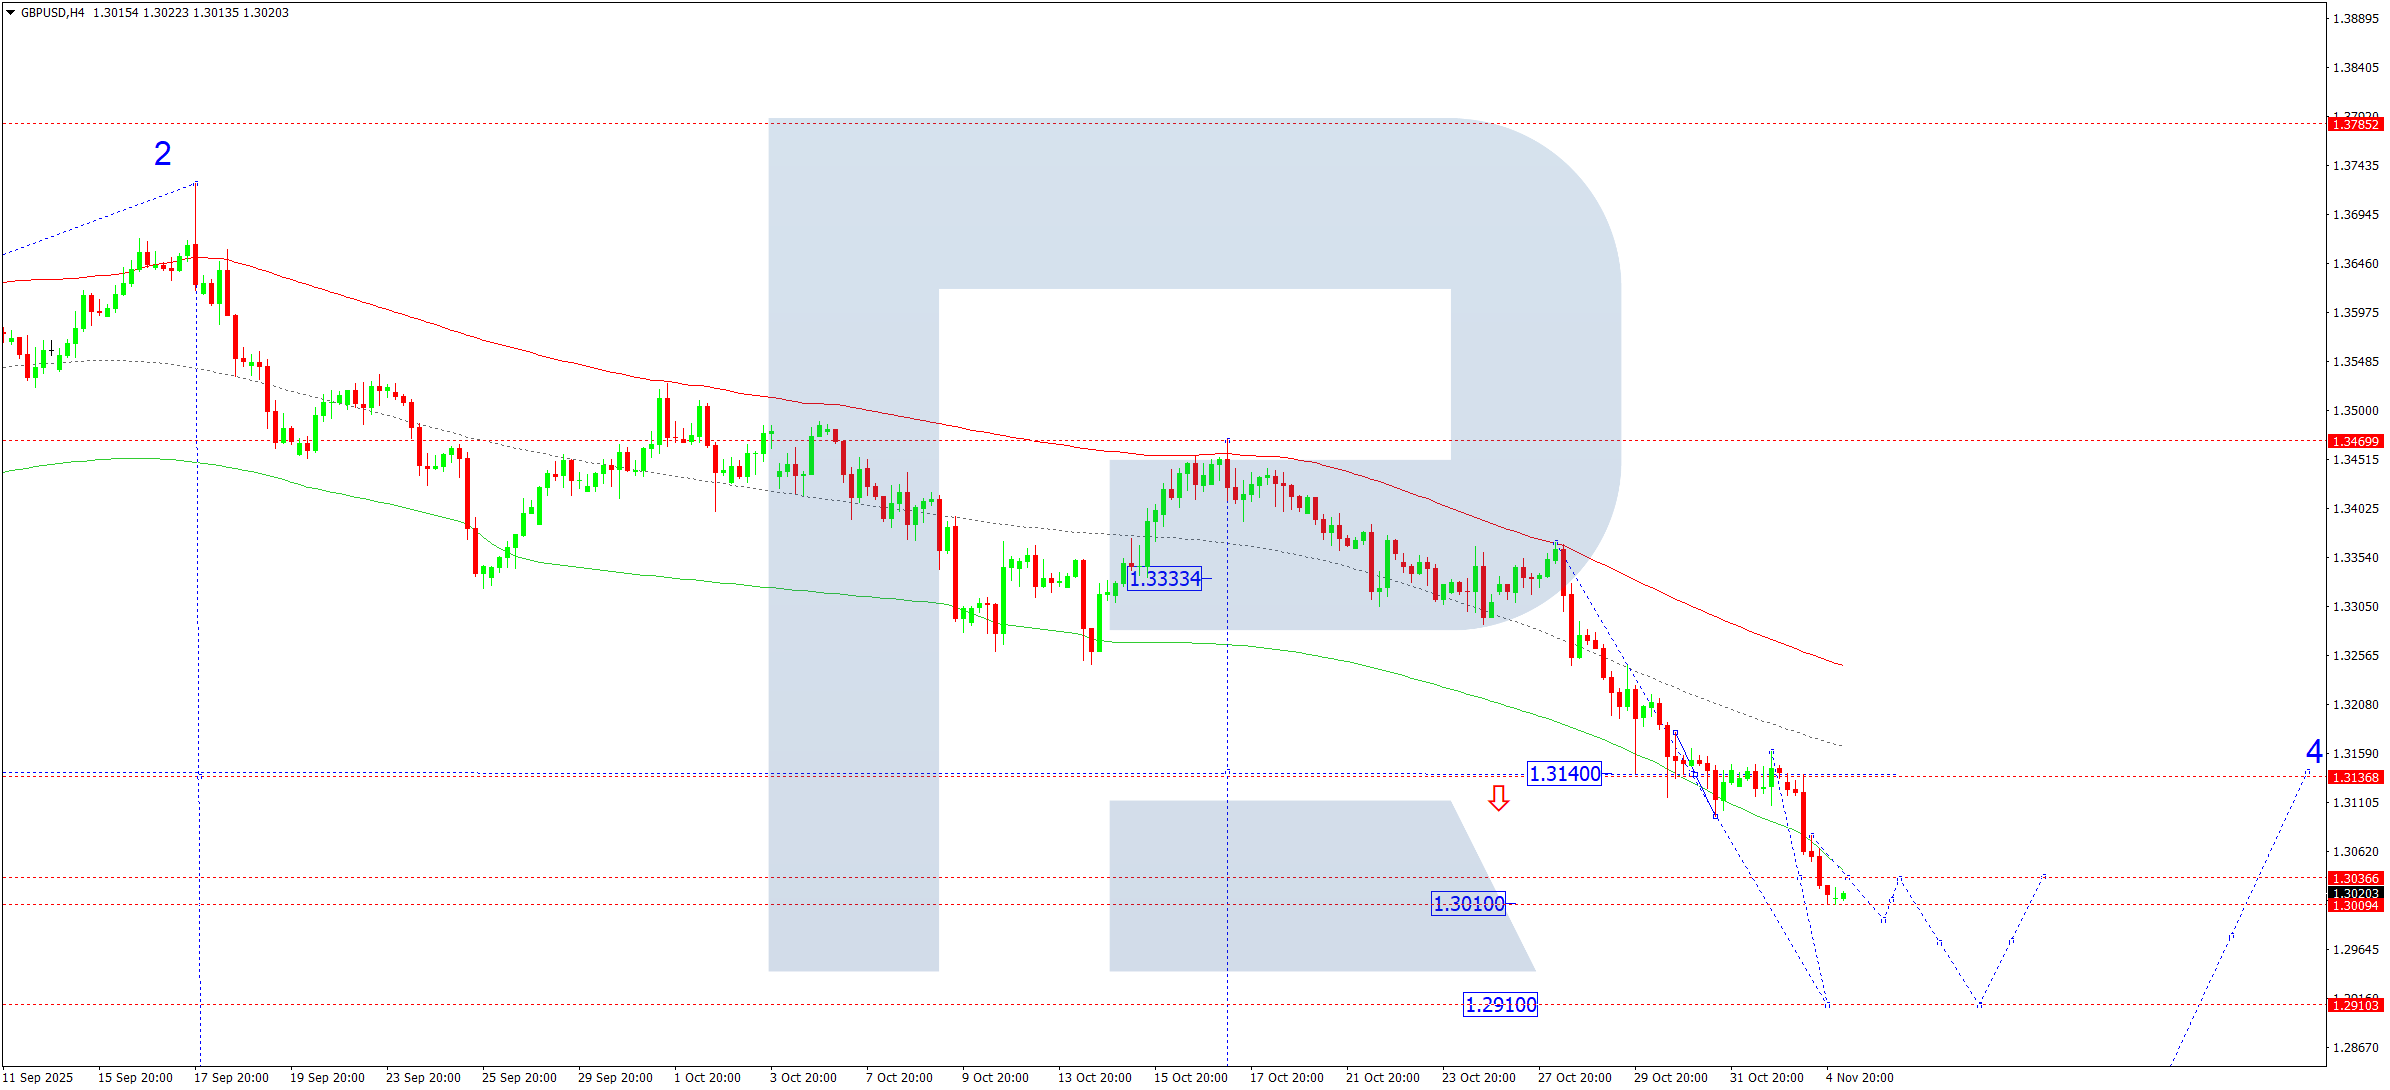
On the H4 chart, GBPUSD has reached its downside target at 1.3010. On 5 November 2025, the pair is expected to consolidate near 1.3033. A breakout upwards could trigger a correction to 1.3140, while a downward breakout would suggest continuation of the decline towards 1.2910.
According to the Elliott Wave analysis, a bearish wave matrix dominates, with the pivot point positioned at 1.3140. After touching the lower boundary of the Price Envelope at 1.3010, a short-term corrective rebound to the midline at 1.3140 is possible before resuming the downtrend to 1.2910.
Technical outlook: A corrective rise towards 1.3140, followed by a decline to 1.2910, is expected.
AUDUSD Forecast
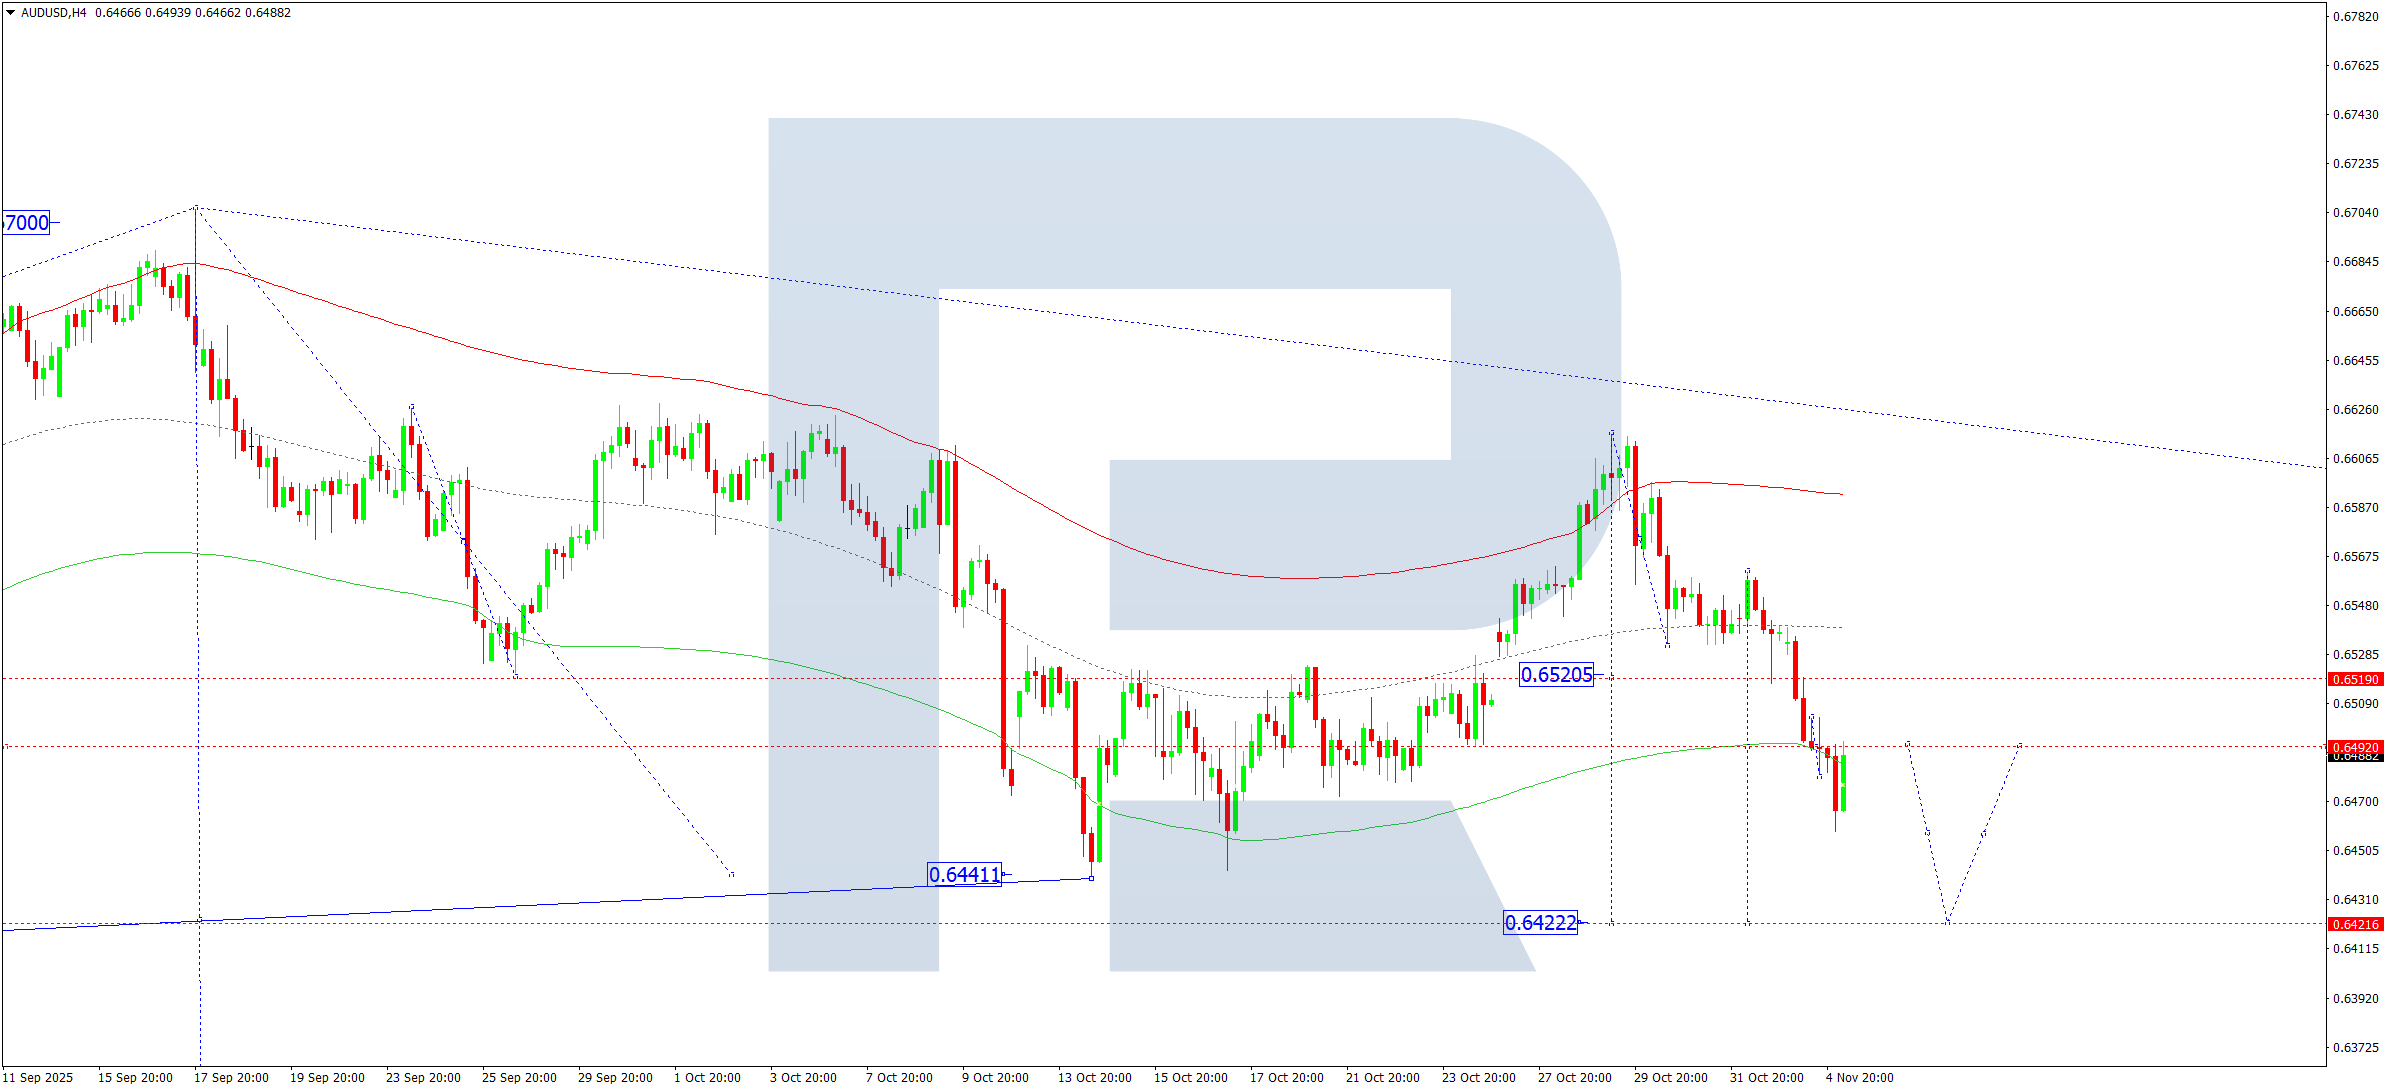
On the H4 chart, AUDUSD completed a downward move to 0.6458 and is now consolidating above this level. A downside breakout would open the way for continuation towards 0.6422, with potential to extend the trend to 0.6308.
This scenario is consistent with a bearish Elliott Wave pattern and a key pivot at 0.6492. The pair has reached the lower boundary of the Price Envelope, and further decline to 0.6422 appears likely after a brief consolidation phase.
Technical outlook: Expect continued pressure towards 0.6422.
USDCAD Forecast
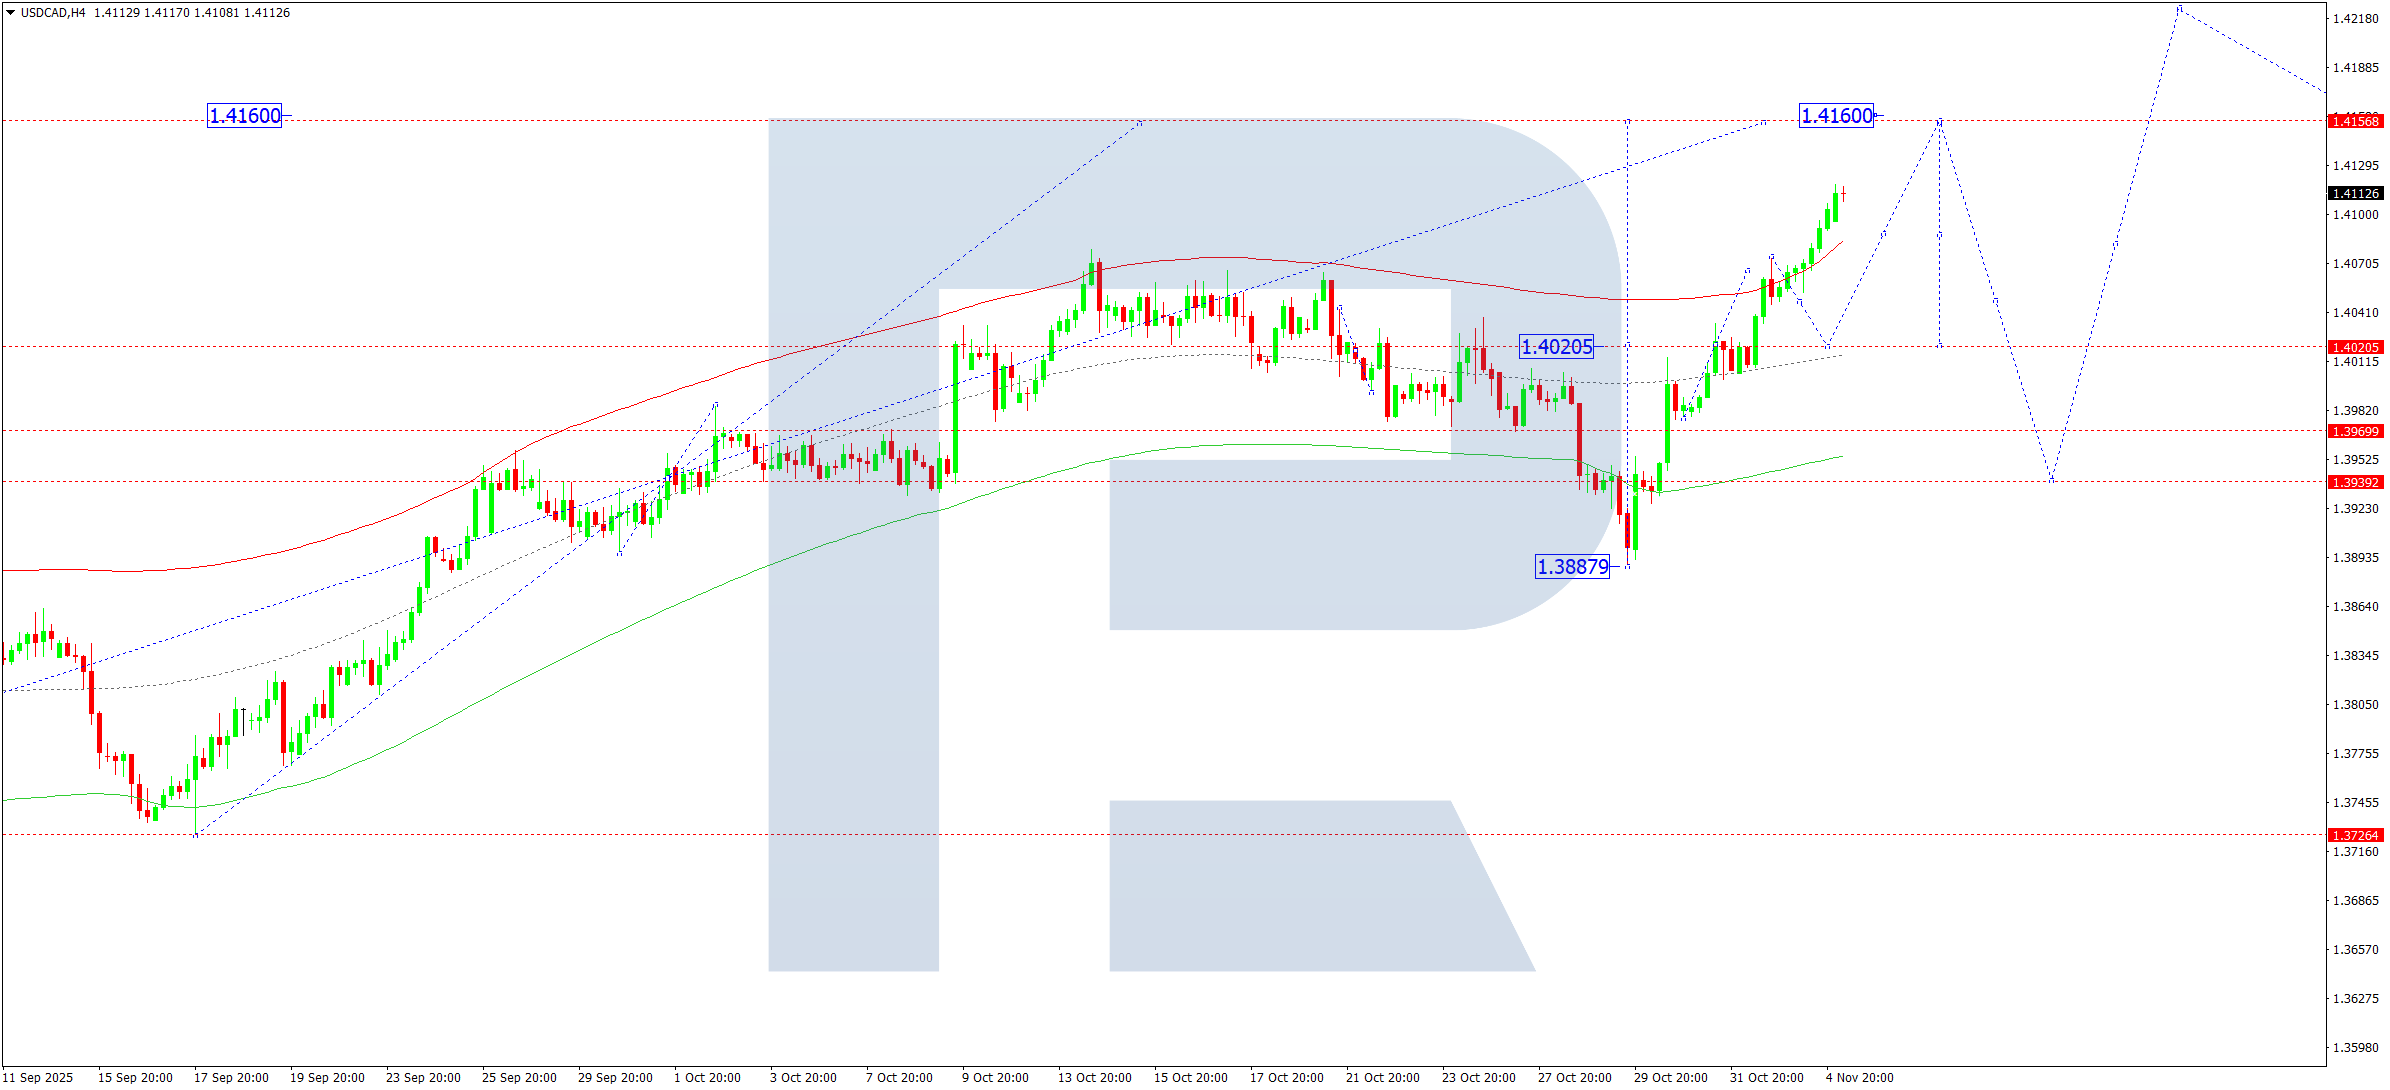
On the H4 chart, USDCAD is extending its upward movement towards 1.4160, expected to be reached during 5 November 2025. Afterwards, a correction to 1.4020 may occur, followed by another rally towards 1.4220.
This setup is confirmed by the bullish Elliott Wave structure, with a key pivot at 1.3939. The pair is advancing towards the upper boundary of the Price Envelope at 1.4160. A subsequent pullback to the midline near 1.4020 may develop before resuming growth.
Technical outlook: Further upside movement towards 1.4160 is expected.
XAUUSD Forecast (Gold)
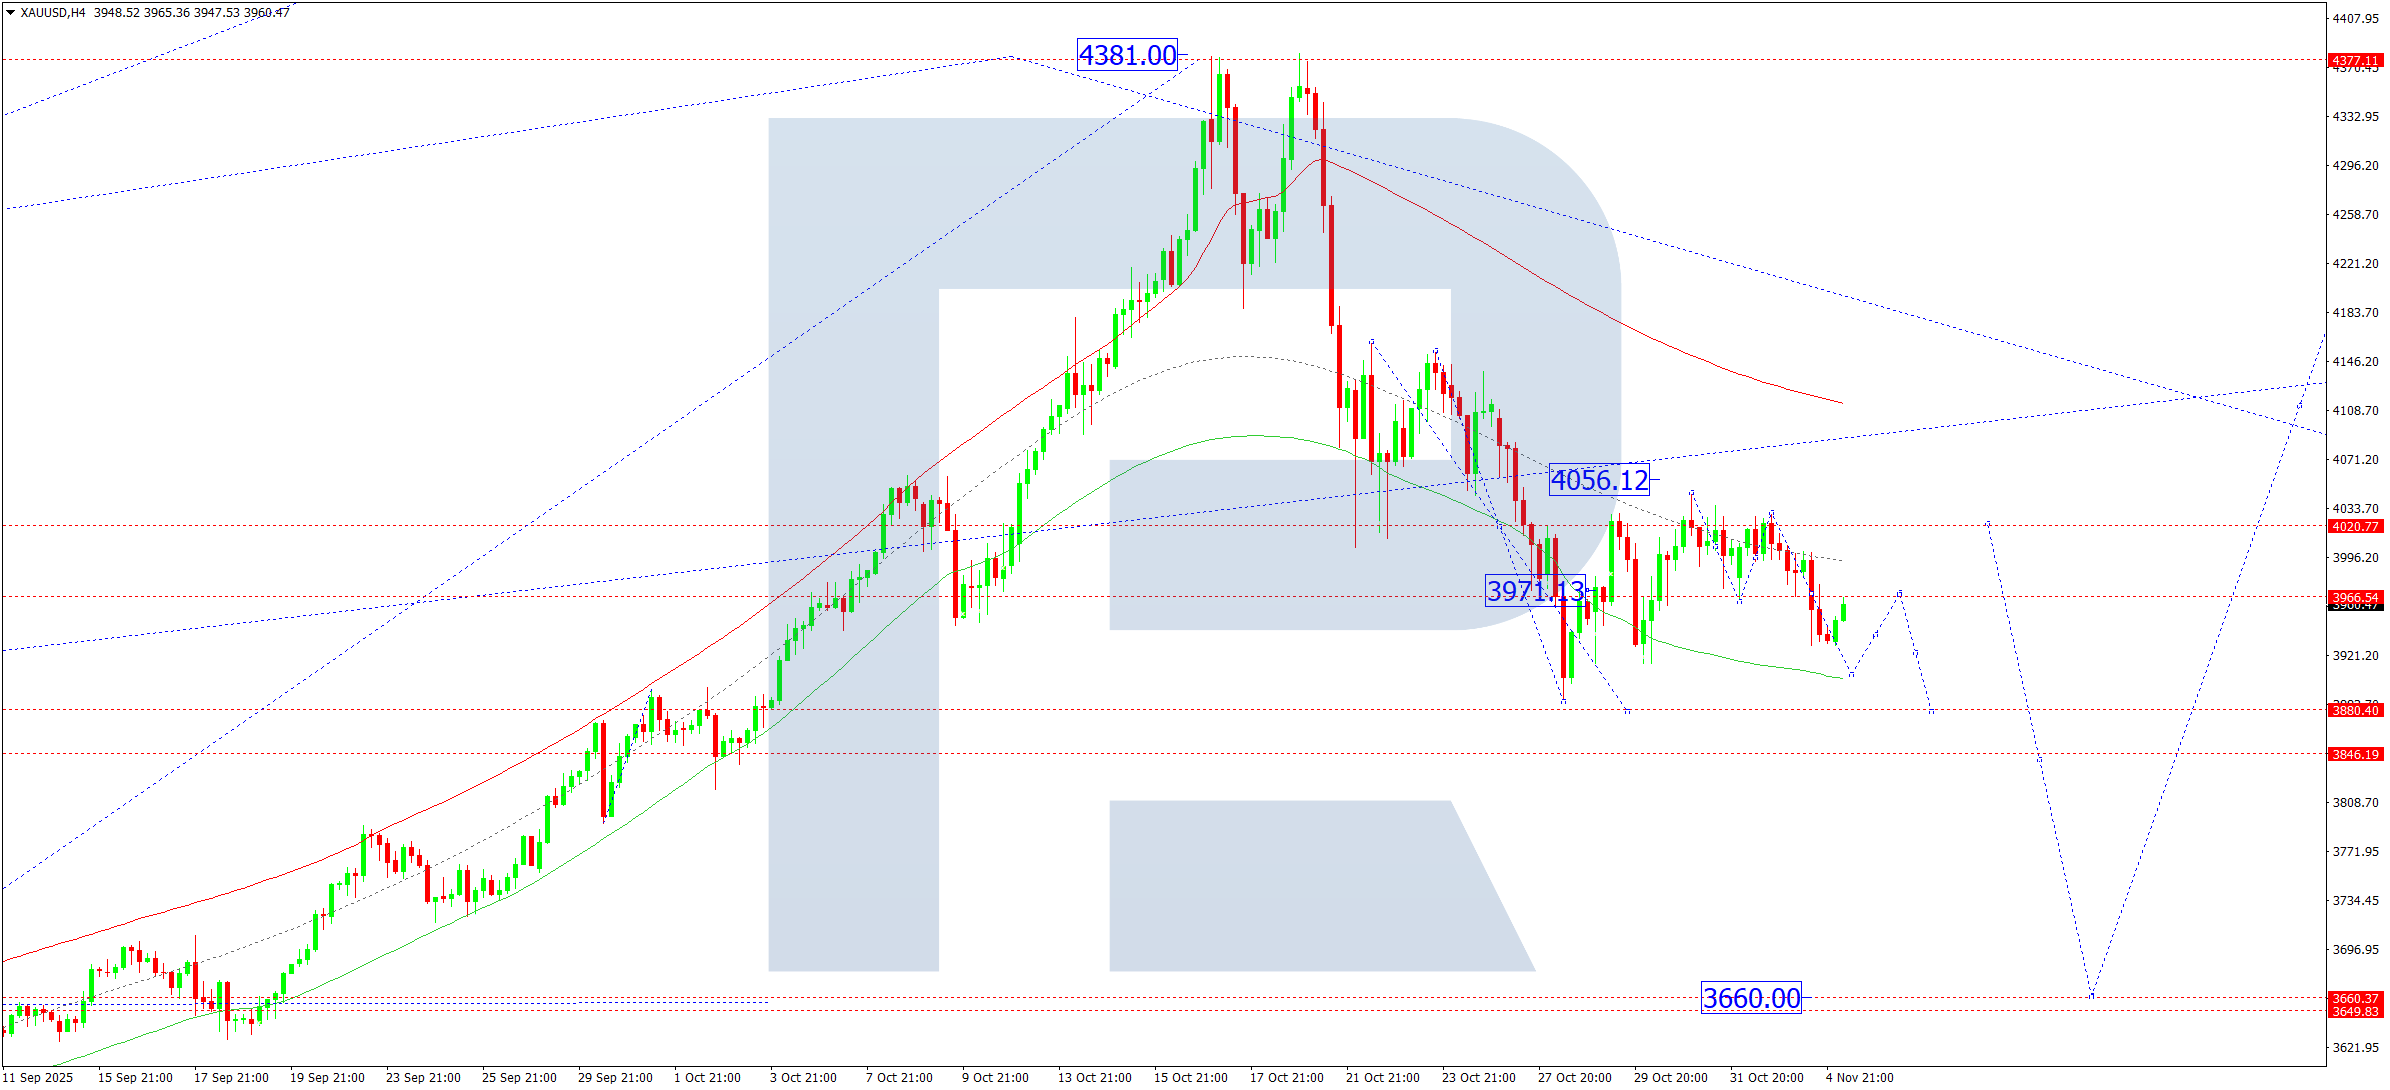
On the H4 chart, XAUUSD remains within a consolidation range around 3,970. On 5 November 2025, the range may extend down to 3,906, then rebound to 3,970. Further decline towards 3,880 cannot be ruled out, as the market continues to consolidate around 4,020. A break below 3,880 would indicate continuation of the correction towards 3,660, while a breakout above 4,020 could open the path to 4,400.
The current Elliott Wave structure indicates a bullish wave matrix with a key pivot at 3,660. A temporary decline to the lower boundary of the Price Envelope at 3,880 is expected before another upward move towards its midline at 4,020.
Technical outlook: Possible decline towards 3,880 before a rebound.
Brent Forecast
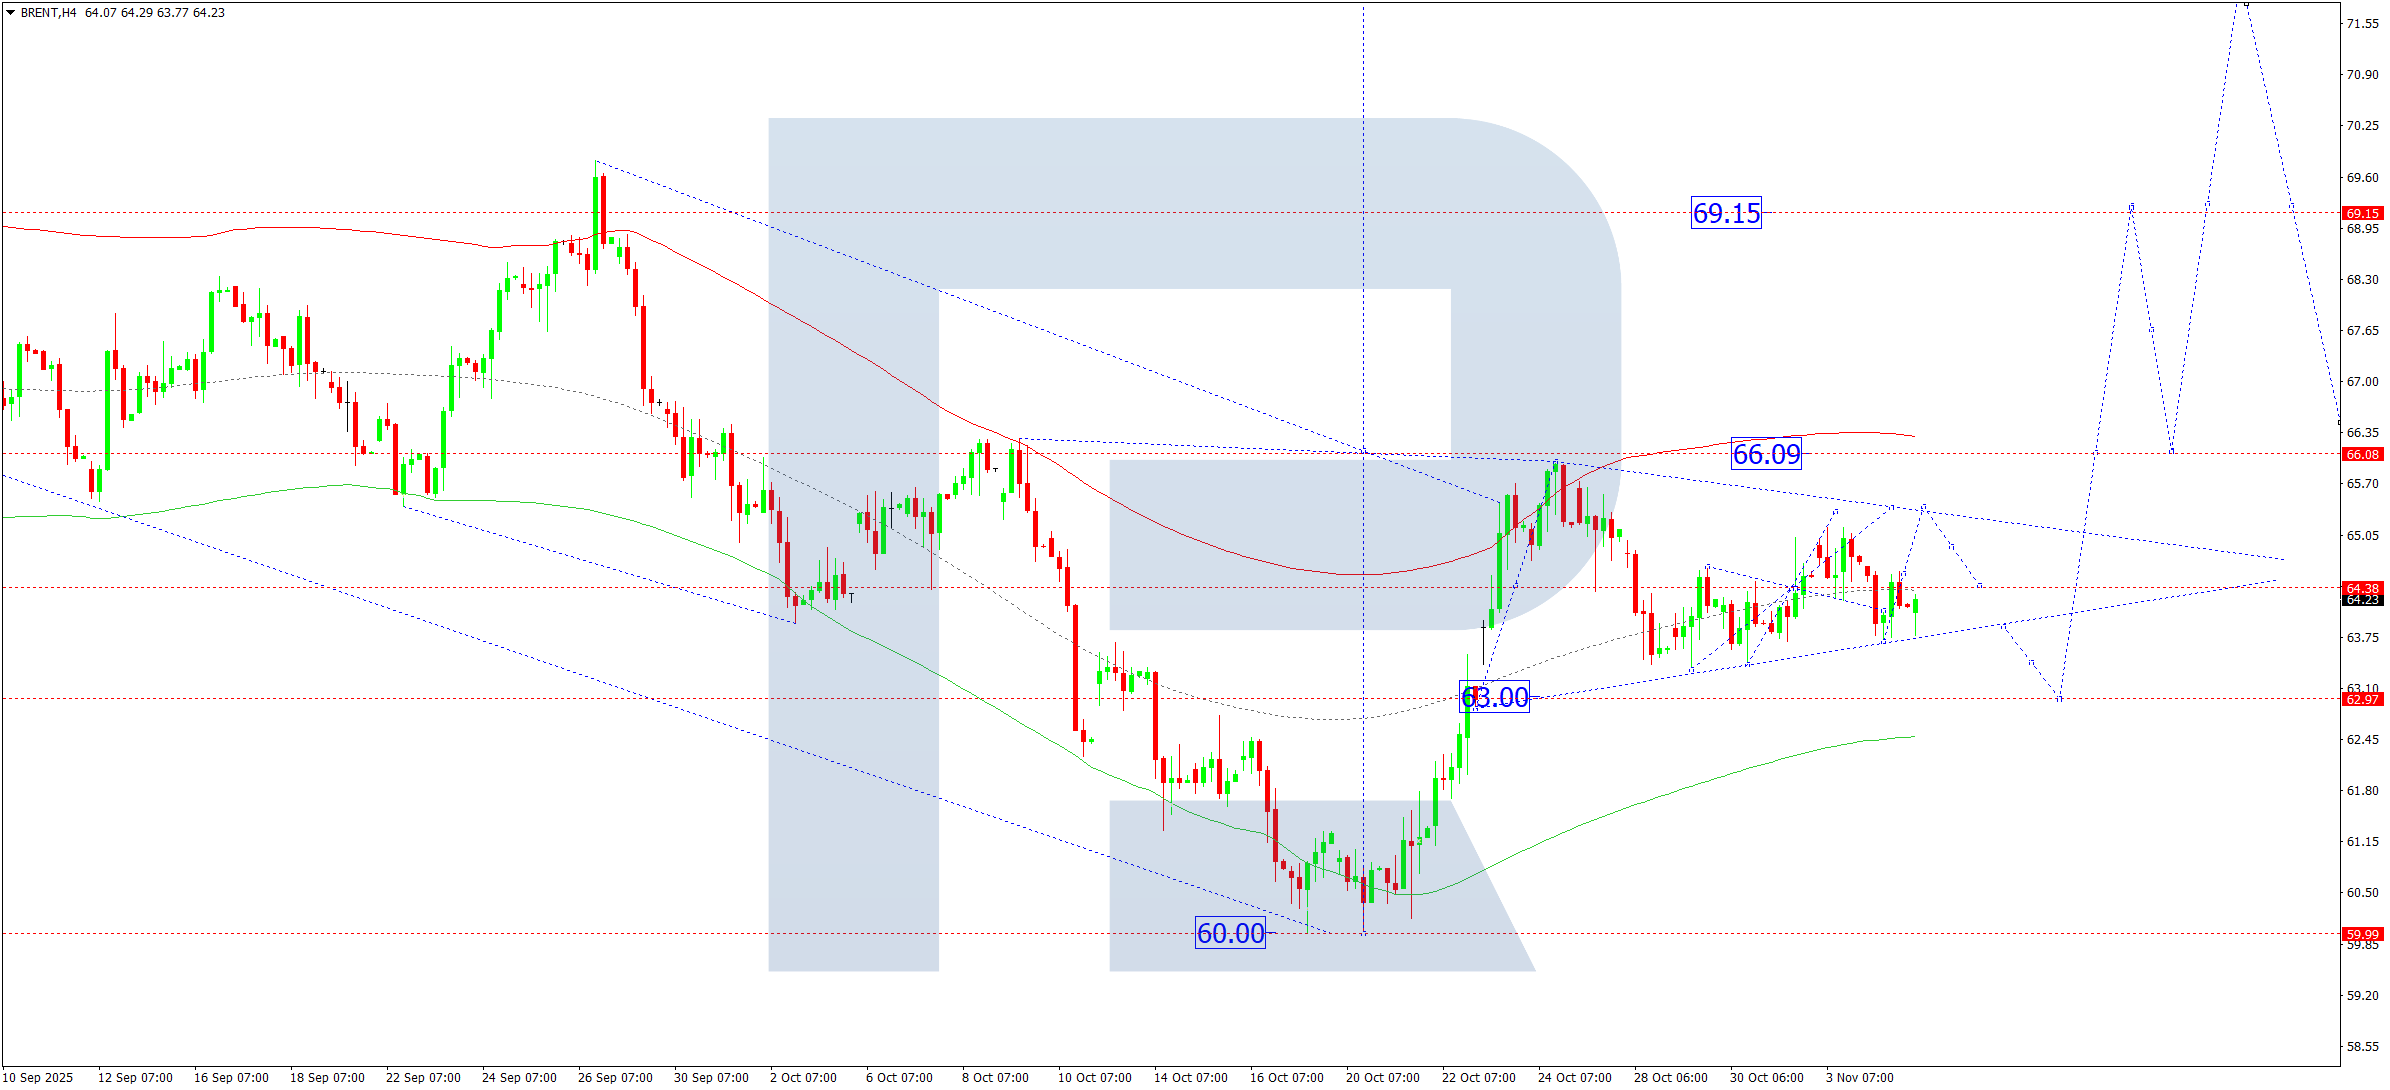
On the H4 chart, Brent crude is forming a broad consolidation near 64.40. On 5 November 2025, the price may rise to 65.40, then fall towards 63.00. Once the correction near 63.00 is complete, a subsequent advance towards 66.10 is anticipated. A breakout above 66.10 would open potential for continued growth towards 69.15, and possibly 72.30.
This scenario aligns with the bullish Elliott Wave framework, with a key pivot at 66.10. After testing the upper boundary of the Price Envelope near 65.99, the market is now in a corrective phase toward the lower boundary at 63.00, which may precede another impulsive move upward.
Technical outlook: The correction may complete near 63.00, followed by a rise towards 69.15.
Risk Warning:
Past performance does not guarantee future results. Trading financial instruments involves risk, and investors may lose all or part of their capital.
Leave a Reply