
Daily Technical Analysis and Forecast — 11 November 2025
EURUSD Forecast
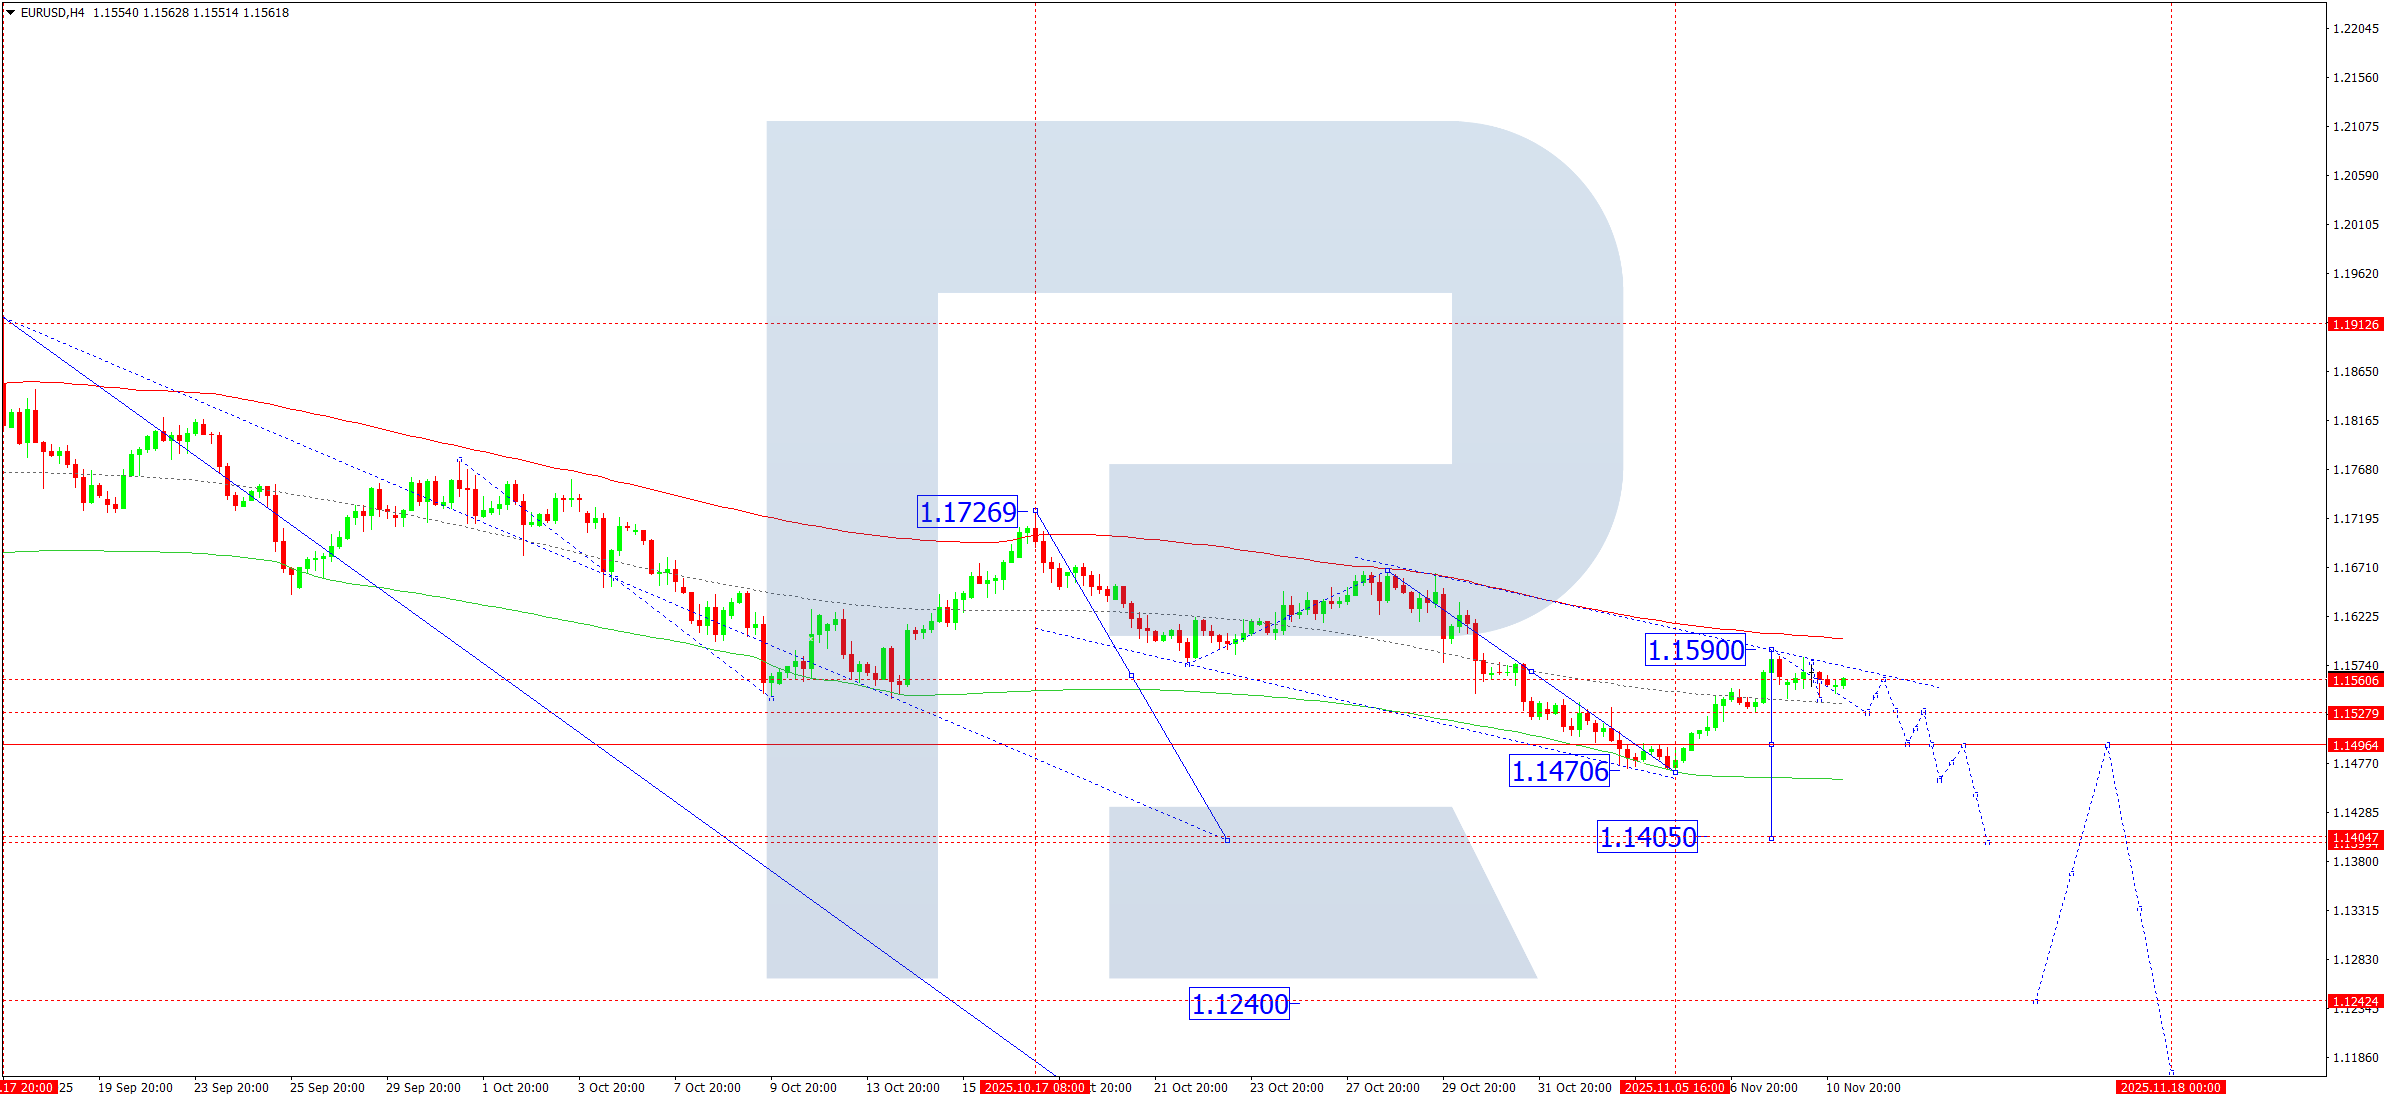
On the H4 chart, EURUSD continues consolidating around 1.1560. On 11 November 2025, the pair may extend its range down to 1.1535, before rebounding towards 1.1560. A breakout above this level could trigger a corrective rise towards 1.1590, while a downward breakout would signal the start of the third wave in the ongoing downtrend towards 1.1490. A sustained move below 1.1490 could extend the decline towards 1.1405, a local target.
The Elliott Wave structure and the downward wave matrix, pivoting from 1.1650, support this bearish outlook. The pair is expected to test the lower boundary of the Price Envelope near 1.1450, with potential continuation towards 1.1405.
Technical outlook: Bearish bias towards 1.1450.
Risk Warning: Past performance does not guarantee future results.
USDJPY Forecast
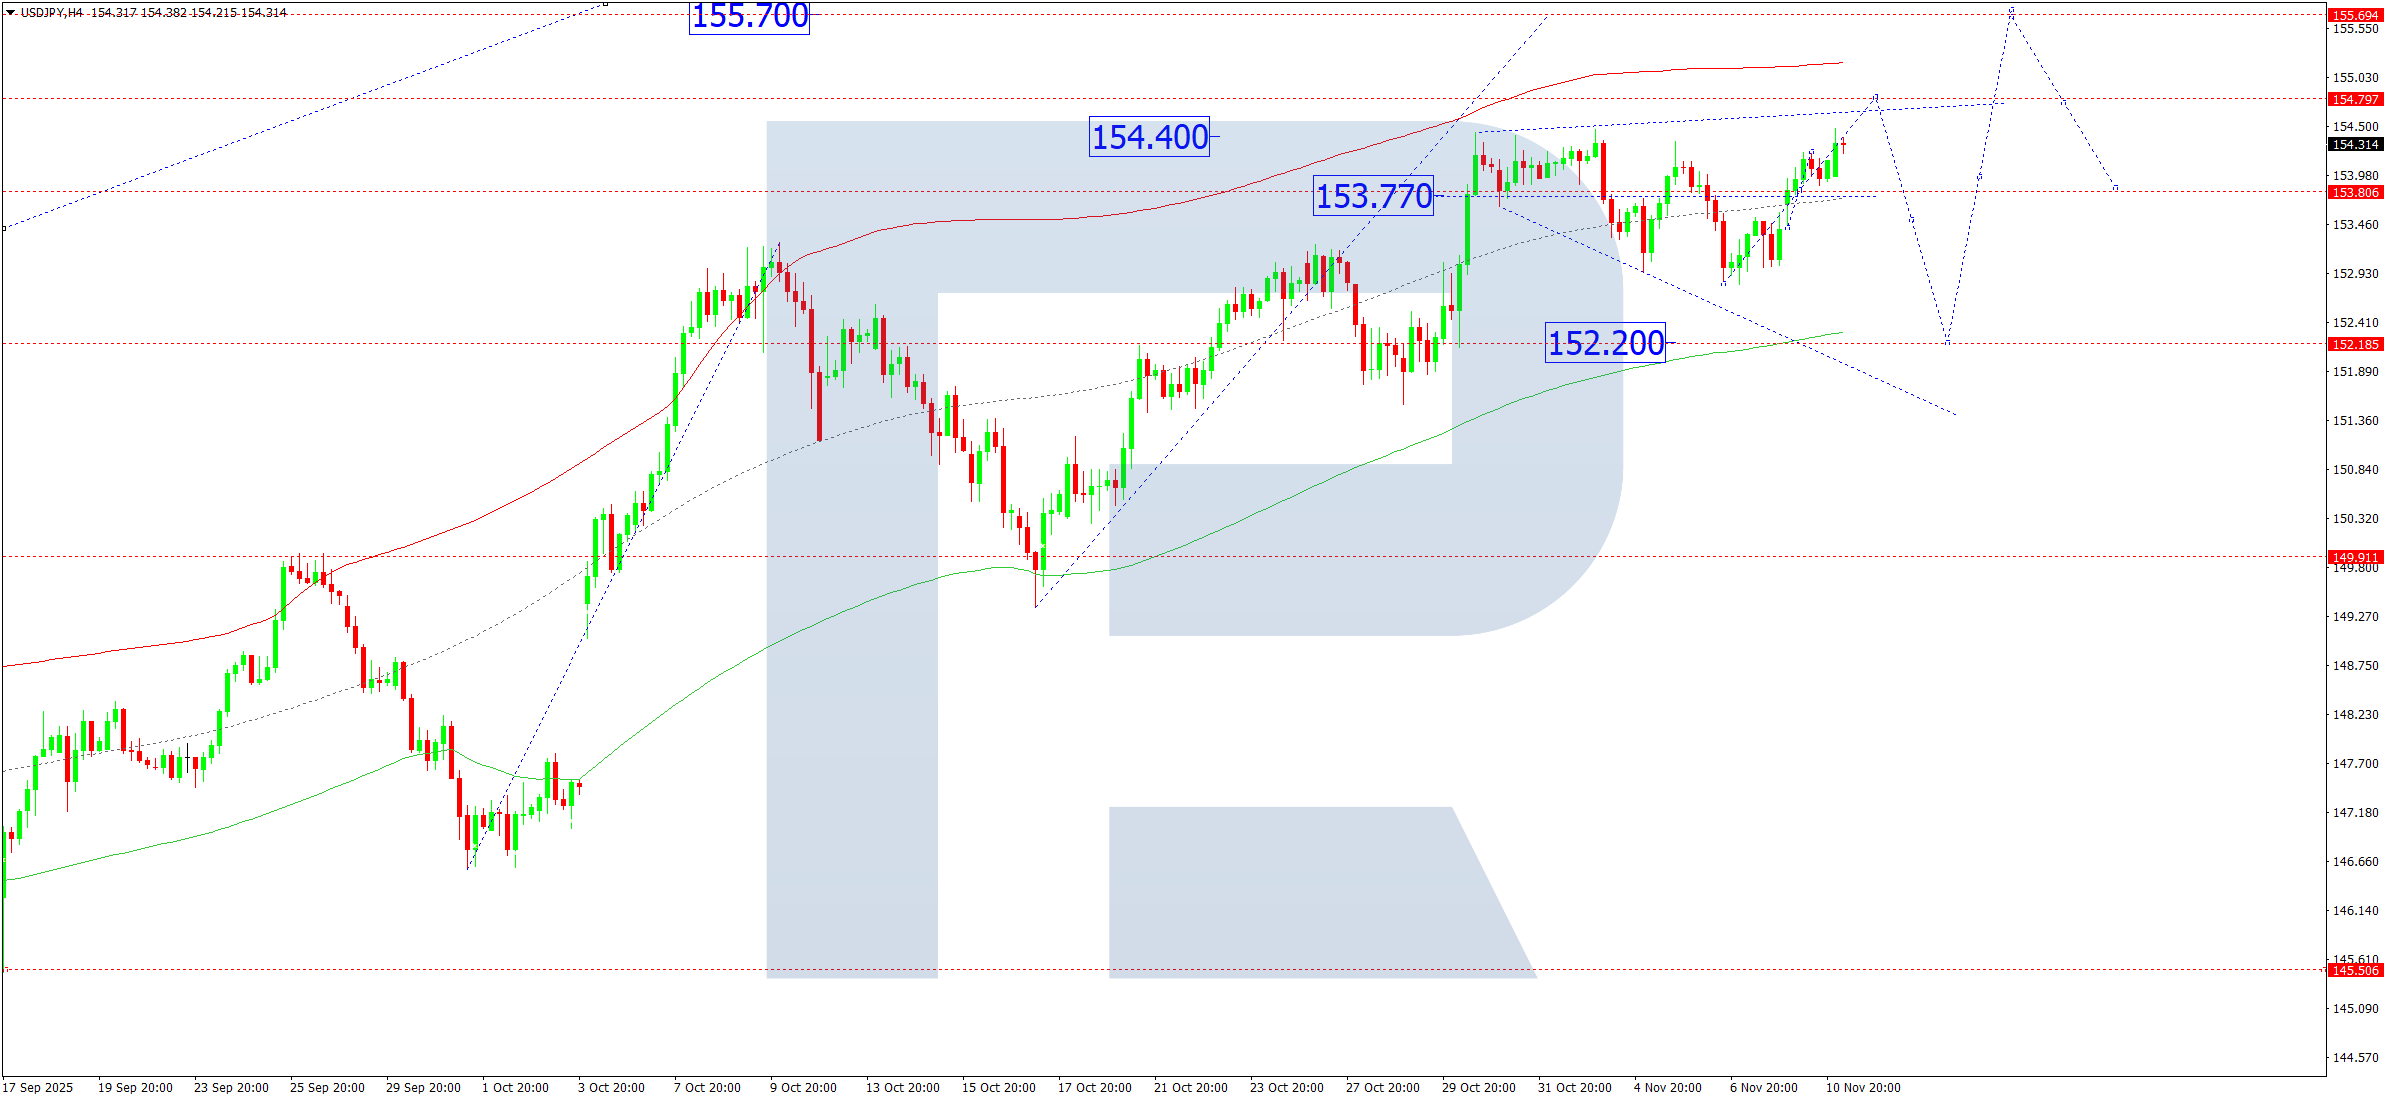
On the H4 chart, USDJPY remains in a consolidation phase around 153.77. On 11 November 2025, the range may expand upward to 154.80, followed by a pullback to 153.77. A breakout above this level could extend the uptrend towards 155.70, and potentially 157.57. Conversely, a downward breakout may initiate a correction towards 152.22, before the uptrend resumes.
The Elliott Wave structure, pivoting from 151.90, confirms the bullish scenario. The market is currently trading around the central line of the Price Envelope at 153.77. A test of the lower boundary at 152.22 is expected before a rebound towards 155.70.
Technical outlook: Temporary correction towards 152.22.
Risk Warning: Past performance does not guarantee future results.
GBPUSD Forecast
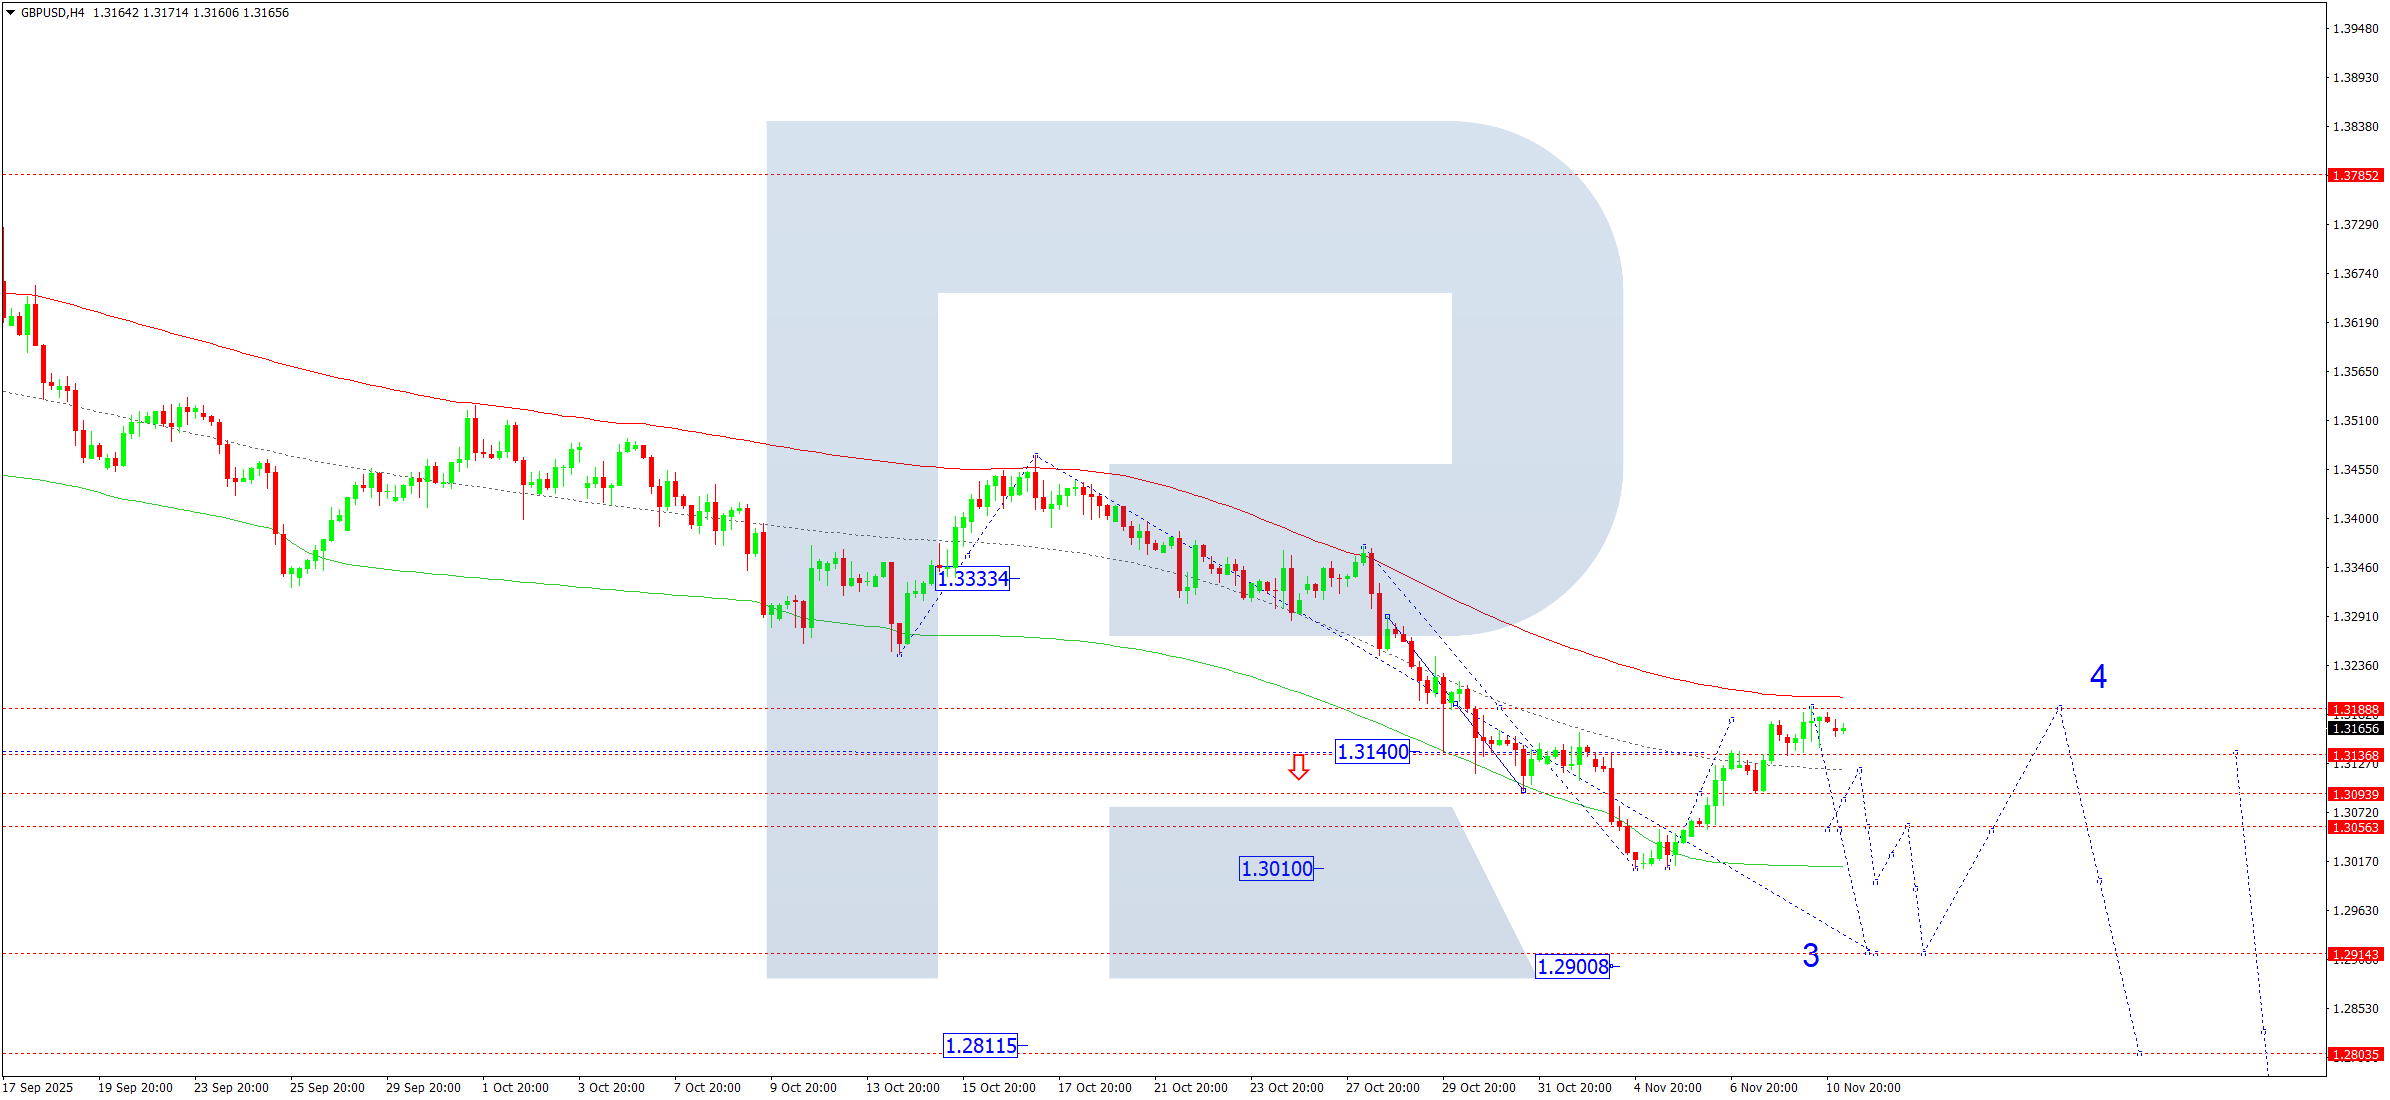
On the H4 chart, GBPUSD has completed its corrective phase at 1.3188. On 11 November 2025, the pair could begin a new downward wave targeting 1.3055. A breakout below this level may accelerate the decline towards 1.2900, marking the development of the third wave in the broader downtrend.
The Elliott Wave structure and downward matrix with a pivot at 1.3188 support this scenario. The correction reached the upper boundary of the Price Envelope, suggesting a potential reversal. Today, the pair could start a decline towards 1.2900.
Technical outlook: Downward move likely towards 1.2900.
Risk Warning: Past performance does not guarantee future results.
AUDUSD Forecast
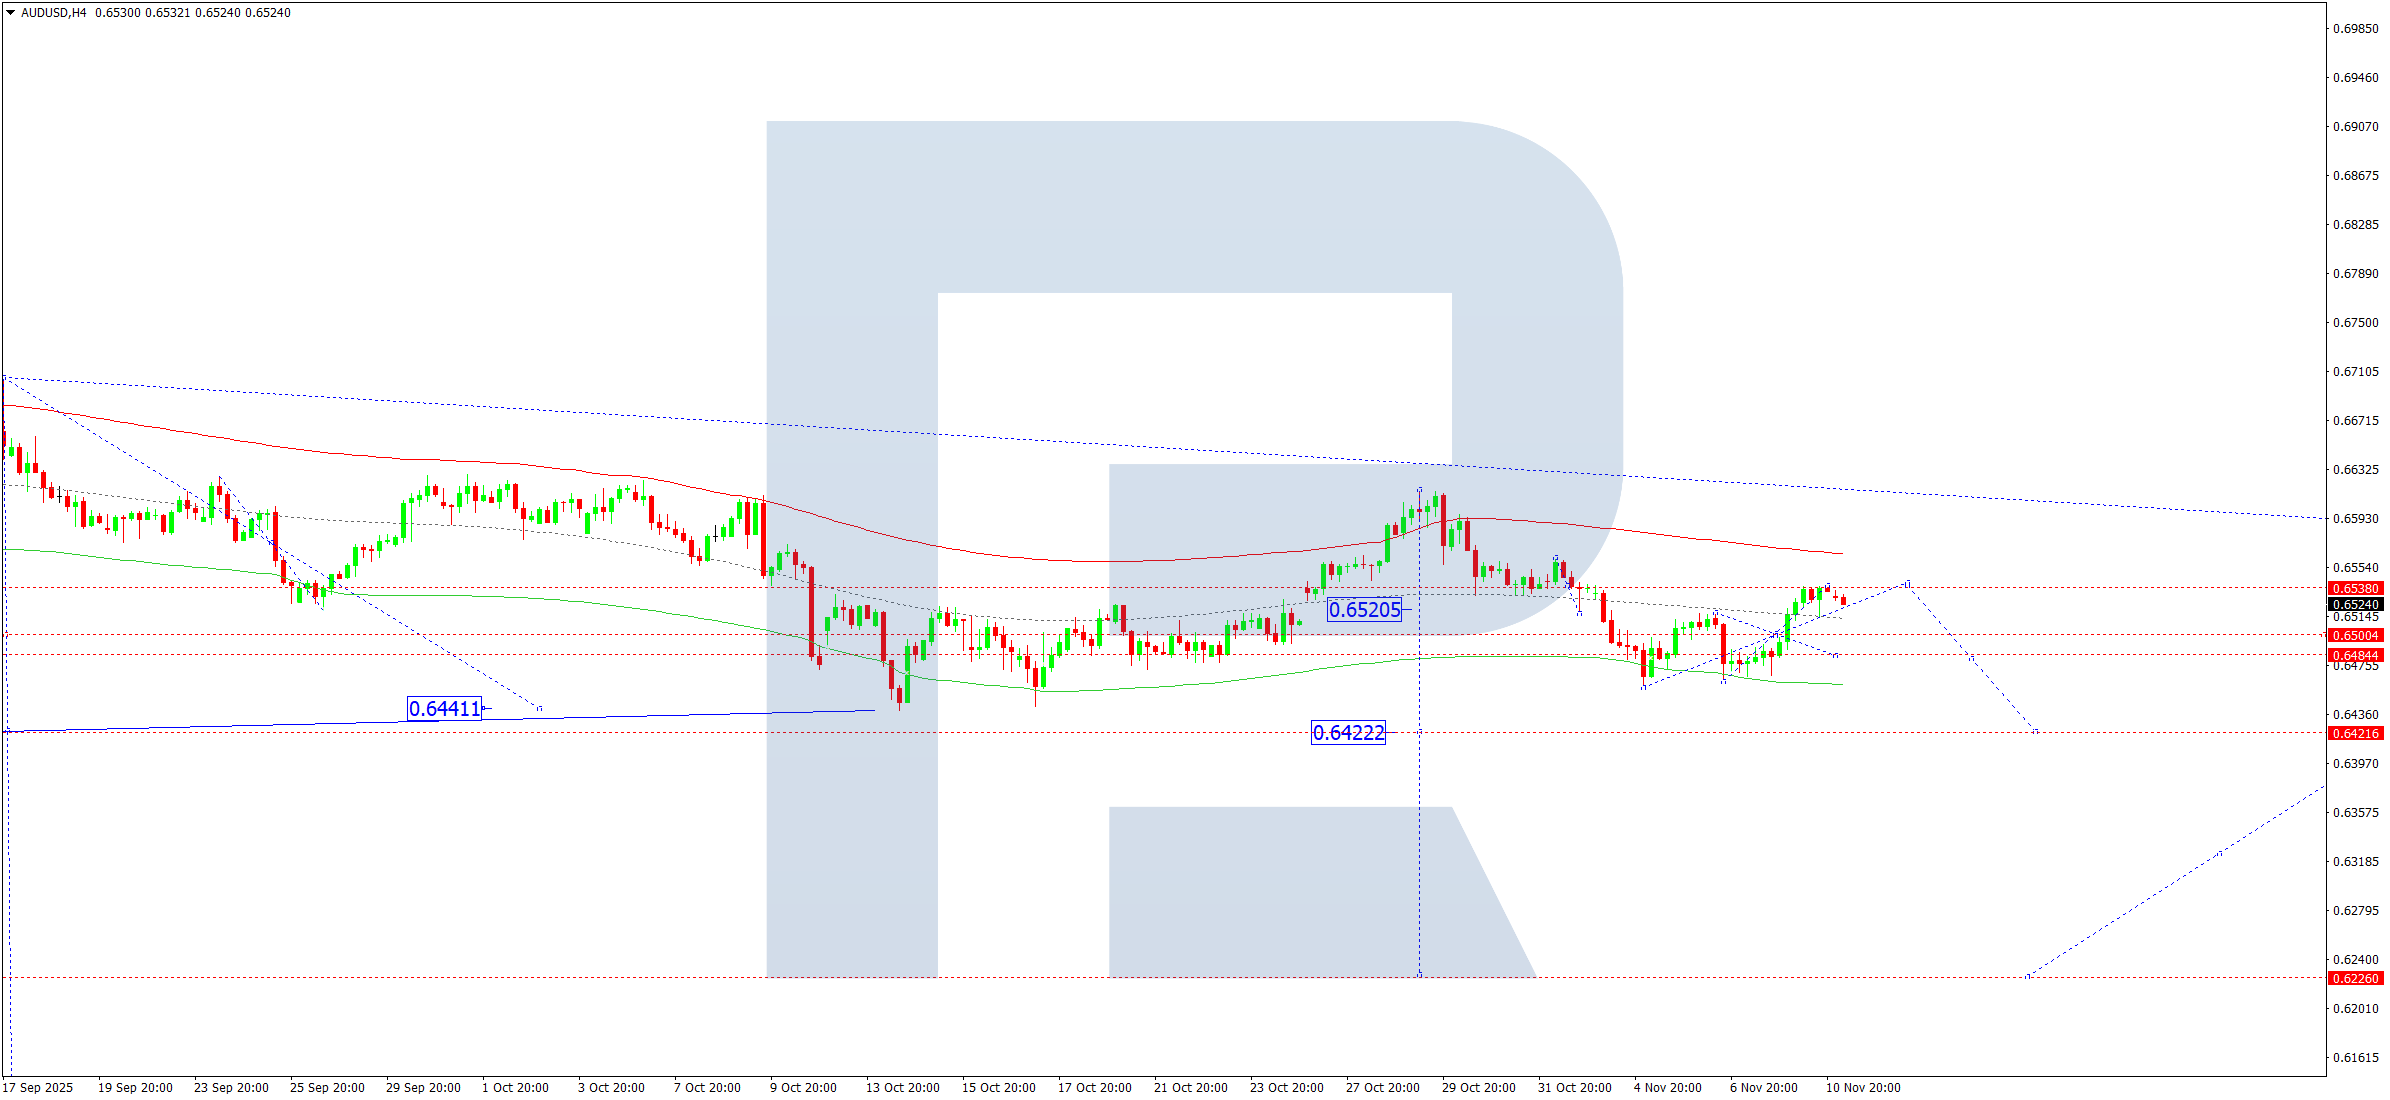
On the H4 chart, AUDUSD completed a corrective move to 0.6538. On 11 November 2025, a new decline is expected towards 0.6480, with potential continuation to 0.6422. This movement represents the first half of the third downward wave targeting 0.6226.
The Elliott Wave analysis with a pivot at 0.6538 confirms the bearish structure. The pair is expected to move from the upper boundary of the Price Envelope towards the lower one near 0.6484, with scope for further decline to 0.6222.
Technical outlook: Bearish wave expected towards 0.6484.
Risk Warning: Past performance does not guarantee future results.
USDCAD Forecast
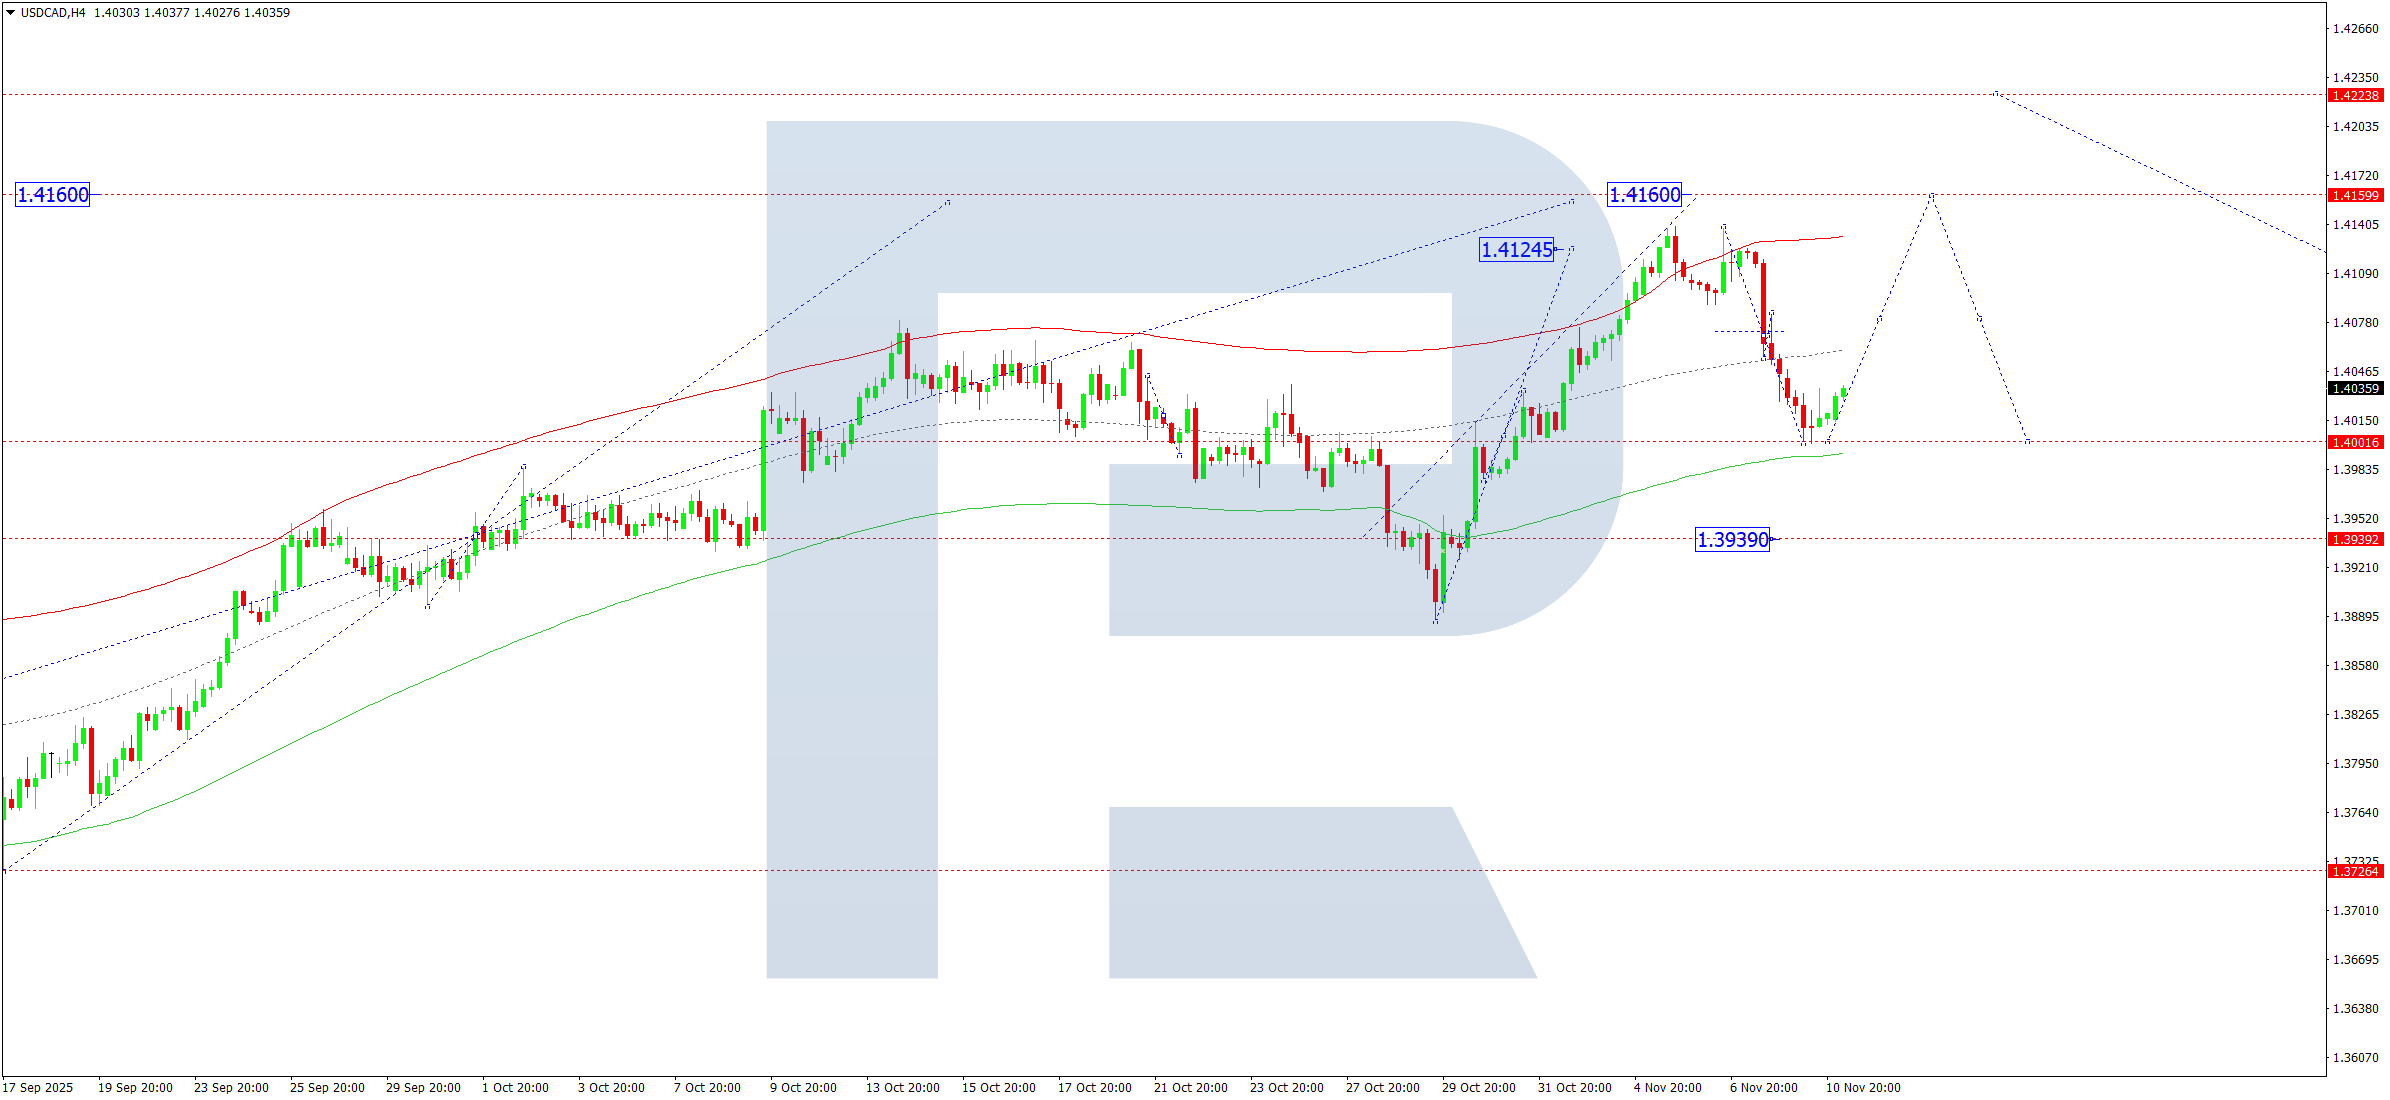
On the H4 chart, USDCAD has completed a correction near 1.4000. On 11 November 2025, the pair may resume its upward movement towards 1.4080, and a breakout above this level could open the path to 1.4160.
The Elliott Wave structure, pivoting from 1.3939, confirms the bullish scenario. The market is advancing towards the upper boundary of the Price Envelope near 1.4160, suggesting potential continuation of the upward impulse.
Technical outlook: Bullish momentum likely to continue towards 1.4160.
Risk Warning: Past performance does not guarantee future results.
XAUUSD (Gold) Forecast
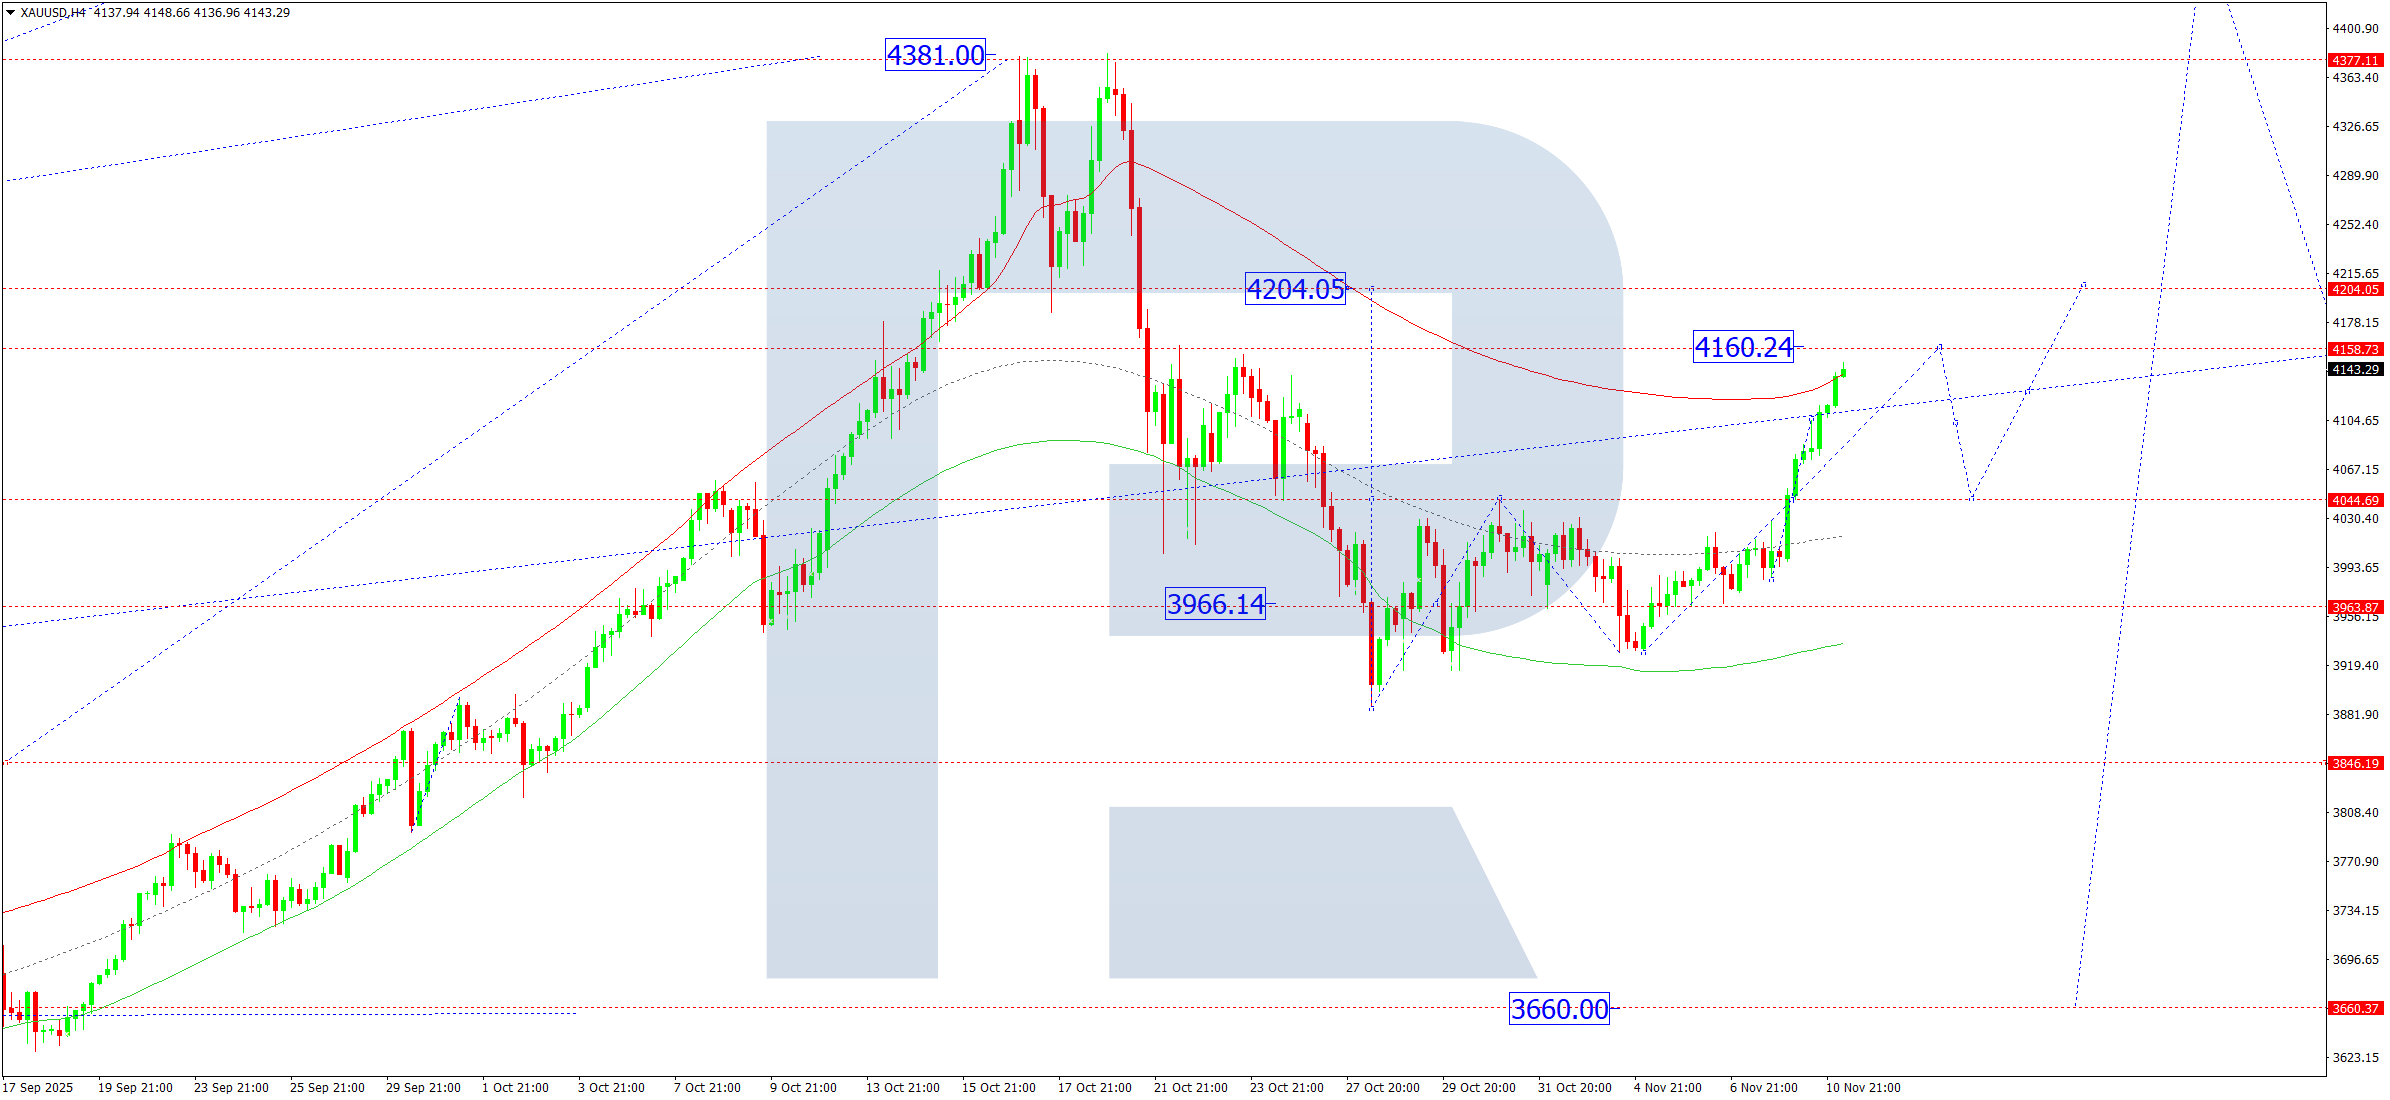
On the H4 chart, XAUUSD (Gold) formed a consolidation range around 3,966 and broke upward. On 11 November 2025, the price could rise towards 4,160, followed by a pullback to 4,044. The broader market structure shows ongoing consolidation around 4,044. A downward breakout could extend the correction to 3,850, while an upward breakout might drive the trend towards 4,204.
The Elliott Wave matrix with a pivot at 3,660 supports this scenario. Currently, Gold is consolidating near the central line of the Price Envelope around 4,044, with potential to test 4,160 before easing back.
Technical outlook: Upside movement expected towards 4,160.
Risk Warning: Past performance does not guarantee future results.
Brent Crude Forecast
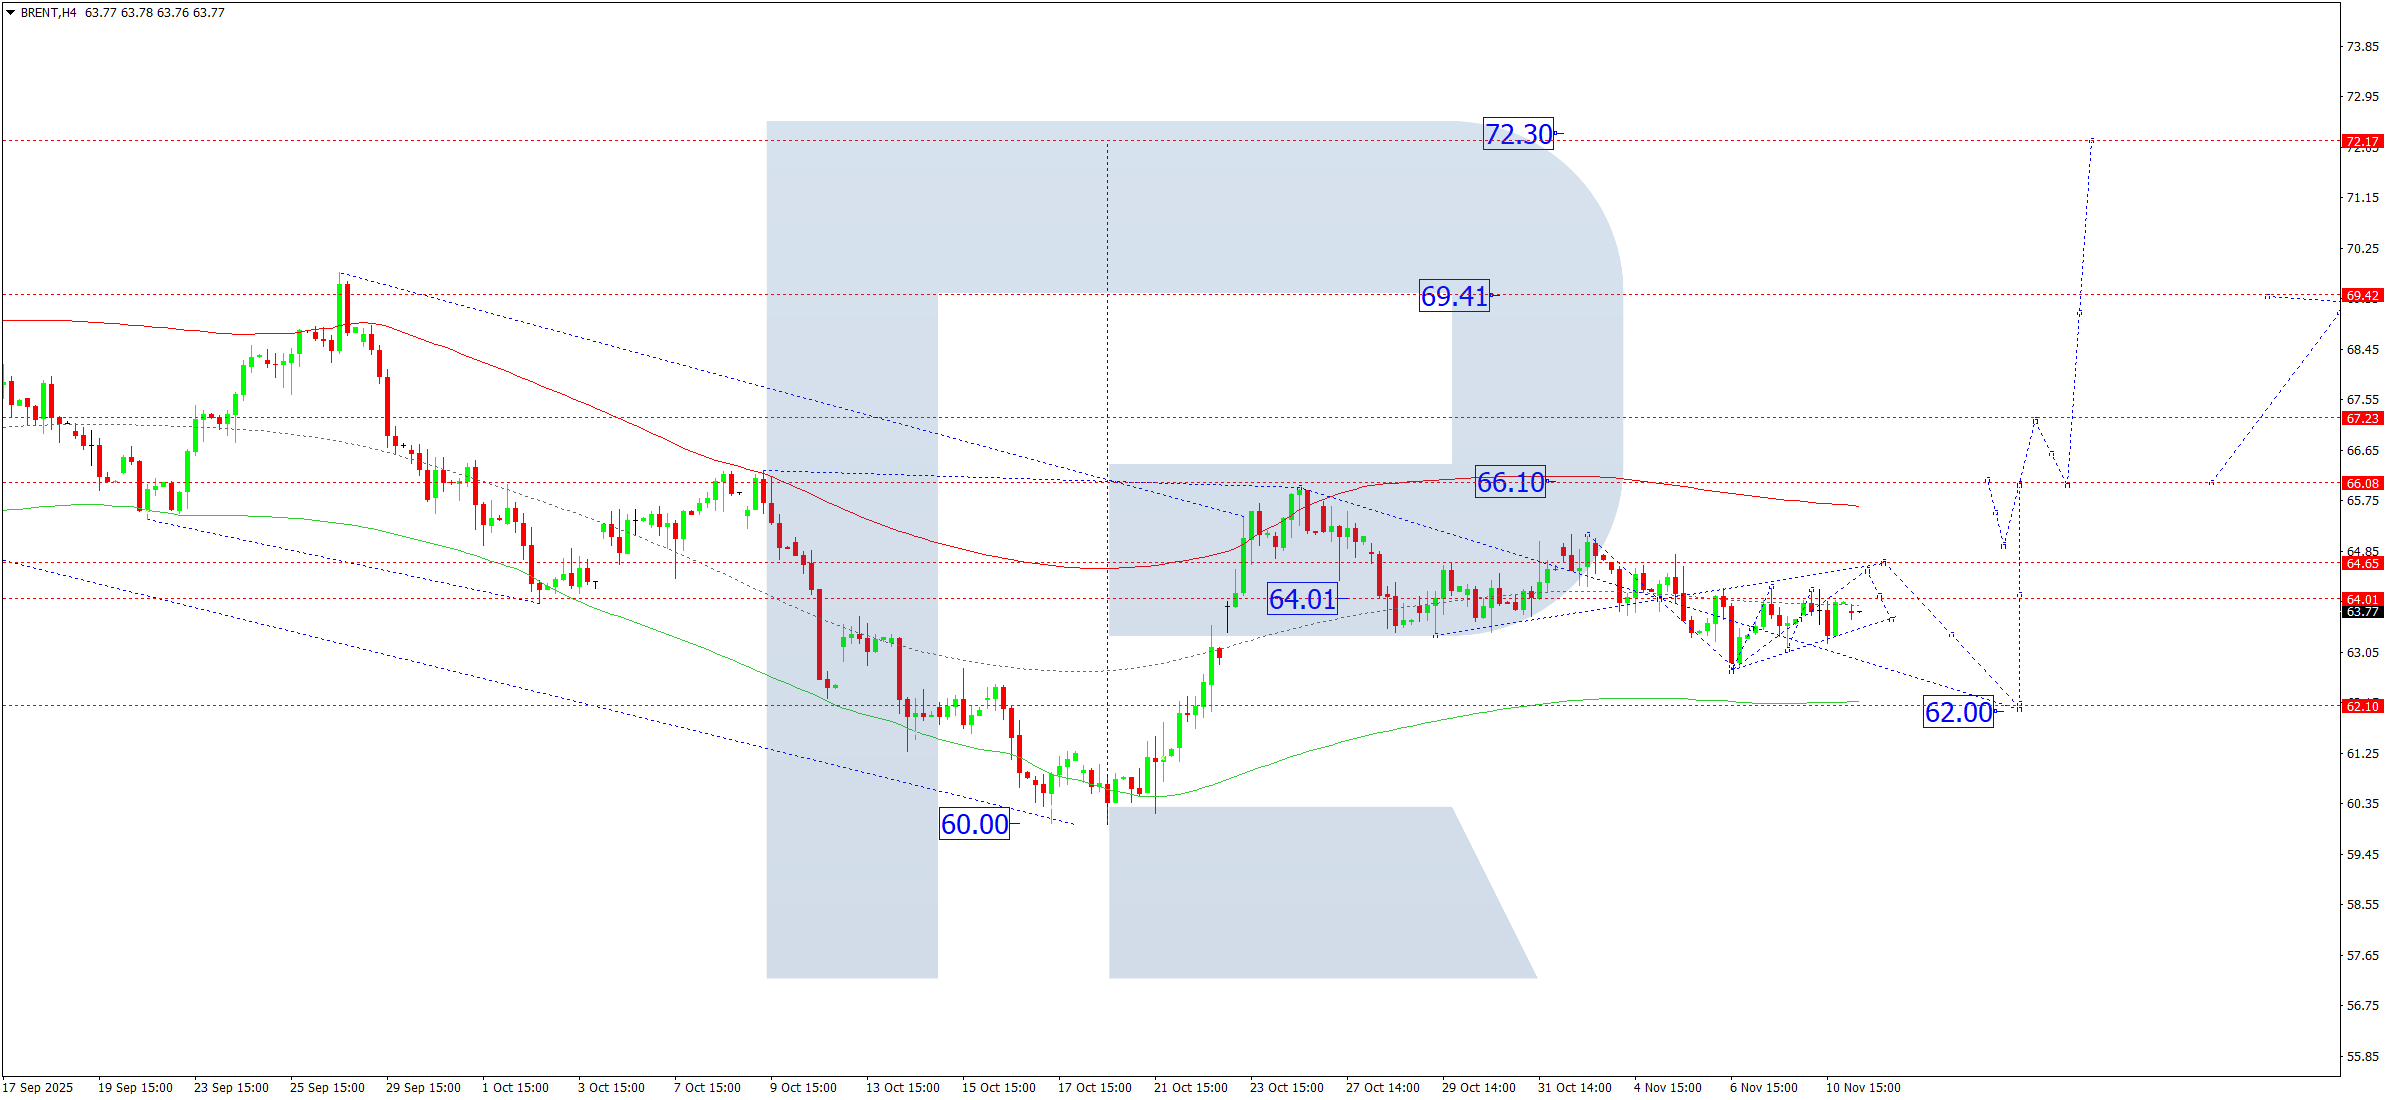
On the H4 chart, Brent continues consolidating around 64.00. On 11 November 2025, an upward move towards 64.64 is anticipated, followed by a decline to 62.00, completing the correction phase. Afterwards, a recovery towards 66.10 is expected. A breakout above 66.10 would strengthen the bullish momentum, potentially extending the move towards 69.40.
The Elliott Wave structure, pivoting from 66.10, supports this outlook. Currently, Brent is forming a correction towards the lower boundary of the Price Envelope near 62.00, from where an upward impulse towards 66.10 may begin.
Technical outlook: Correction may end near 62.00, followed by a rise towards 66.10.
Risk Warning: Past performance does not guarantee future results.
Leave a Reply