
Daily Technical Analysis and Forecast — 12 November 2025
EURUSD Forecast
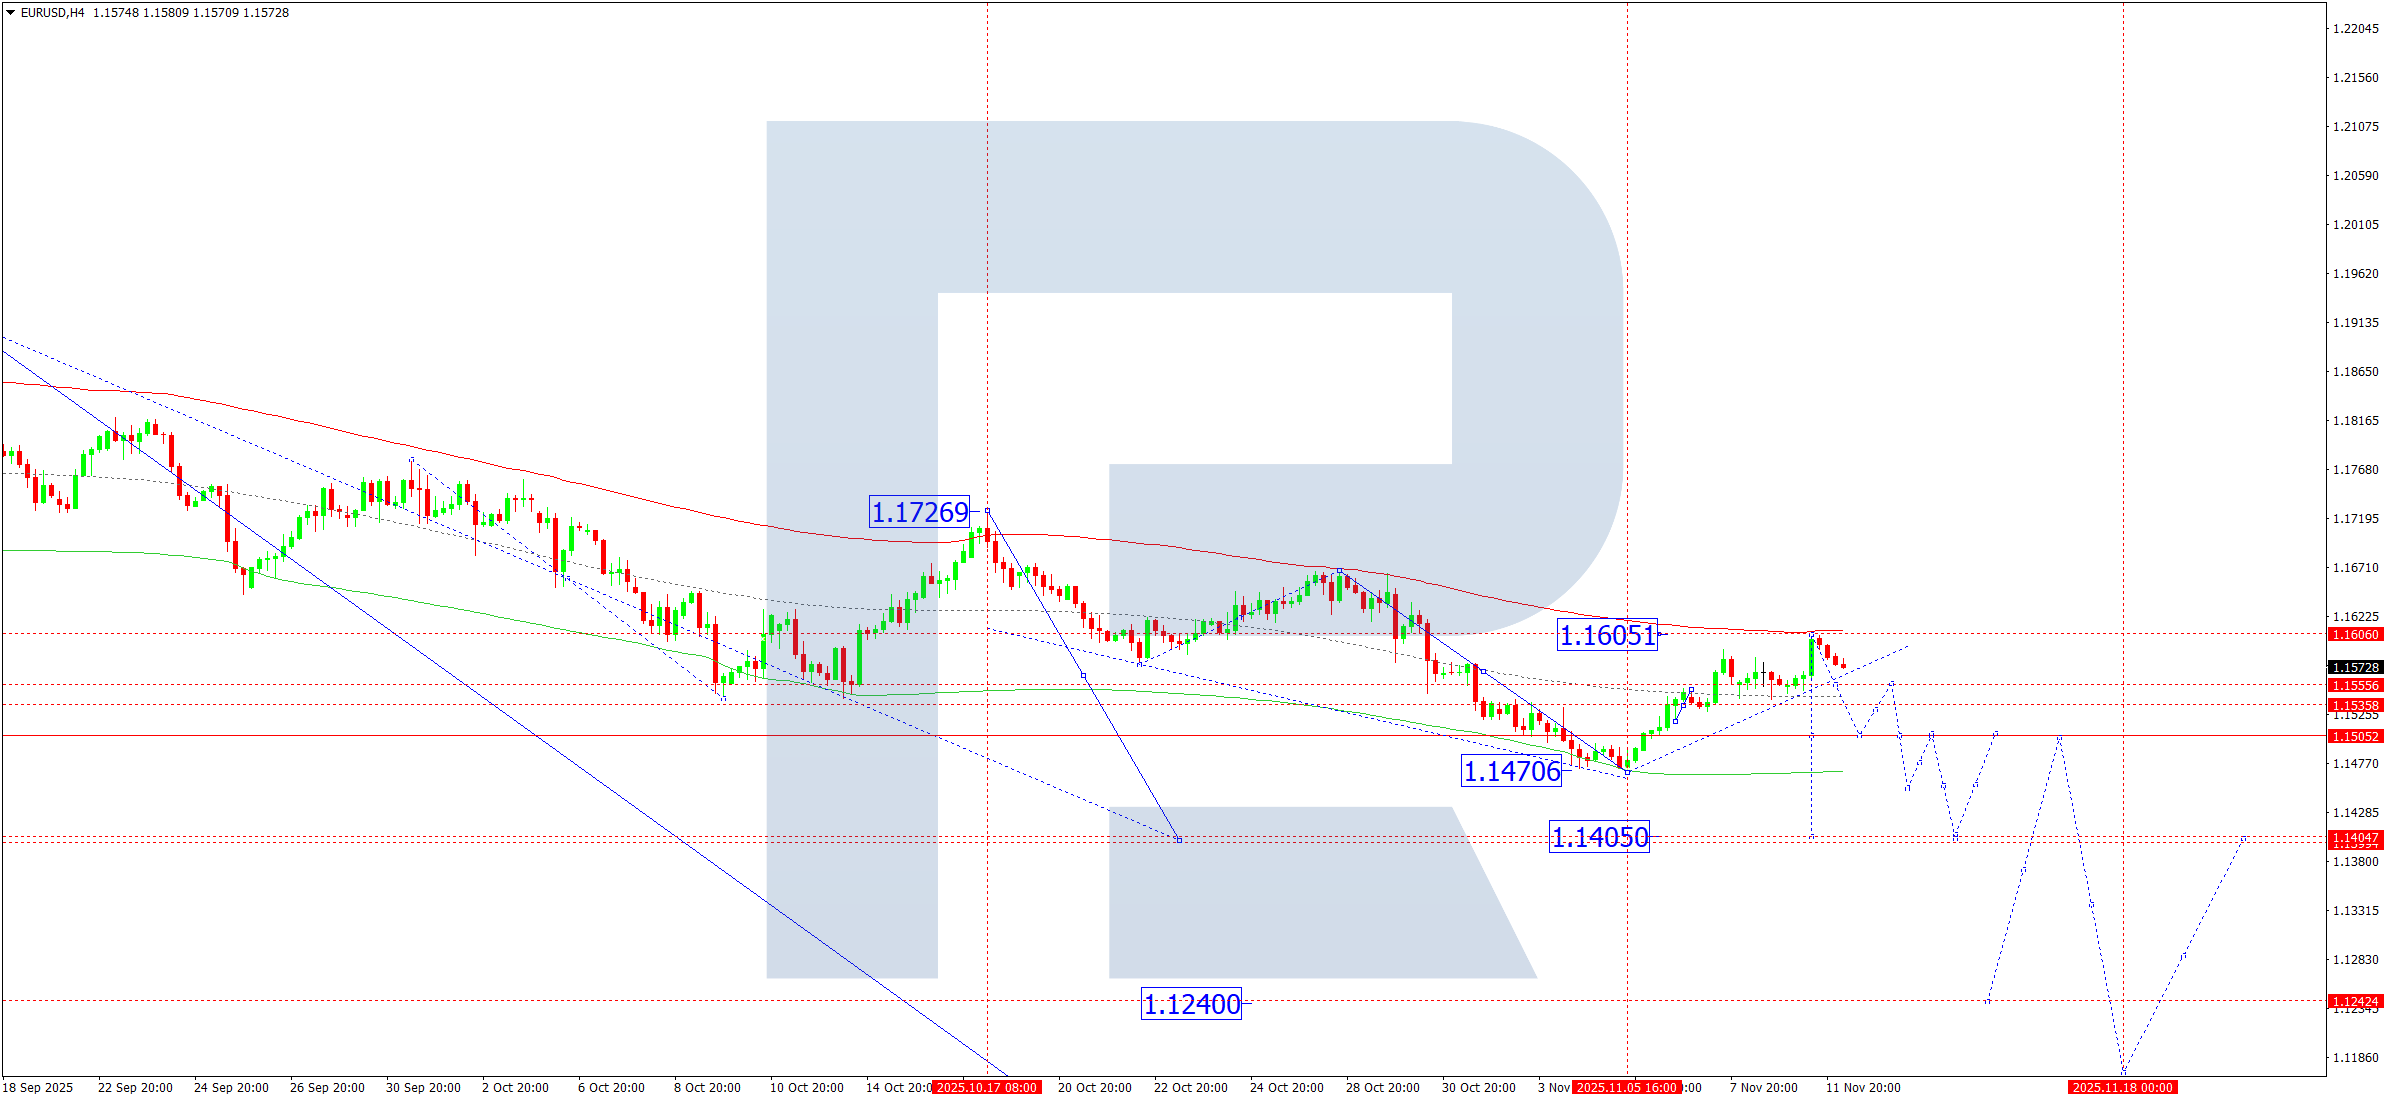
On the H4 chart of EURUSD, the market formed a consolidation range around 1.1535 and, after an upward breakout, completed a correction toward 1.1605. On 12 November 2025, the pair is developing a downward wave targeting 1.1505. A short-term rebound to 1.1555 may occur, followed by a continuation of the decline toward 1.1455, with a possible extension to the local target of 1.1405.
The Elliott Wave structure, anchored at the pivot point of 1.1650, confirms this as the dominant downward phase. Having completed a correction at the upper boundary of the Price Envelope near 1.1605, the market is expected to move toward the lower boundary around 1.1450, with potential continuation to 1.1405.
Technical indicators for today point to a decline toward 1.1450.
USDJPY Forecast
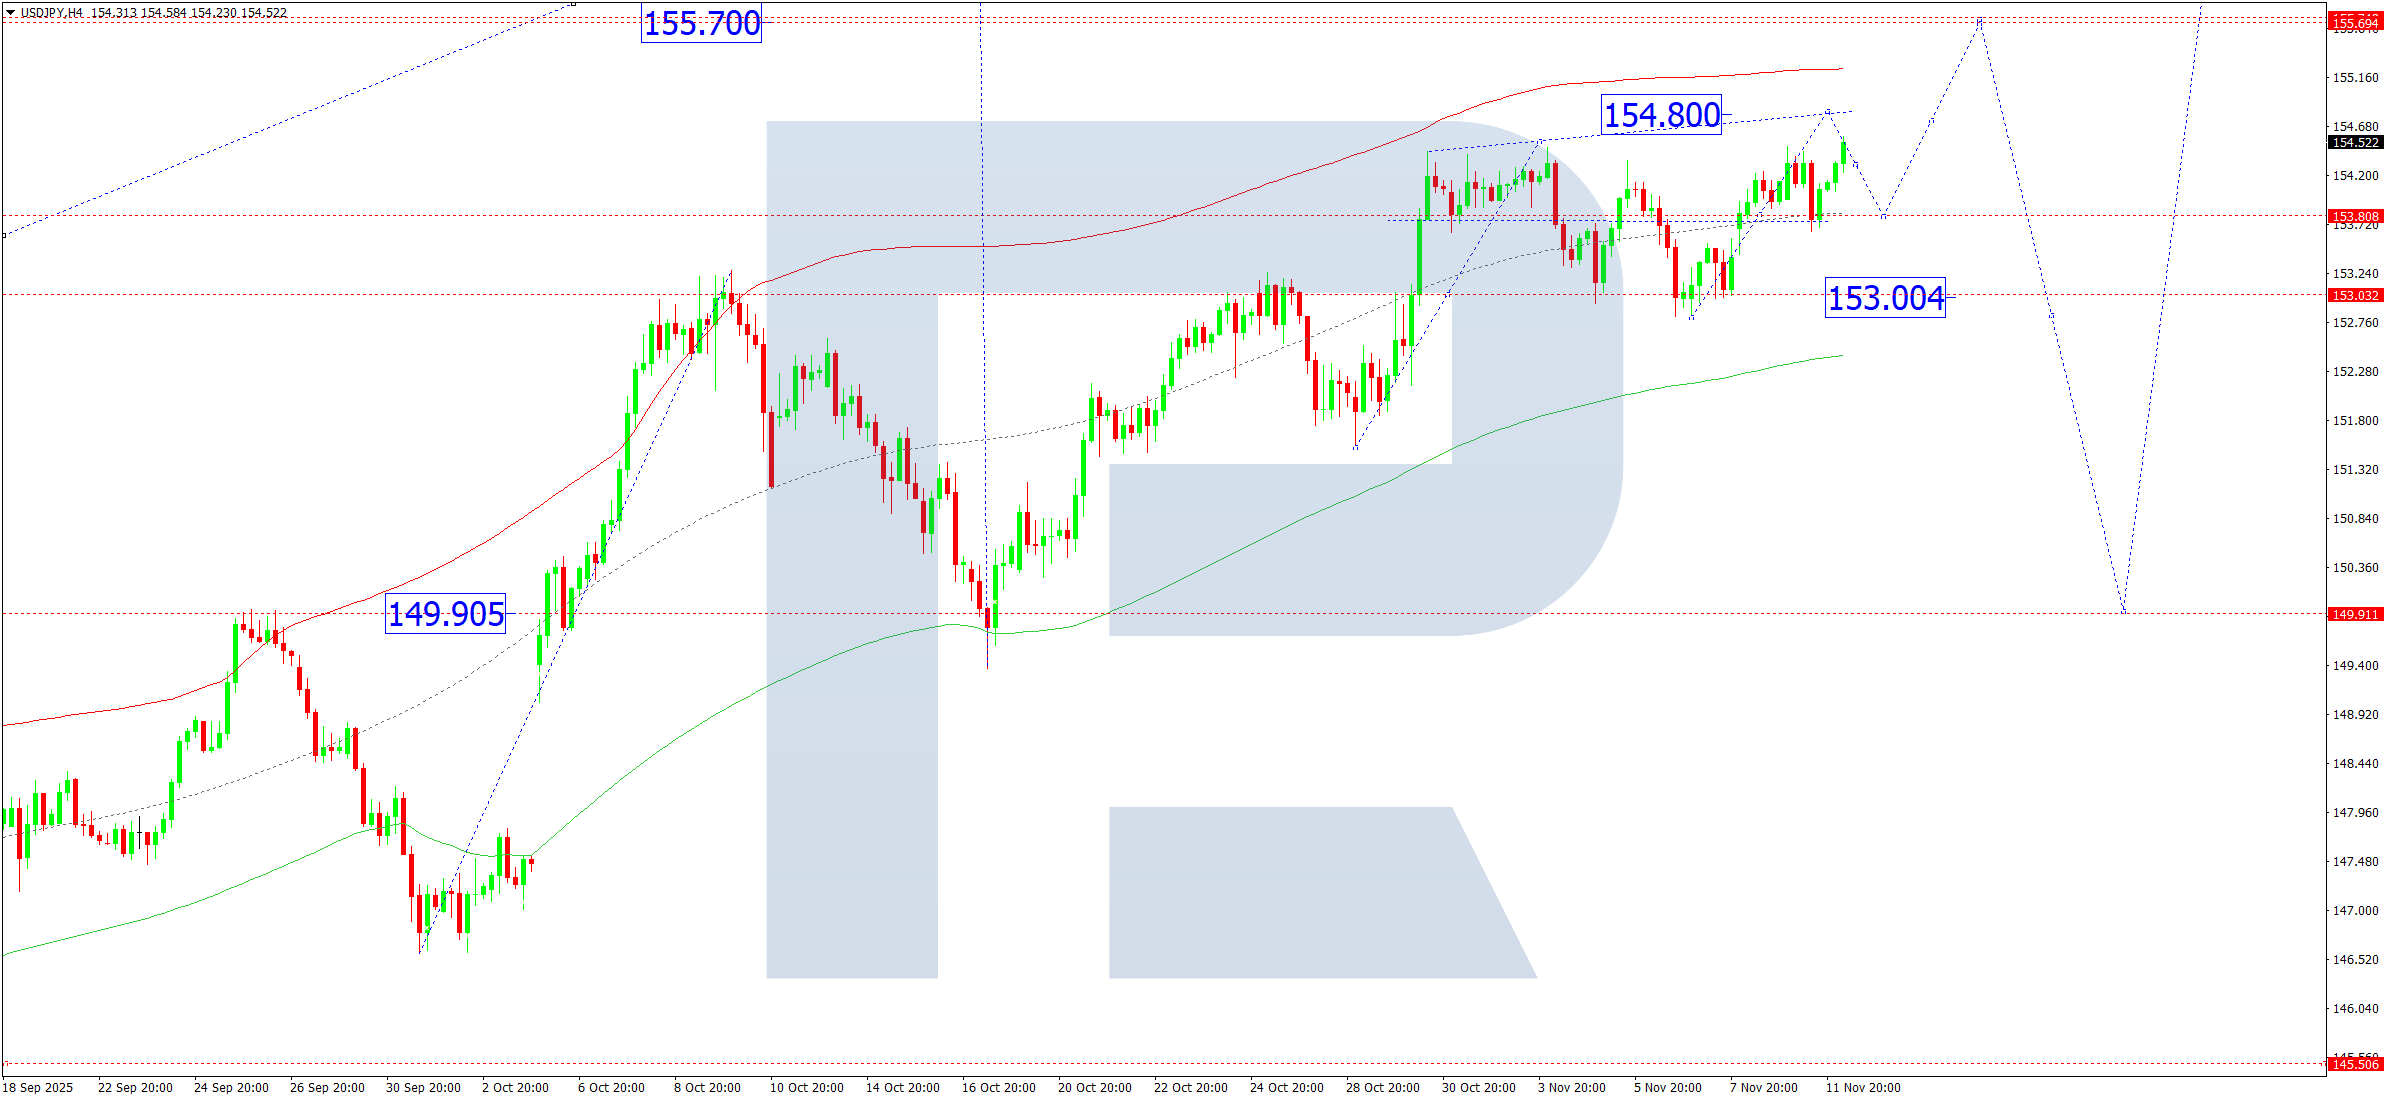
On the H4 chart of USDJPY, the pair continues to consolidate around 153.80. On 12 November 2025, the range may expand upward toward 154.80 before retreating back to 153.80. A breakout above this zone could open the way for an advance to 155.70, with potential extension to 157.57. Conversely, a downward breakout might trigger a correction toward 152.22, followed by a renewed rise toward 155.70.
The Elliott Wave structure, with a pivot at 152.20, supports this scenario. The pair currently trades near the midline of the Price Envelope around 153.88, with expectations of a move toward the upper boundary at 155.15, followed by a brief correction to 153.00, and another upward leg toward 155.70.
Technical indicators suggest a potential rise toward 155.15.
GBPUSD Forecast
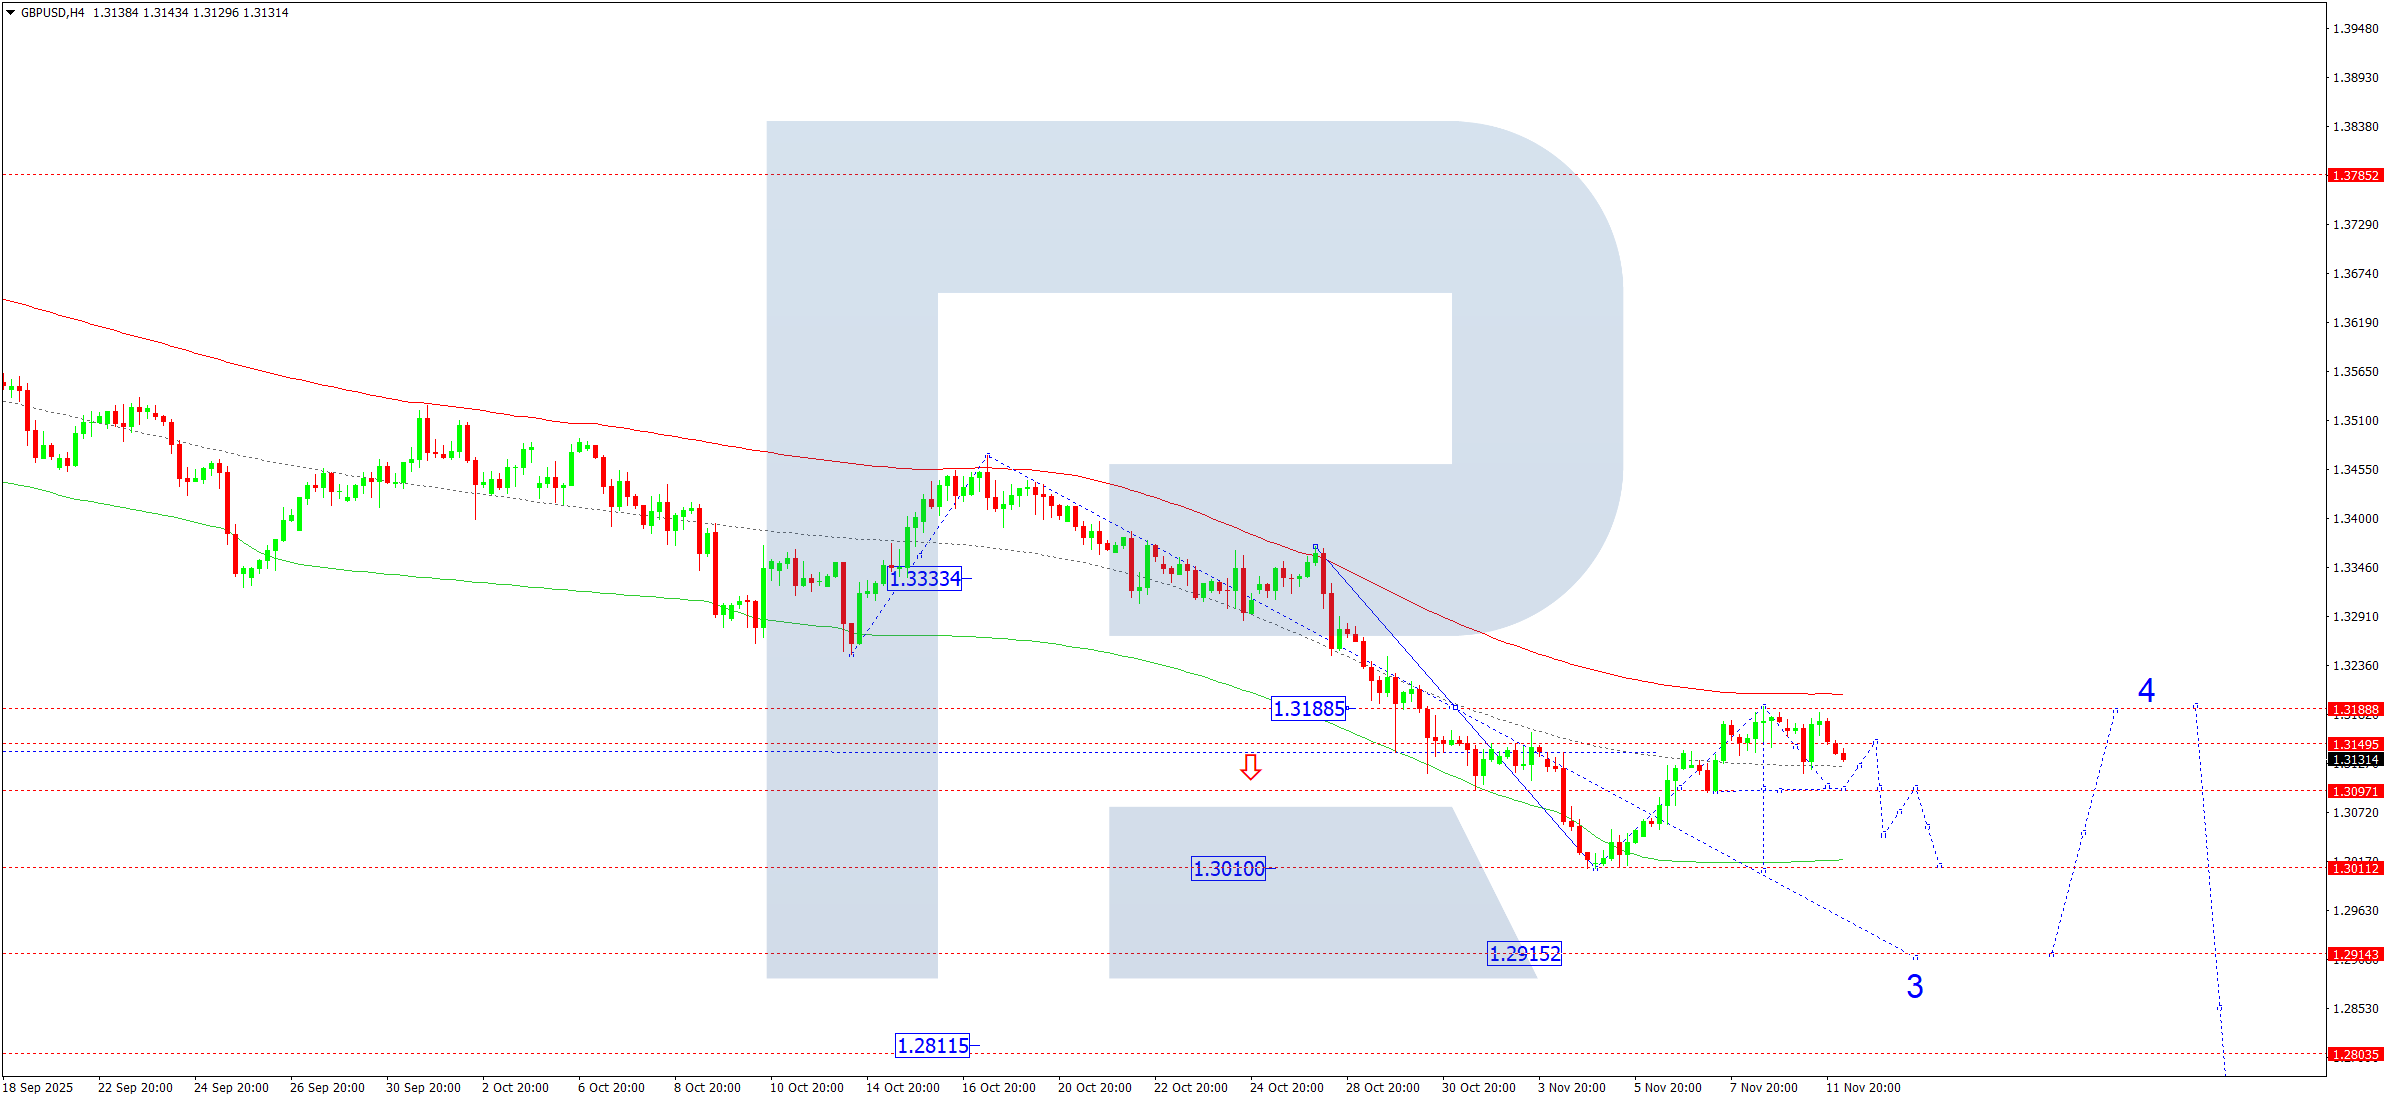
On the H4 chart of GBPUSD, the market completed a correction to 1.3188. On 12 November 2025, the pair is expected to extend its downward movement toward 1.3095. A break below this level may lead to a further decline toward 1.3010, with an extended target near 1.2915—representing the third wave within the broader downtrend.
The Elliott Wave structure, pivoting at 1.3188, confirms this bearish outlook. The correction to the upper boundary of the Price Envelope at 1.3188 (tested from below) appears complete, paving the way for a move toward the lower boundary near 1.2915.
Technical indicators signal continued downside pressure toward 1.2915.
AUDUSD Forecast
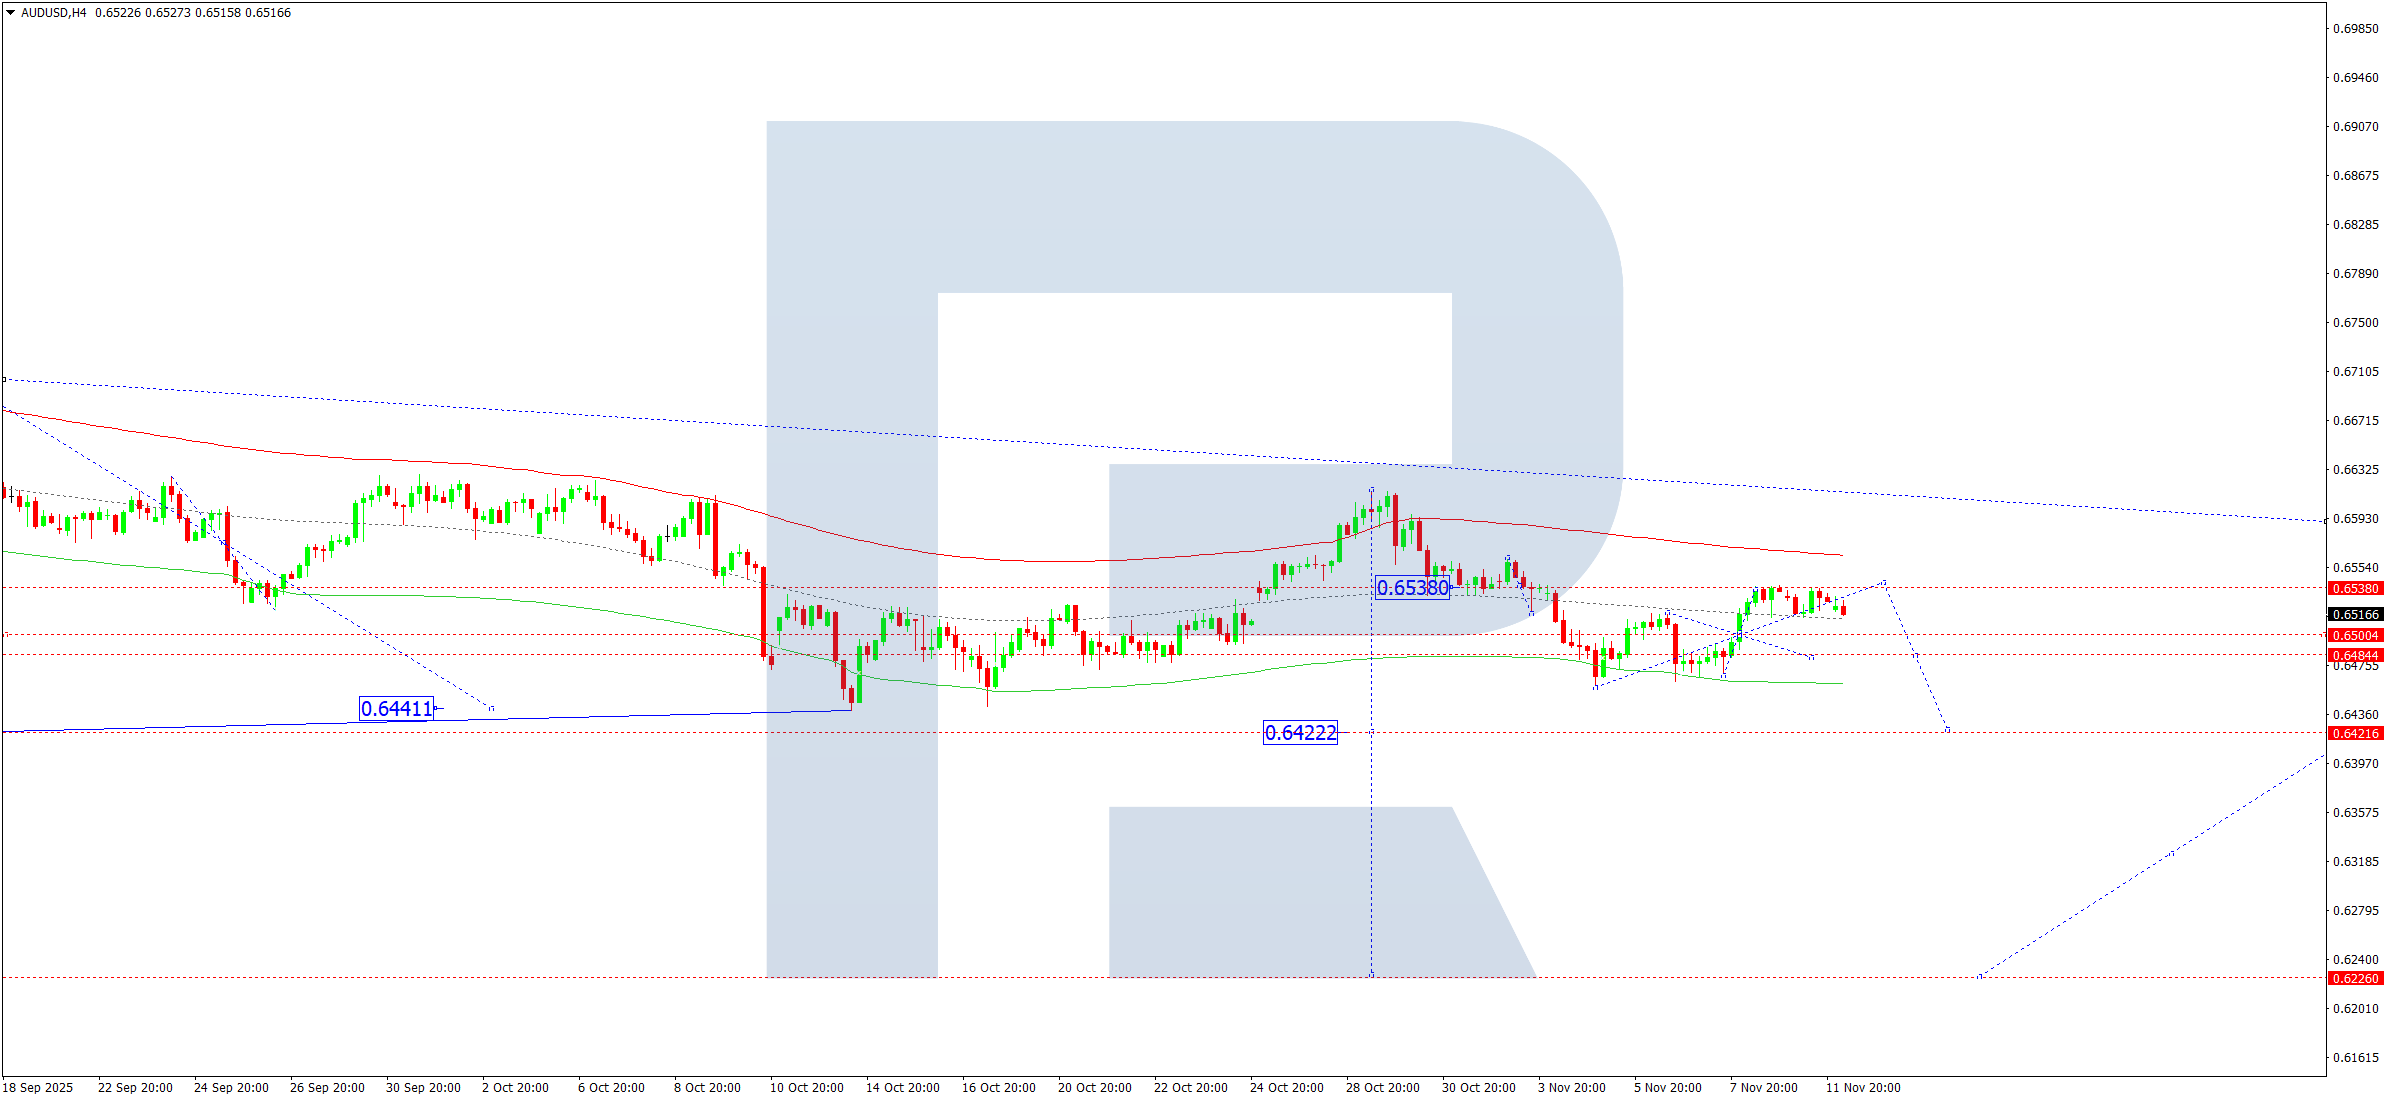
On the H4 chart of AUDUSD, the market has completed a correction near 0.6538. On 12 November 2025, a downward move is anticipated toward 0.6484, with a possible continuation to 0.6422—representing the initial segment of the third downward wave targeting 0.6226.
The Elliott Wave structure, pivoting at 0.6538, supports this bearish outlook. After completing a correction to the upper boundary of the Price Envelope, the market is expected to head toward the lower boundary at 0.6484, potentially extending the decline toward 0.6222.
Technical indicators indicate a downside move toward 0.6484.
USDCAD Forecast
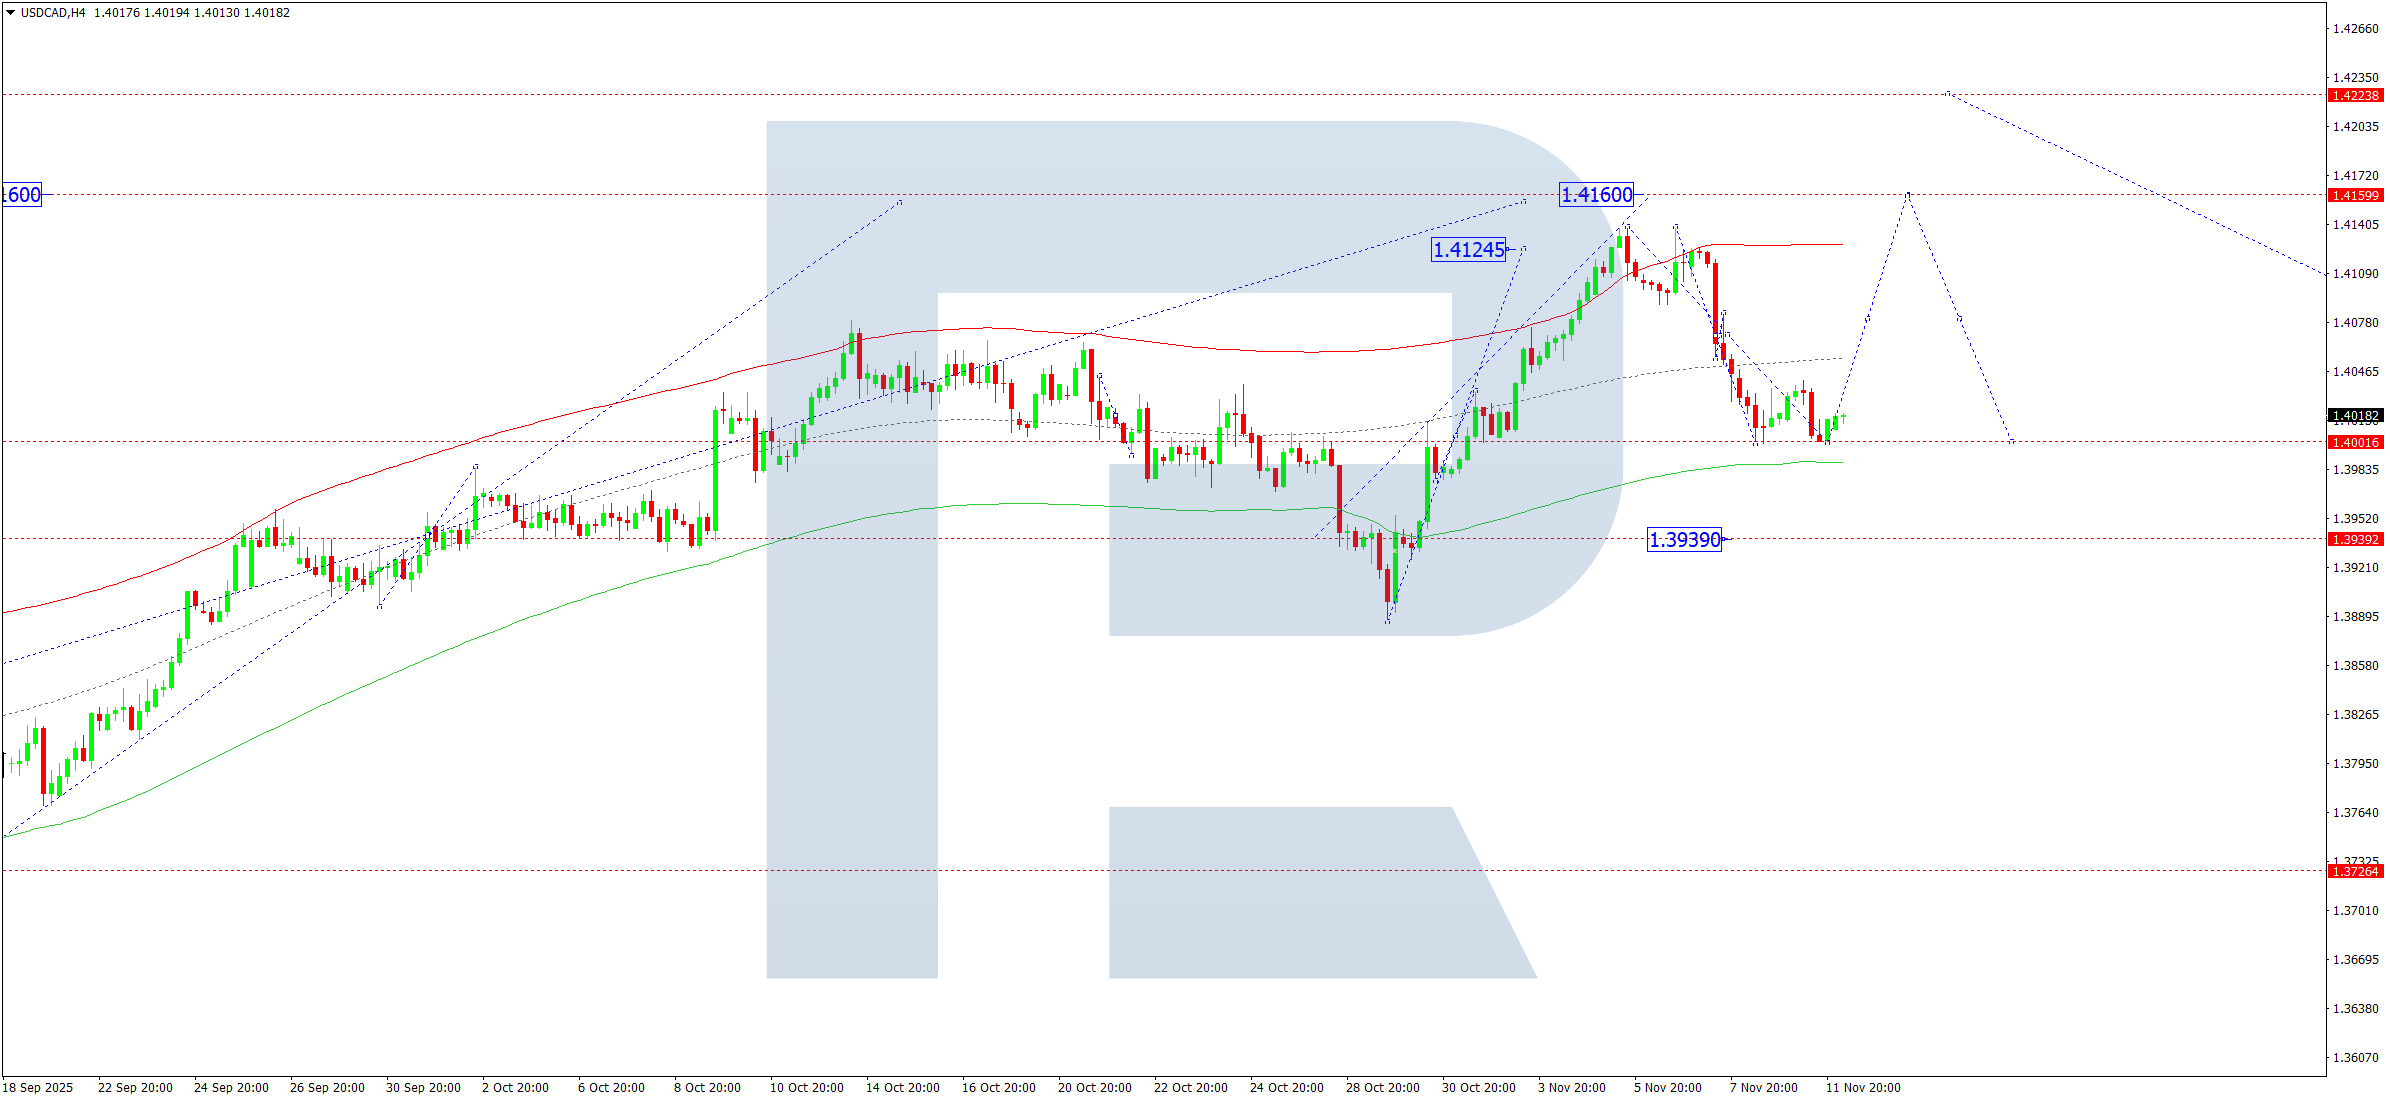
On the H4 chart of USDCAD, the pair has completed a correction around 1.4000 and is consolidating above this level. On 12 November 2025, an upward breakout could initiate a new bullish wave toward 1.4080, with a further advance to 1.4160 upon a confirmed breakout. A downward breakout, however, may extend the correction toward 1.3939, before resuming growth toward 1.4080.
The Elliott Wave structure, pivoting at 1.3939, reinforces the bullish scenario. The correction to the lower boundary of the Price Envelope near 1.4000 appears complete, suggesting the start of a rising wave toward the upper boundary at 1.4160.
Technical indicators point to a continuation of the uptrend toward 1.4080.
XAUUSD (Gold) Forecast
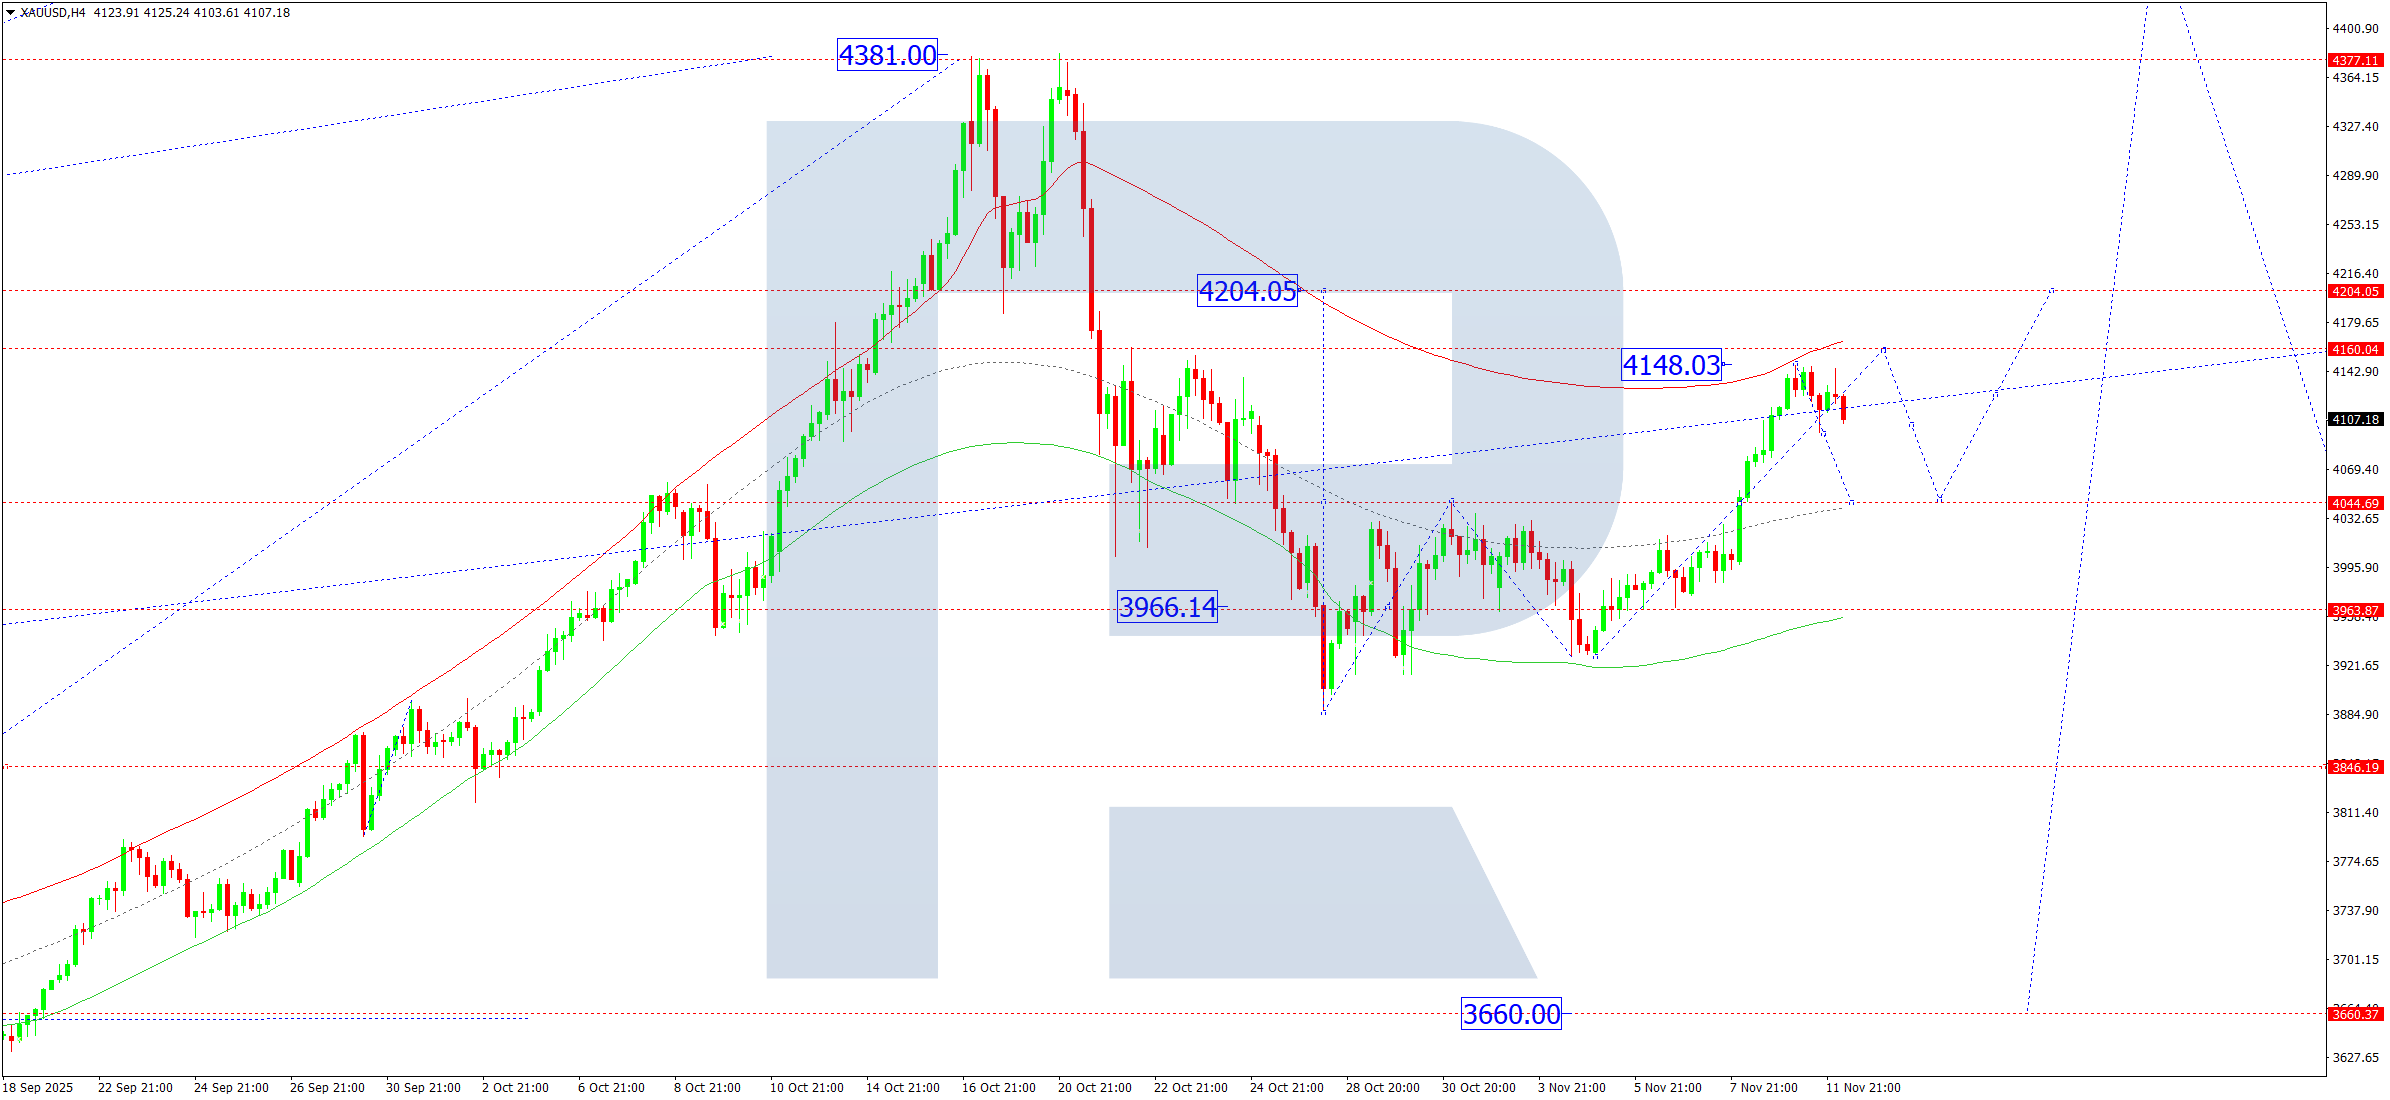
On the H4 chart of XAUUSD, the market has completed an upward wave reaching 4,148. On 12 November 2025, a decline toward 4,044 (testing from above) is possible as part of an ongoing broad consolidation phase. A break below 4,044 may extend the correction toward 3,850, while a breakout above the range could push prices higher toward 4,204.
The Elliott Wave framework, pivoting at 4,044, confirms this consolidation structure. Currently, the market is oscillating around the central line of the Price Envelope at 4,044, with a possible rise toward the upper boundary at 4,160, followed by a pullback to 4,044.
Technical indicators suggest a potential advance toward 4,160 and 4,204.
Brent Crude Oil Forecast
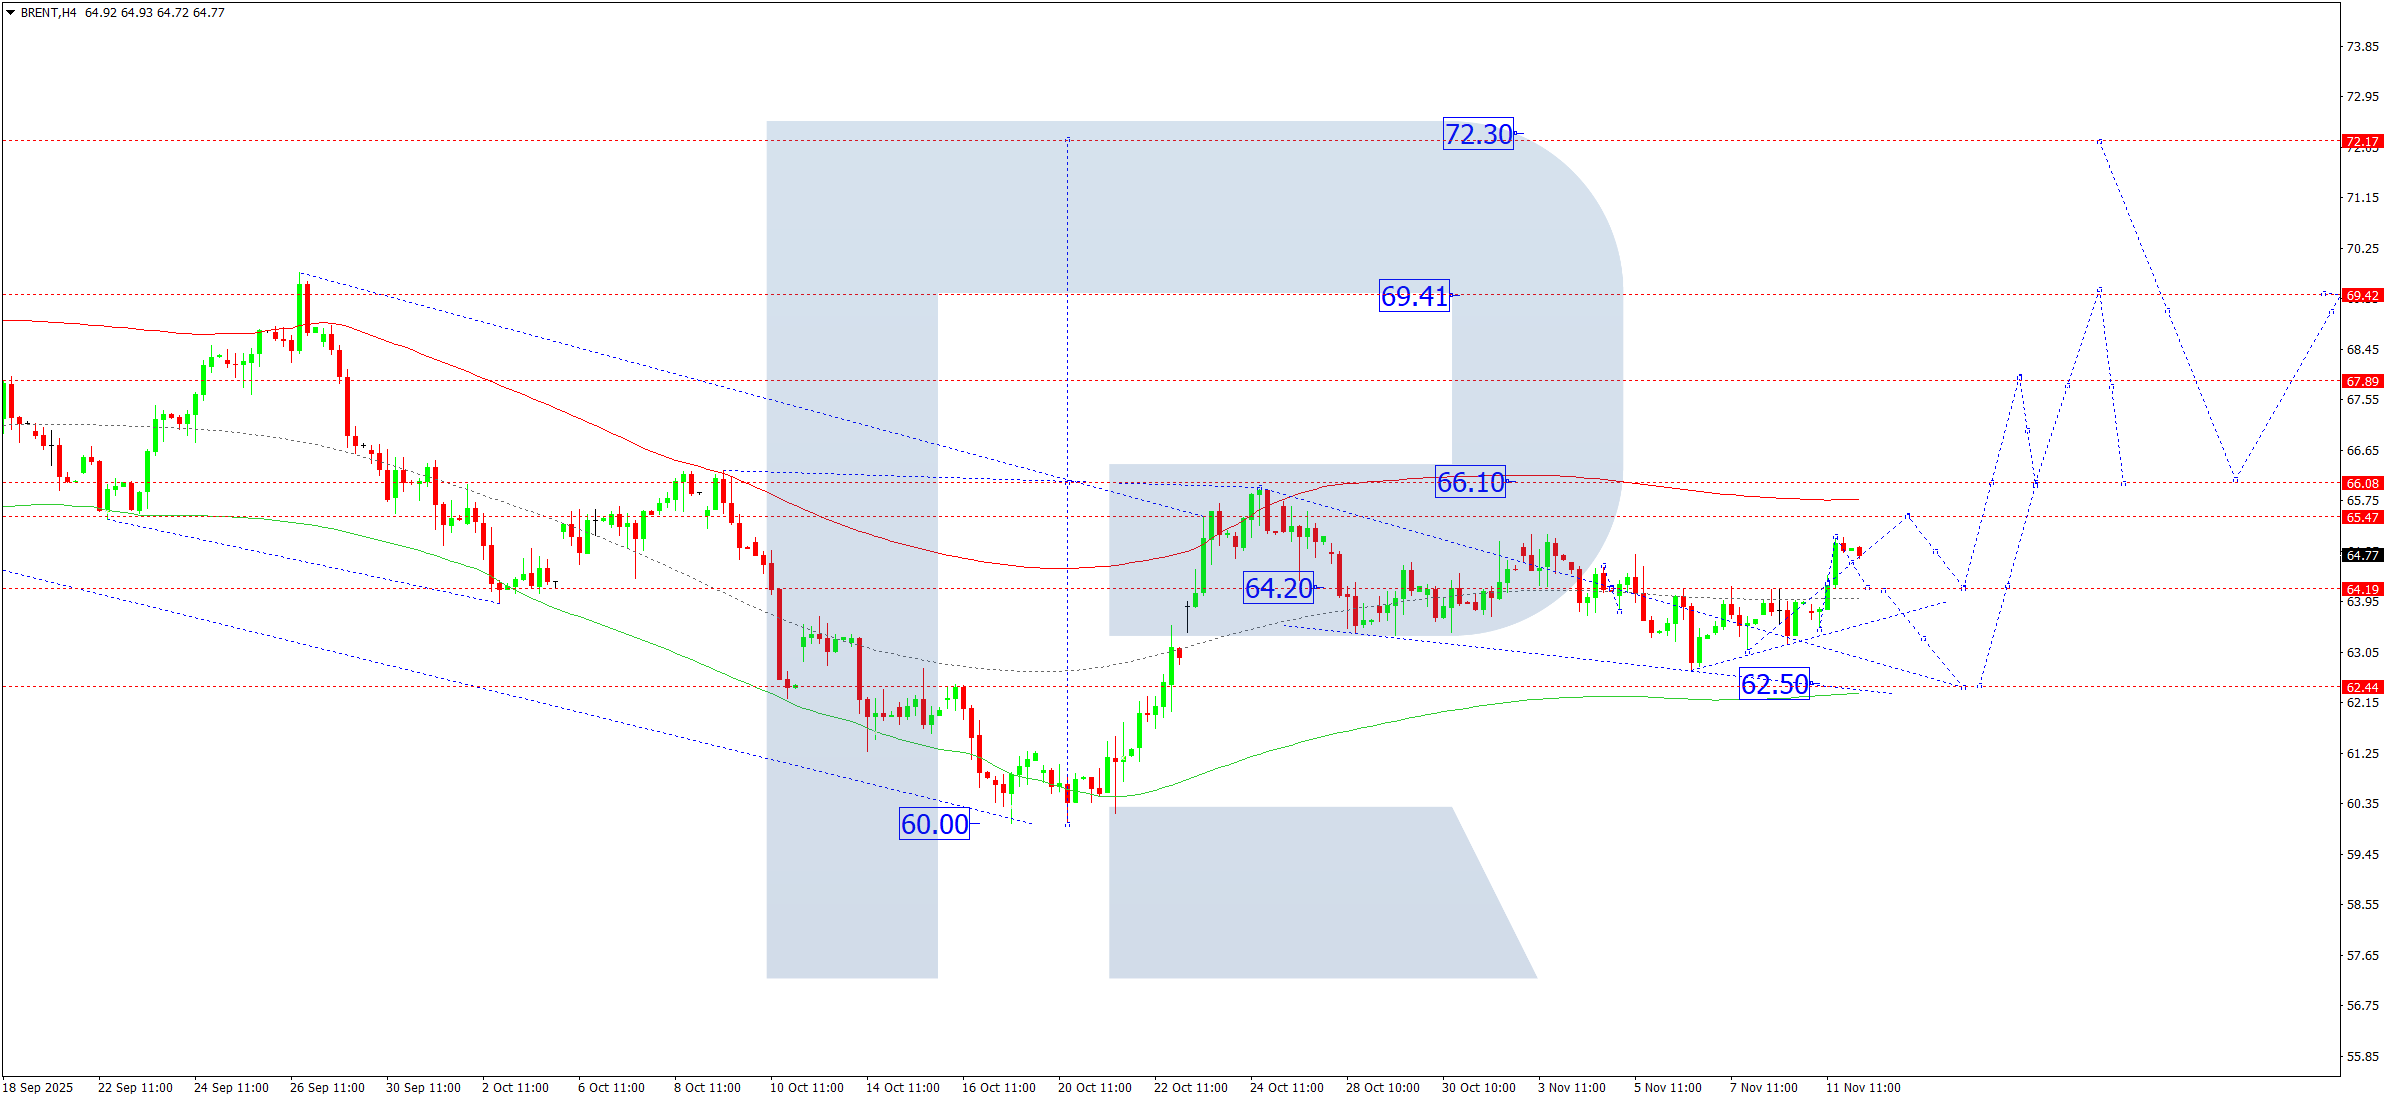
On the H4 chart of Brent crude, the market broke above 64.20 and advanced to 65.11. On 12 November 2025, a pullback toward 64.20 (testing from above) is possible before resuming its upward path toward 65.50. The broader market structure remains within a wide consolidation around 64.20, with the potential for a corrective dip to 62.50, followed by an upward move toward 66.10 and possibly extending to 69.40 as a local target.
The Elliott Wave structure, pivoting at 64.20, confirms the bullish continuation scenario. Having likely completed a correction toward the lower boundary of the Price Envelope at 62.50, Brent may now initiate an upward impulse toward 66.10.
Technical indicators suggest the correction phase could end near 62.50, paving the way for an advance toward 66.10.
Risk Warning:
The results of previous trading operations do not guarantee similar outcomes in the future. Financial markets are inherently volatile; traders should conduct their own analysis and apply sound risk management practices before making investment decisions.
Leave a Reply