
Daily Technical Analysis and Forecast – 13 November 2025
EURUSD Forecast
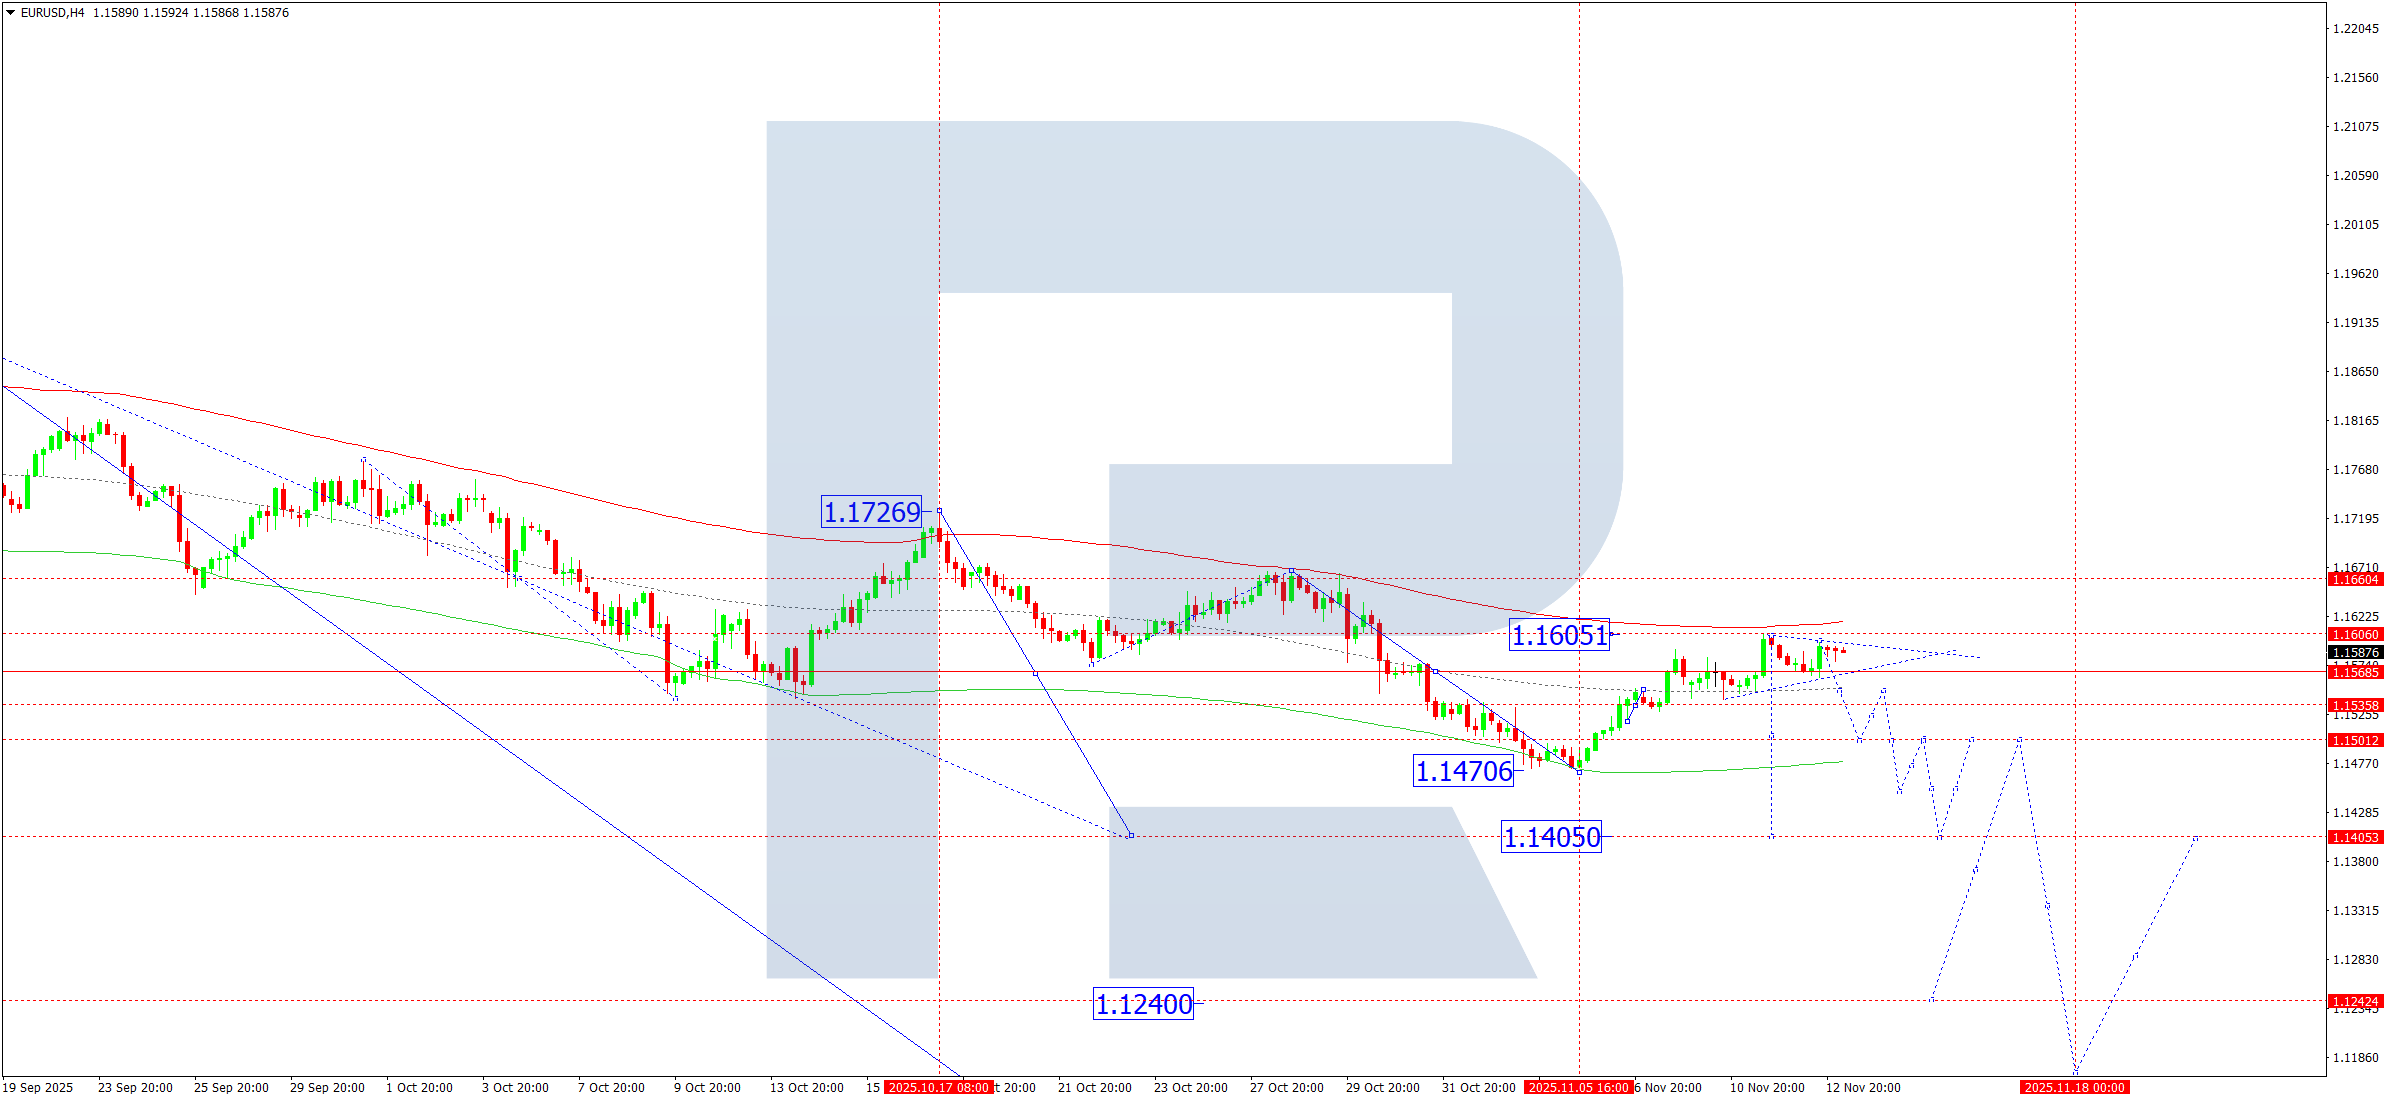
On the H4 chart, EURUSD continues to move within a narrow consolidation range near 1.1586. On 13 November 2025, the most probable scenario is a downward breakout towards 1.1505, with potential continuation to 1.1405. If the pair breaks above the range, a short-term correction towards 1.1660 (testing from below) may follow before resuming the decline towards 1.1405.
The Elliott Wave structure and the downward wave matrix confirm this setup, with the pivot level located at 1.1660. The market has completed a corrective wave up to the upper boundary of the Price Envelope at 1.1605, and a decline towards its lower boundary at 1.1450 is expected today, with a possible continuation to 1.1405.
Technical outlook: Indicators point to a decline towards 1.1450.
USDJPY Forecast
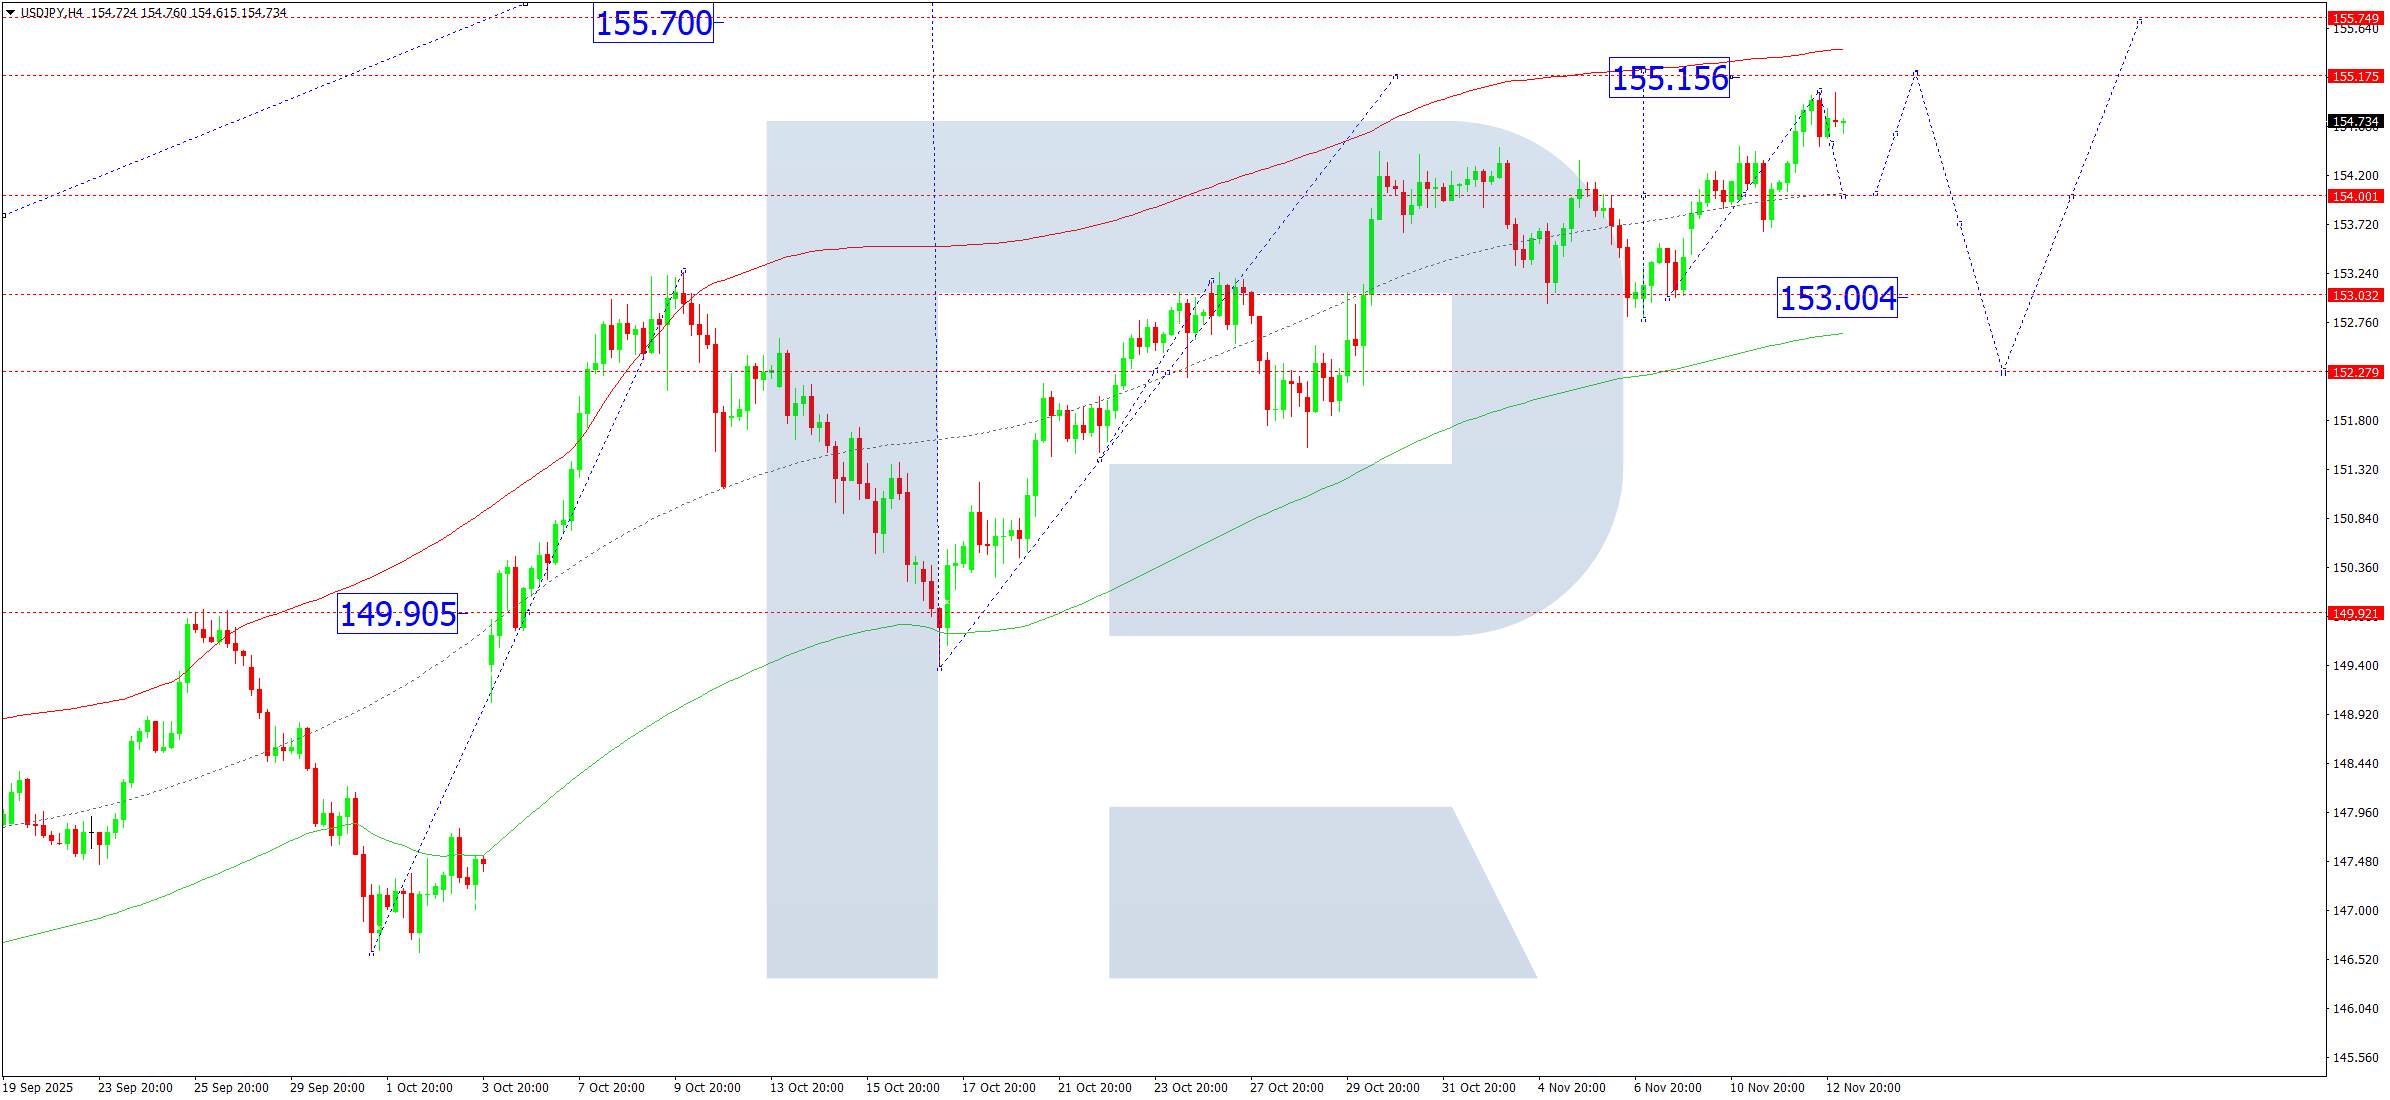
On the H4 chart, USDJPY is forming a consolidation range around 154.00. The range may expand upwards to 155.15, followed by a decline to 153.90. A breakout above 155.15 could open the way for growth towards 155.70, and possibly 157.57. Conversely, a downward breakout could lead to a correction towards 152.22, before resuming growth towards 155.70.
The Elliott Wave structure and upward wave matrix with a pivot at 152.22 support this scenario. The pair is currently consolidating near the midline of the Price Envelope at 154.00; a rise to the upper boundary at 155.15, followed by a pullback to 153.00, and then another move up to 155.70, are all likely steps.
Technical outlook: Indicators suggest potential growth towards 155.15.
GBPUSD Forecast
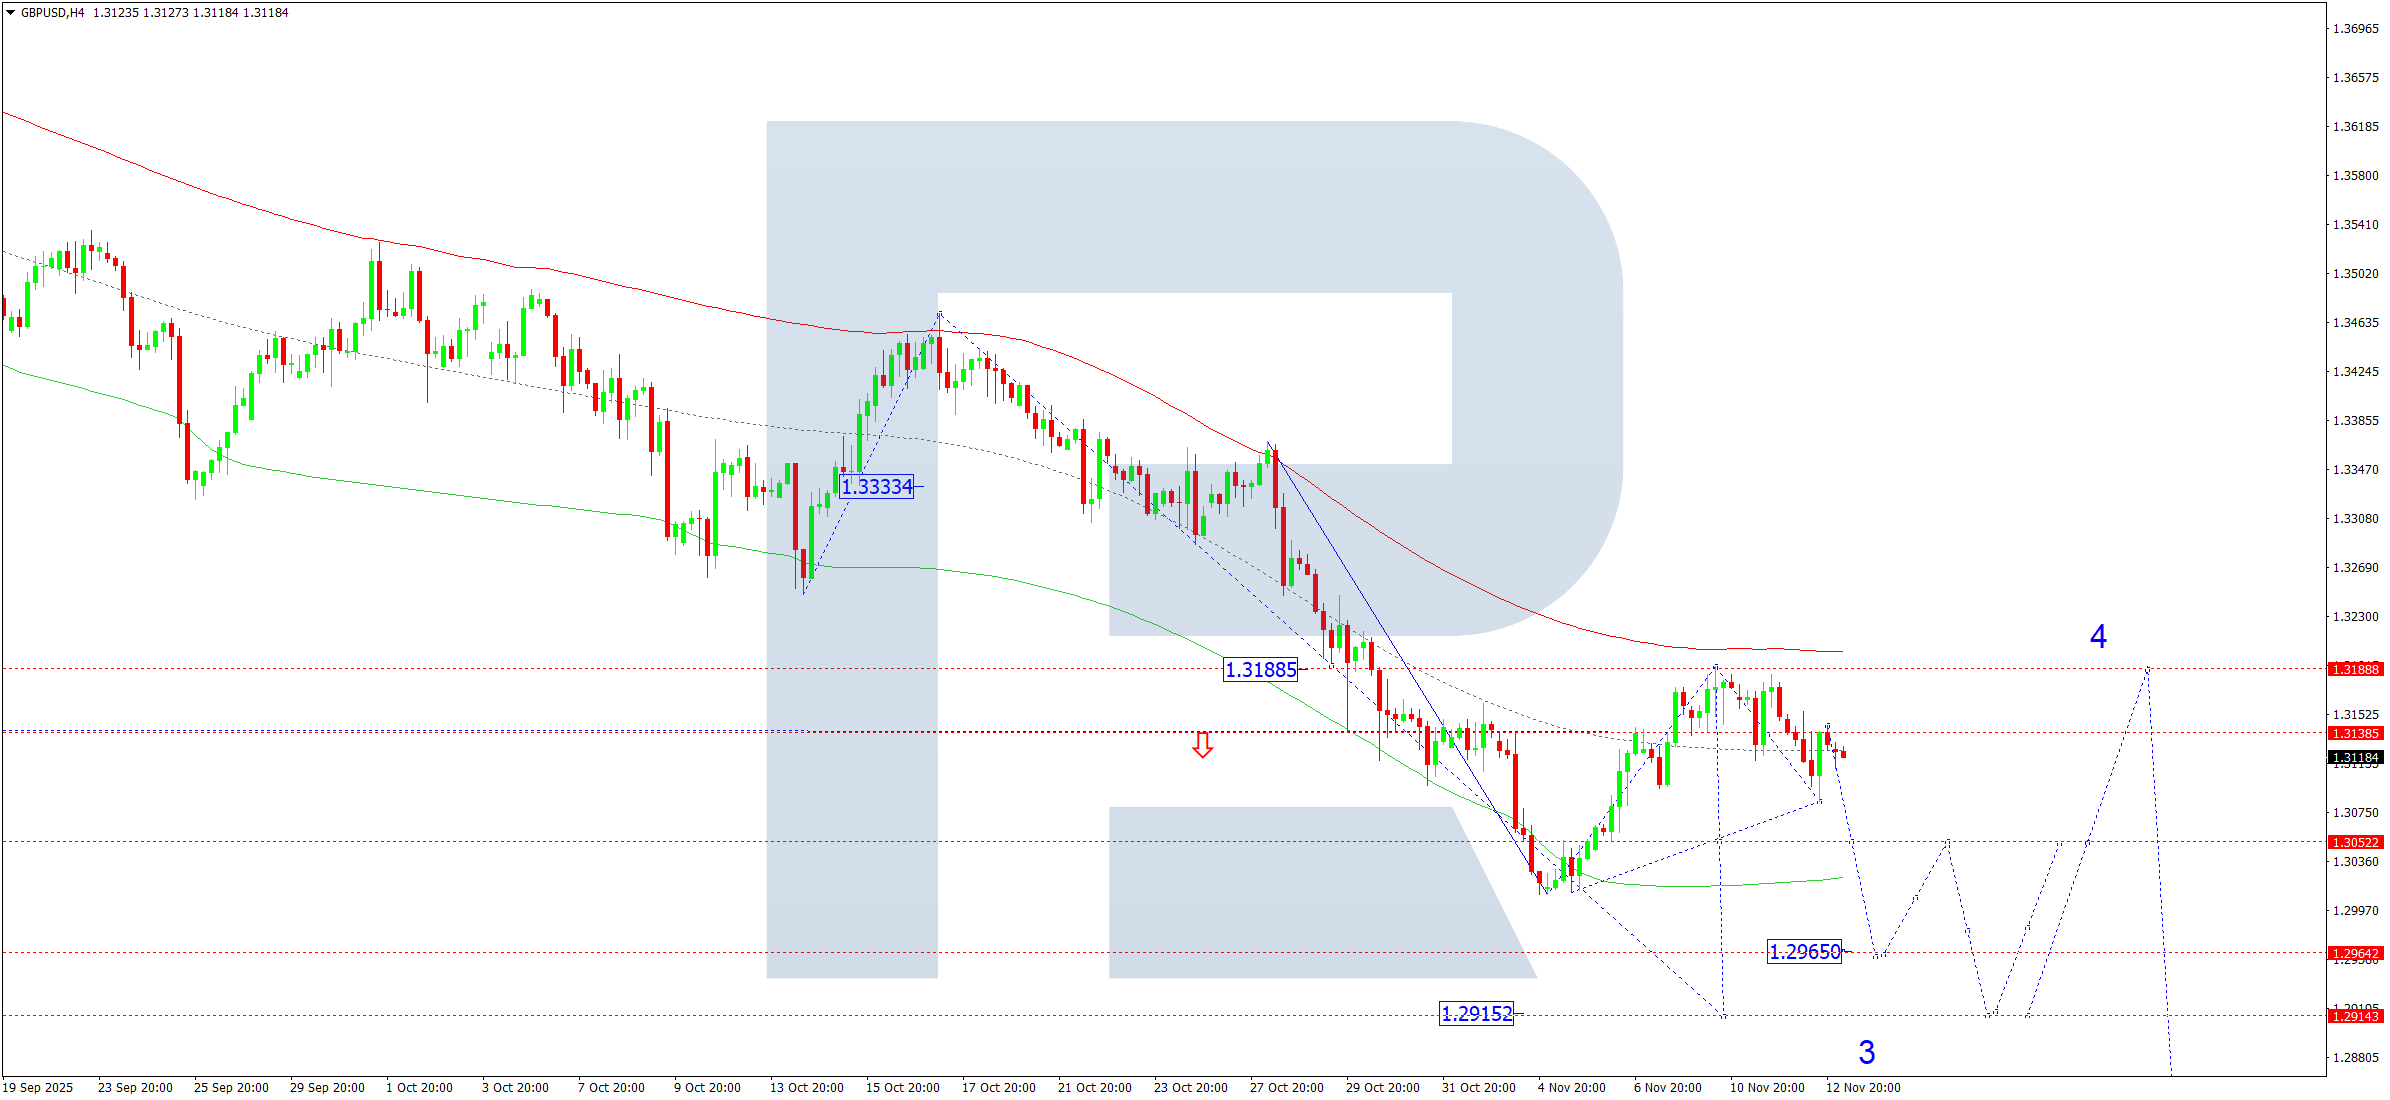
On the H4 chart, GBPUSD completed a downward wave to 1.3083, followed by a correction to 1.3143. On 13 November 2025, a continued decline towards 1.3095 is expected. A break below this level may extend the downward wave to 1.3052, with further continuation towards 1.2965 — a local target within the third wave of the overall downtrend.
The Elliott Wave model and downward wave matrix with a pivot at 1.3188 confirm this view. The correction has reached the upper boundary of the Price Envelope at 1.3188, and a new downward impulse towards 1.2915 is expected.
Technical outlook: Indicators point to the start of a decline towards 1.2915.
AUDUSD Forecast
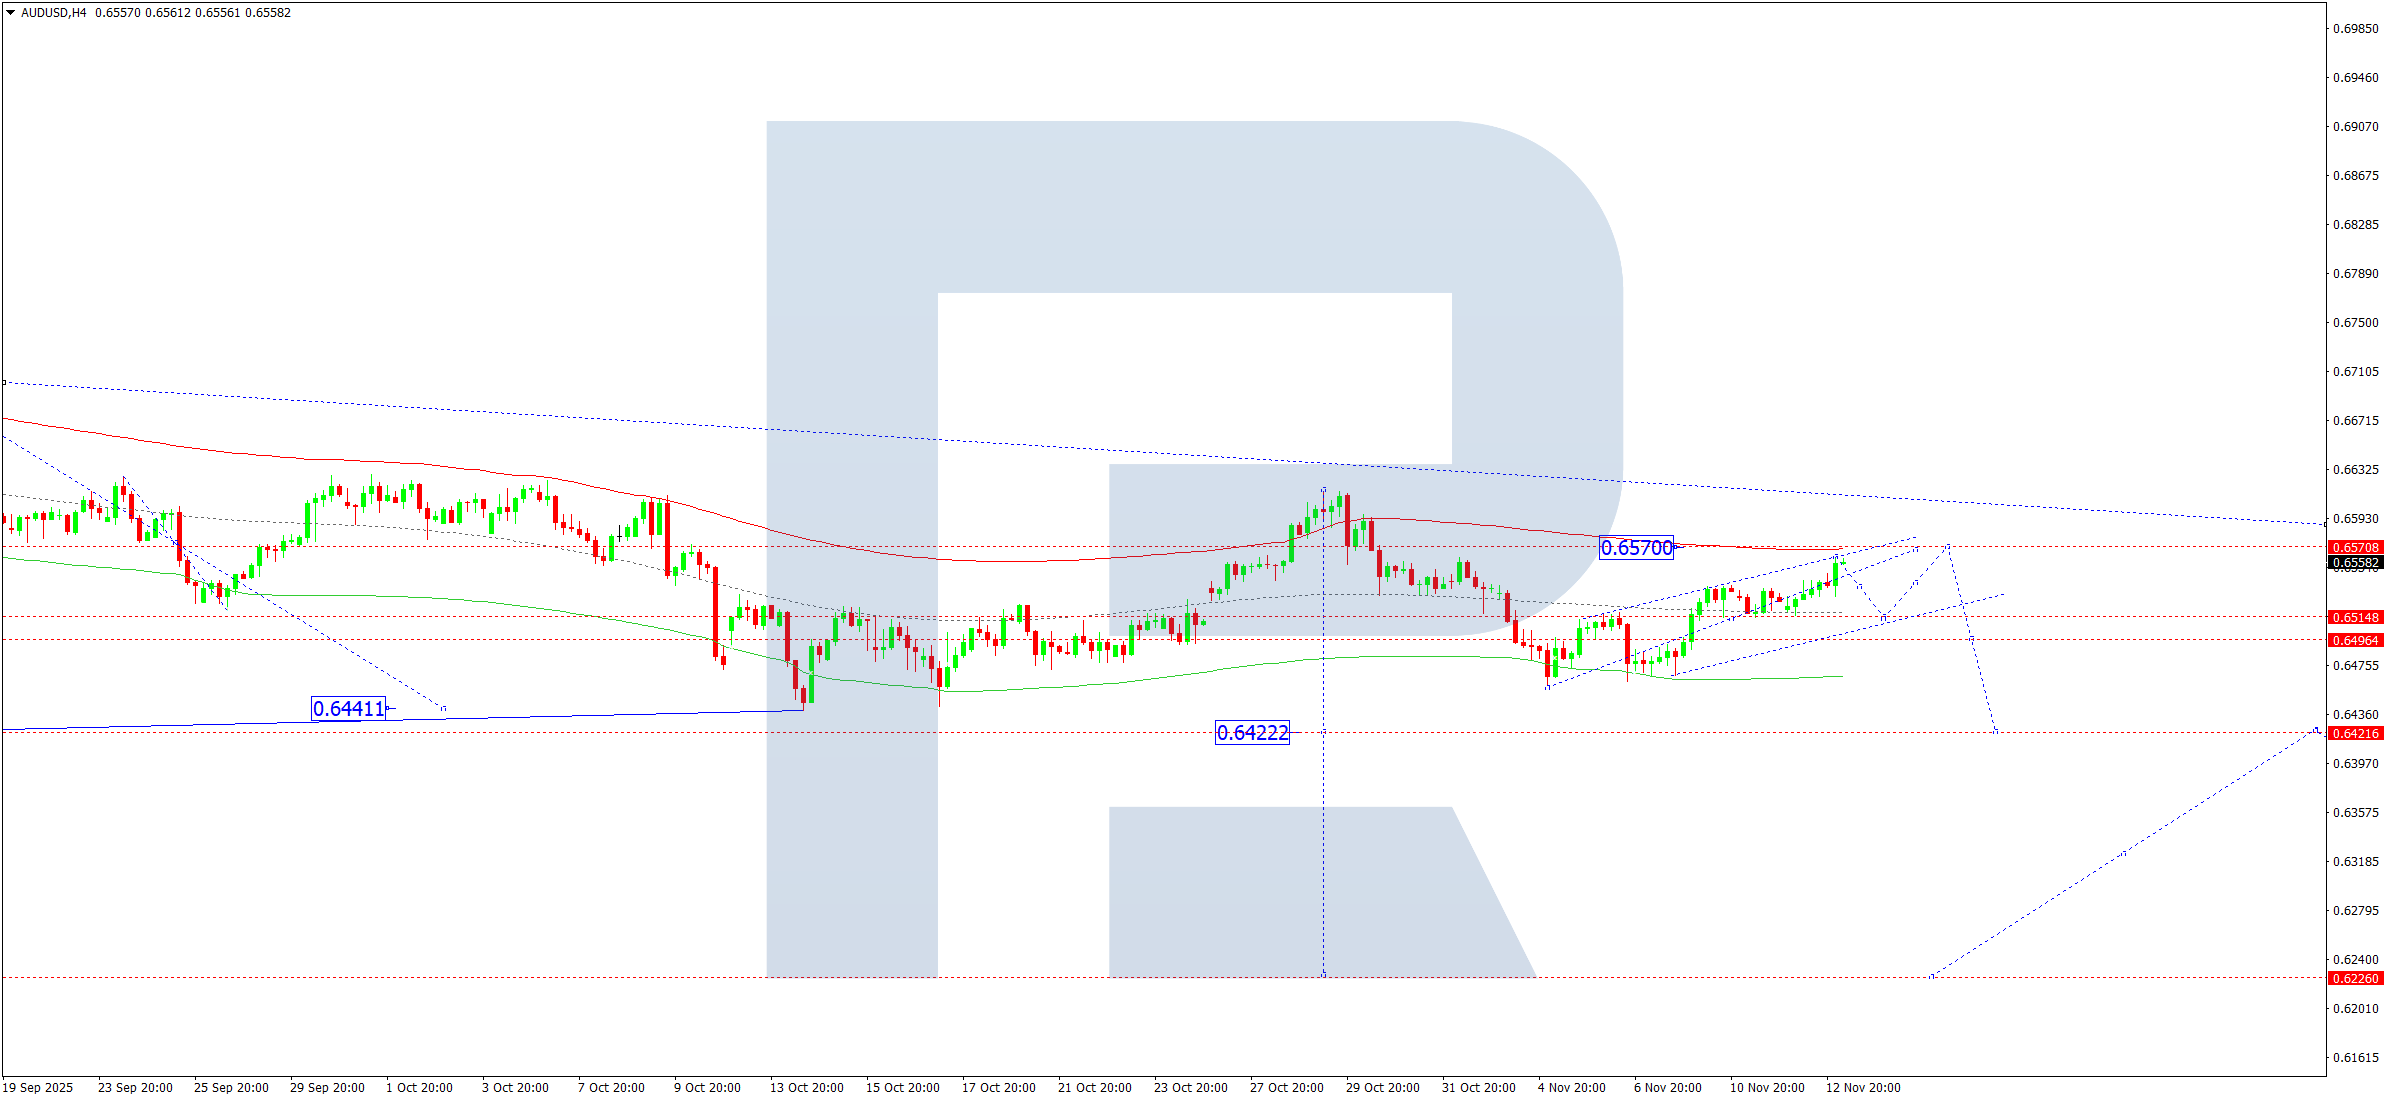
On the H4 chart, AUDUSD has completed a correction to 0.6564. On 13 November 2025, the pair is likely to move downward towards 0.6515, with potential continuation to 0.6422. This movement represents the middle part of the third downward wave targeting 0.6226. If the market holds above 0.6515, another short-term upward correction towards 0.6570 (upper boundary of the Flag pattern) may occur.
The Elliott Wave structure and downward wave matrix with a pivot at 0.6570 confirm this scenario. The pair has reached the upper boundary of the Price Envelope at 0.6564, suggesting a decline towards its midline at 0.6515, followed by a move towards 0.6422.
Technical outlook: Indicators suggest a downward move towards 0.6484.
USDCAD Forecast
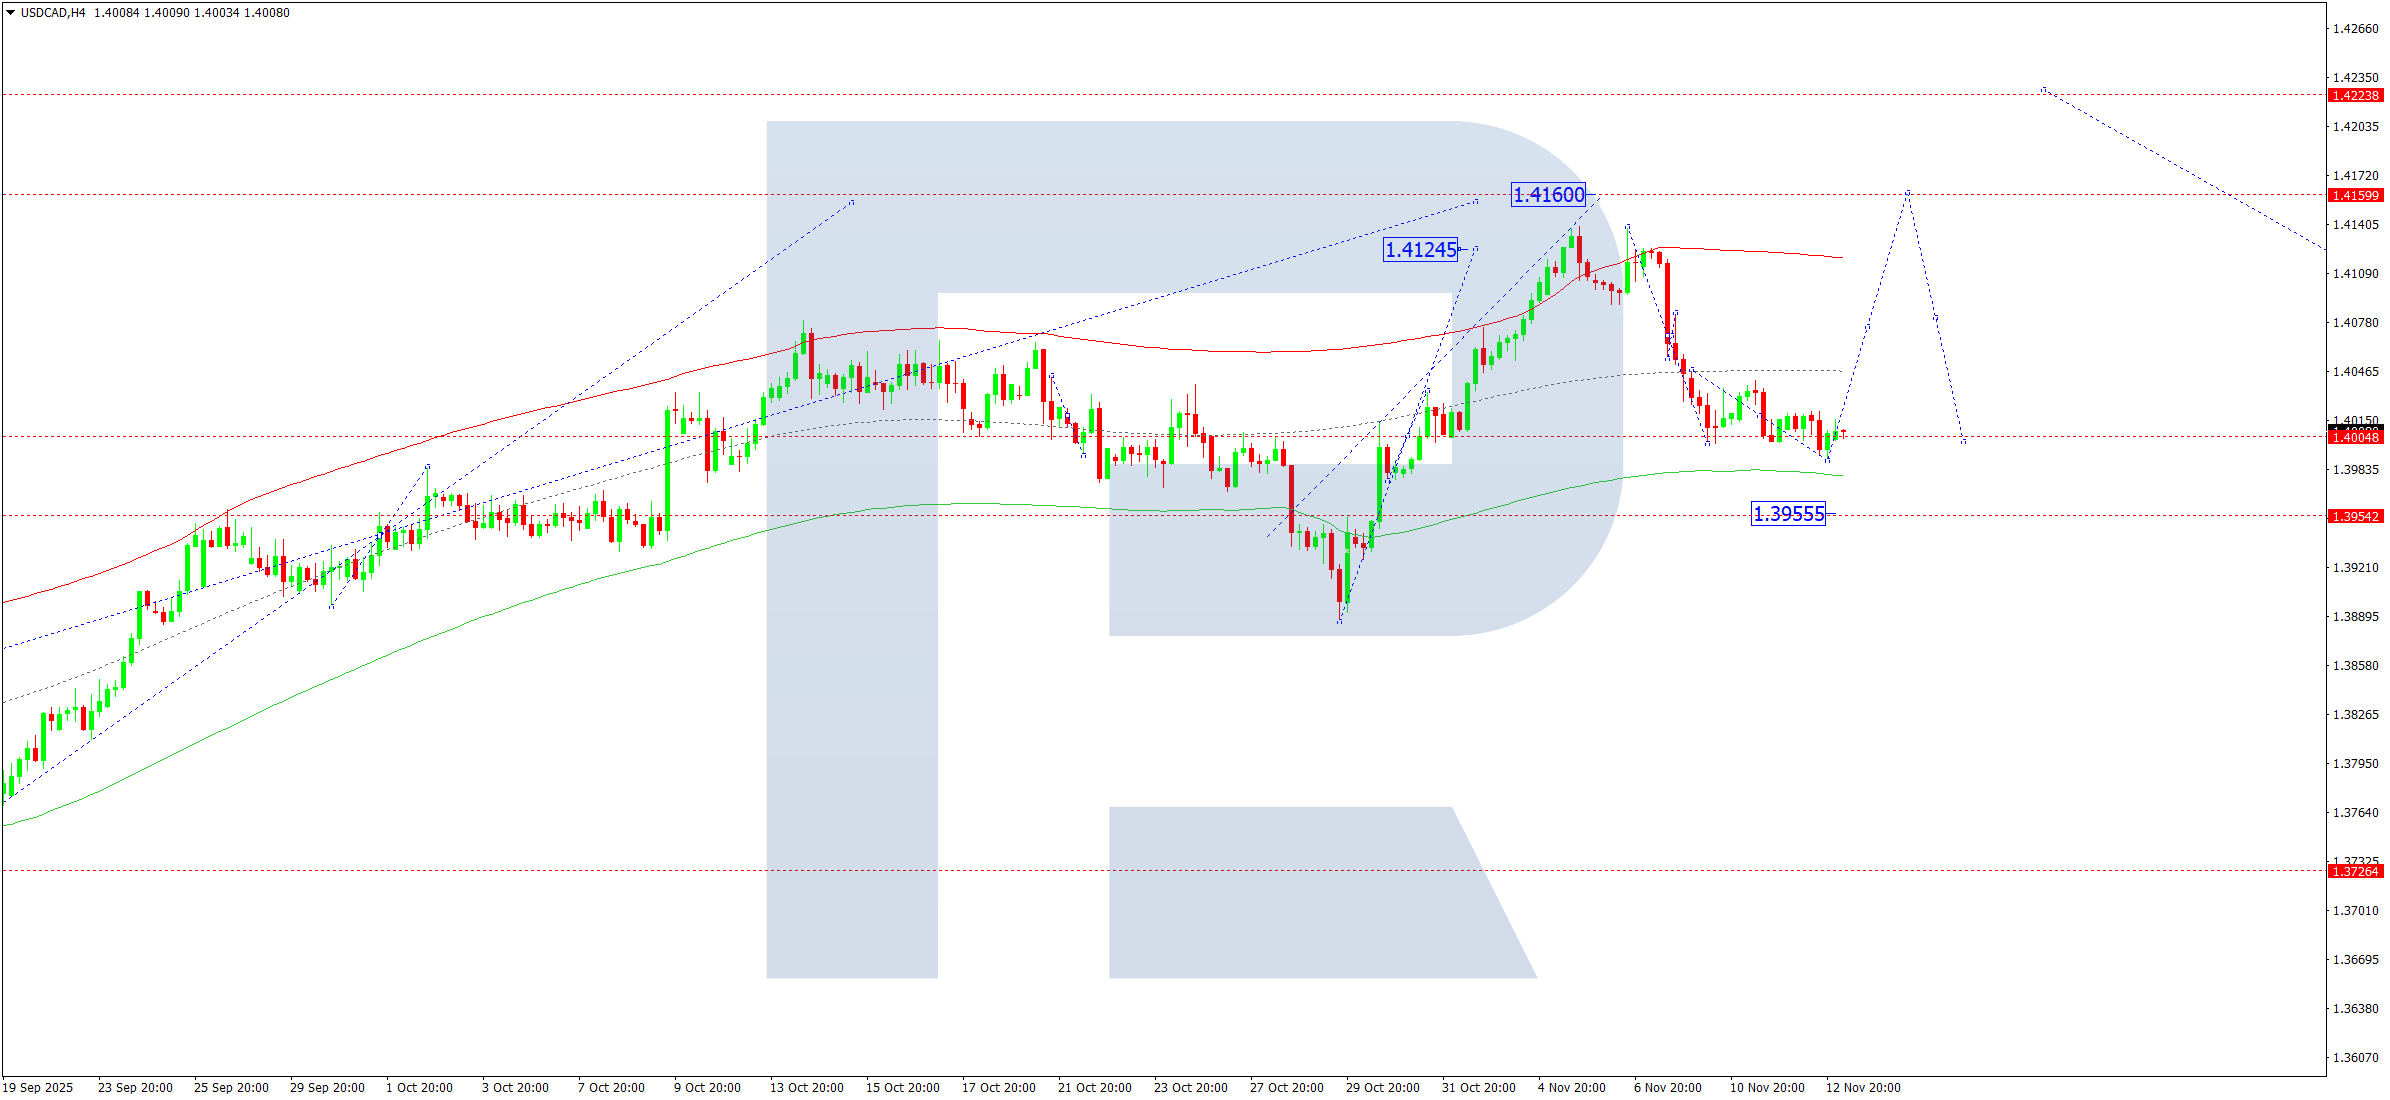
On the H4 chart, USDCAD completed a correction at 1.3989 and is now forming a consolidation range above this level. A breakout to the upside could trigger an advance towards 1.4080, and further towards 1.4160. A downward breakout, however, may extend the correction to 1.3939, followed by a rebound towards 1.4080.
The Elliott Wave structure and upward wave matrix with a pivot at 1.3939 support this setup. Having completed a correction near the lower boundary of the Price Envelope at 1.3989, the market is now likely to rise towards the upper boundary at 1.4160.
Technical outlook: Indicators point to continued upward movement towards 1.4080.
XAUUSD (Gold) Forecast
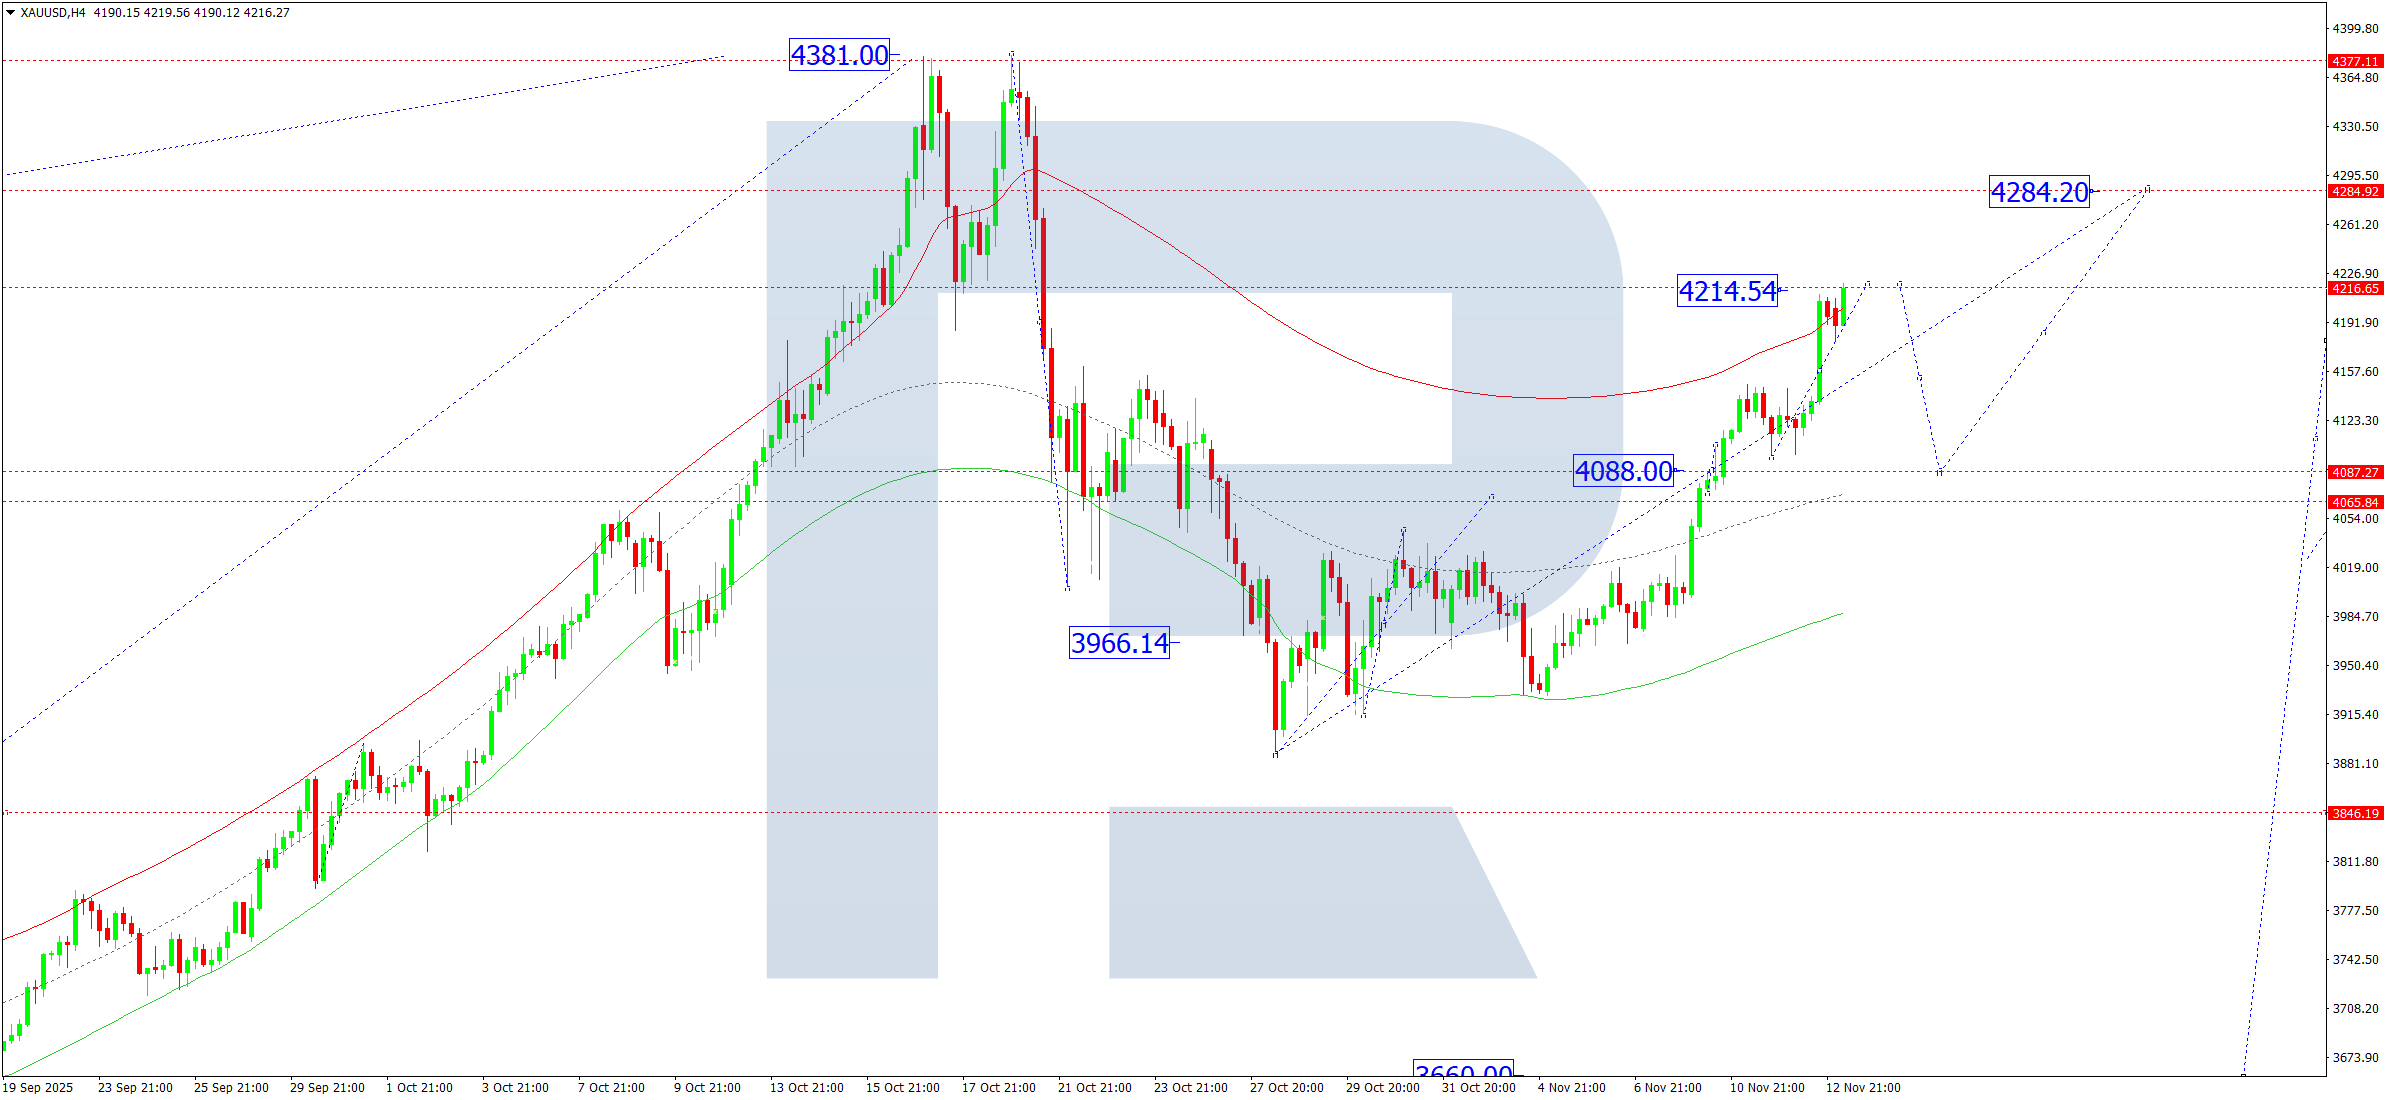
On the H4 chart, XAUUSD (Gold) formed a consolidation near 4,088 and broke upward, completing a wave towards 4,214. On 13 November 2025, a pullback towards 4,088 (testing from above) is possible as part of a broader consolidation. A downward breakout could extend the correction to 3,850, while an upward breakout could push the trend further to 4,284.
The Elliott Wave structure and upward wave matrix with a pivot at 4,088 confirm this scenario. The market is consolidating below the upper boundary of the Price Envelope at 4,214, suggesting a potential dip to the midline at 4,088, followed by renewed growth towards 4,215–4,284.
Technical outlook: Indicators suggest a short-term correction to 4,088, followed by a rise towards 4,215–4,284.
Brent Crude Oil Forecast
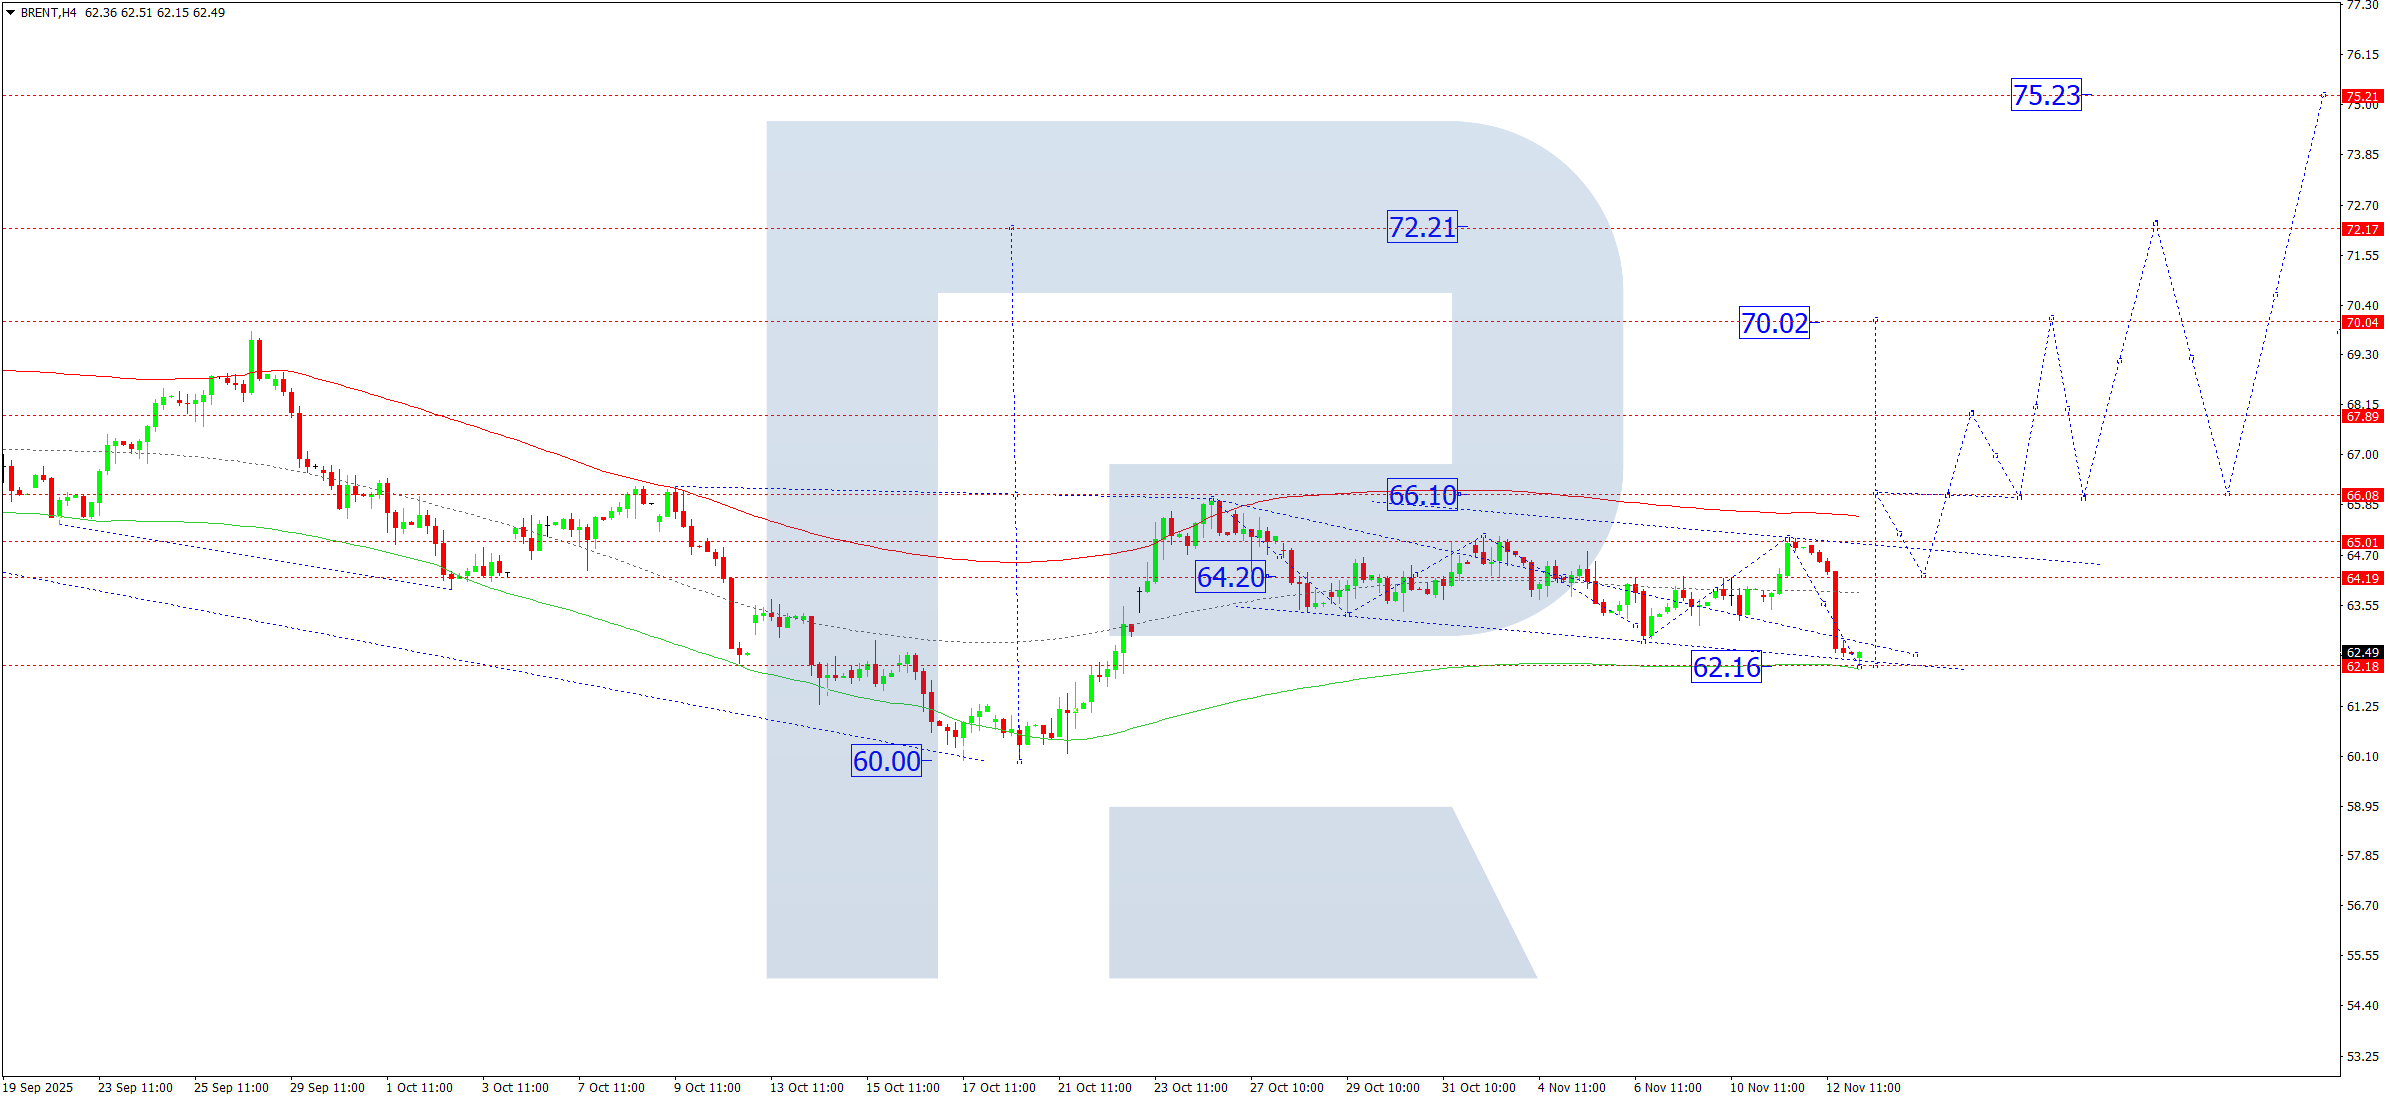
On the H4 chart, Brent crude oil completed another corrective move down to 62.15. On 13 November 2025, an upward impulse towards 65.00 is expected. Above this level, the market may form a wide consolidation range. A breakout higher could lead to a rise towards 66.10, with a possible continuation to the local target of 70.00.
The Elliott Wave pattern and upward wave matrix with a pivot at 62.15 support this scenario. Having corrected to the lower boundary of the Price Envelope at 62.15, the market is now expected to begin a new upward phase towards 66.10.
Technical outlook: Indicators suggest the start of an upward movement towards 66.10.
Risk Warning:
Past trading performance does not guarantee future results. Market analysis is based on technical indicators and wave structures that may change under the influence of macroeconomic factors or volatility.
Leave a Reply