
Daily Technical Analysis and Forecast – 18 November 2025
EURUSD Forecast
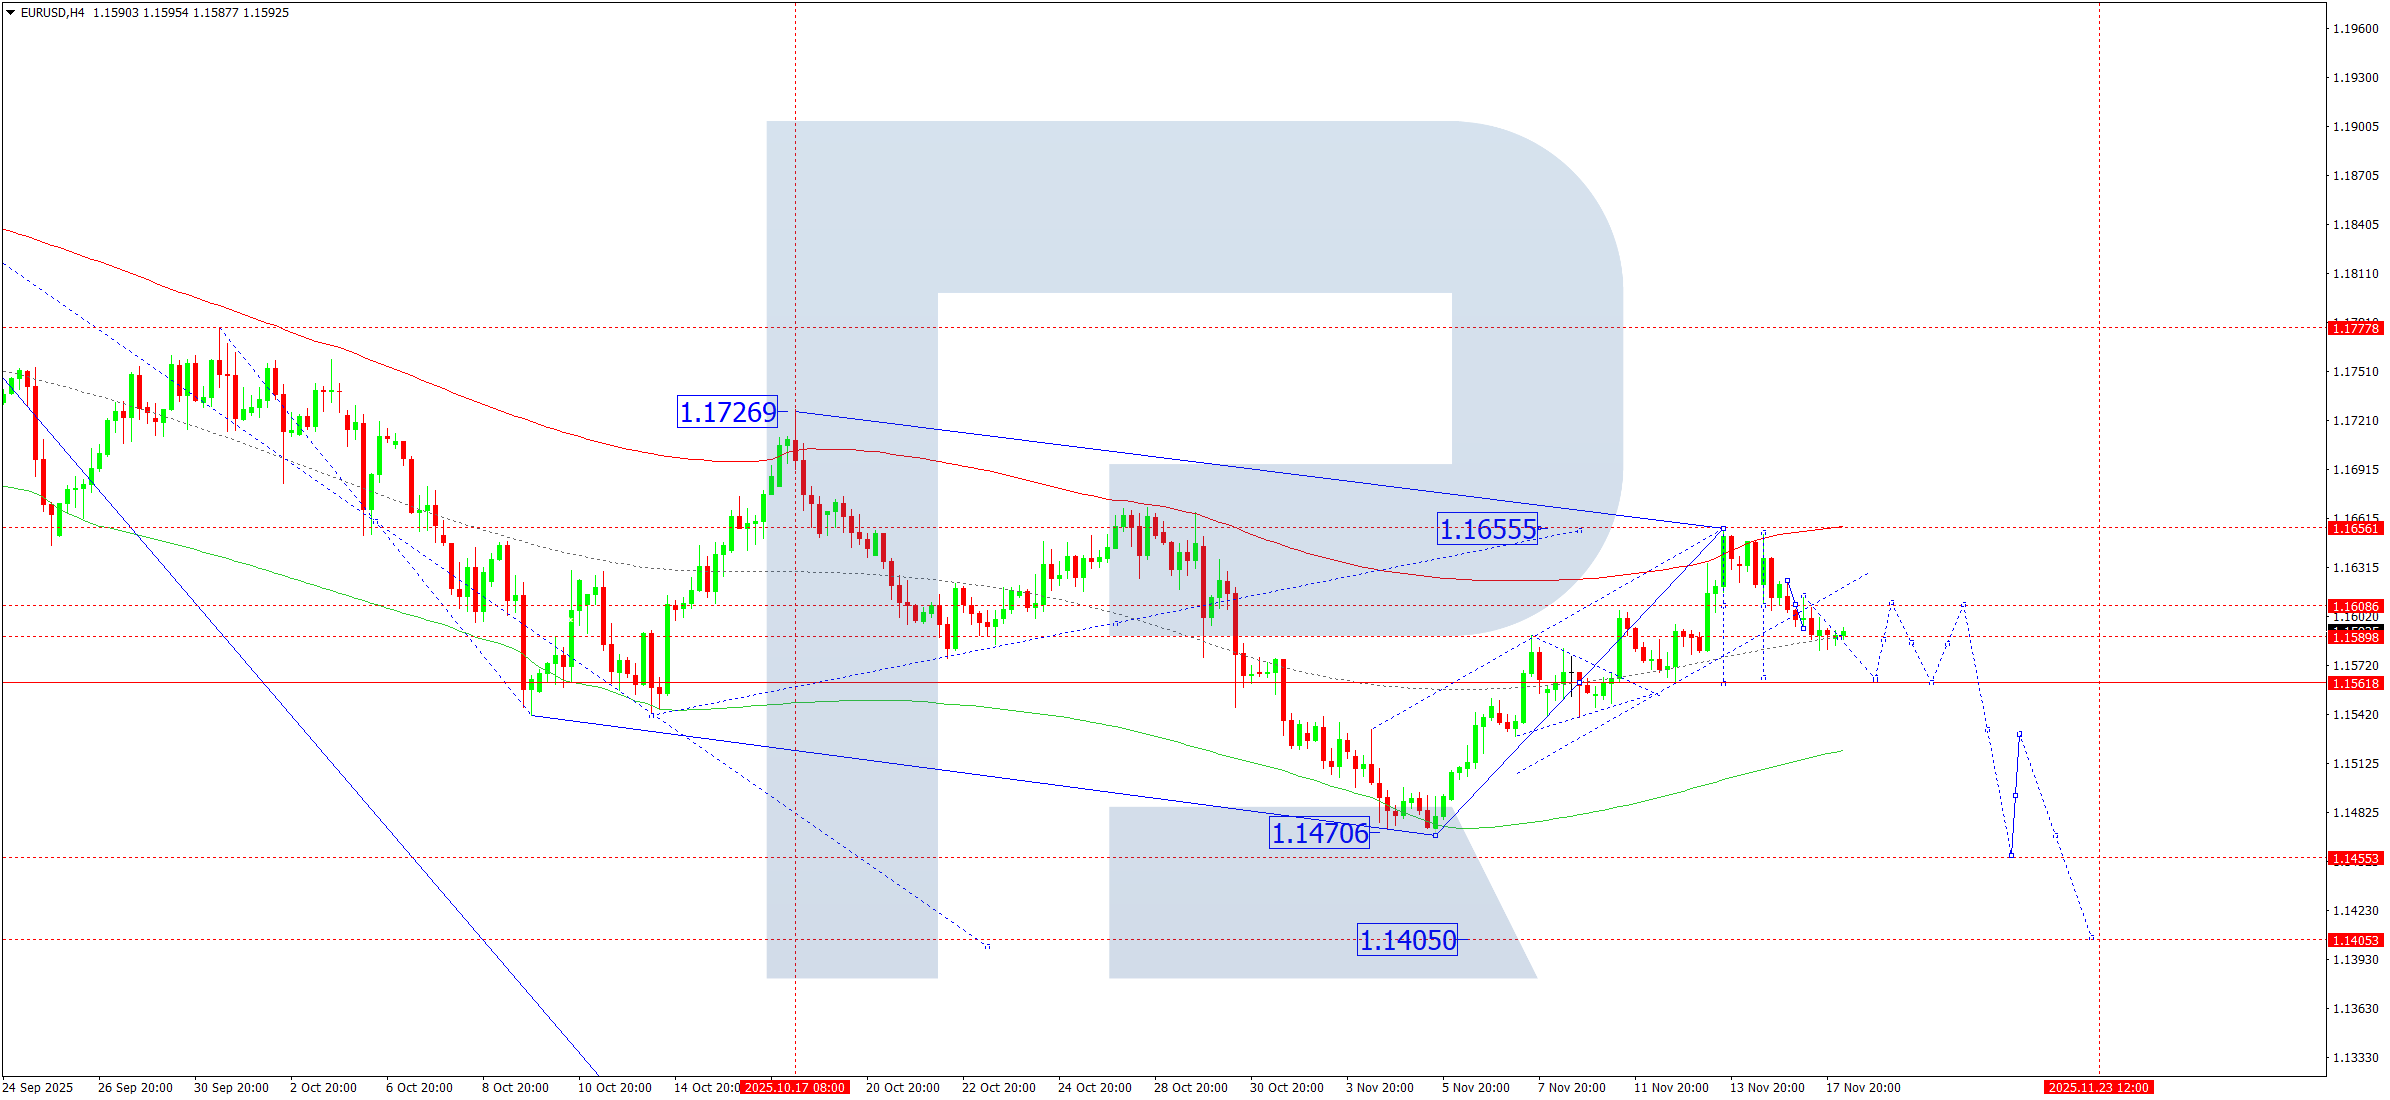
On the H4 chart, EURUSD formed a tight consolidation around 1.1608 before breaking downward and exiting the ascending channel. On 18 November 2025, the pair is developing the second leg of a bearish impulse towards 1.1562. A corrective pullback to 1.1606 may follow, after which the downtrend could extend to 1.1515, and potentially further to 1.1405.
The Elliott Wave structure and the downward-wave Matrix with a rotation centre at 1.1660 support this bearish outlook. Price is currently trending toward the Price Envelope’s central line at 1.1562, where a corrective rebound is expected before another decline.
Indicators point toward continued downside movement toward 1.1562.
USDJPY Forecast
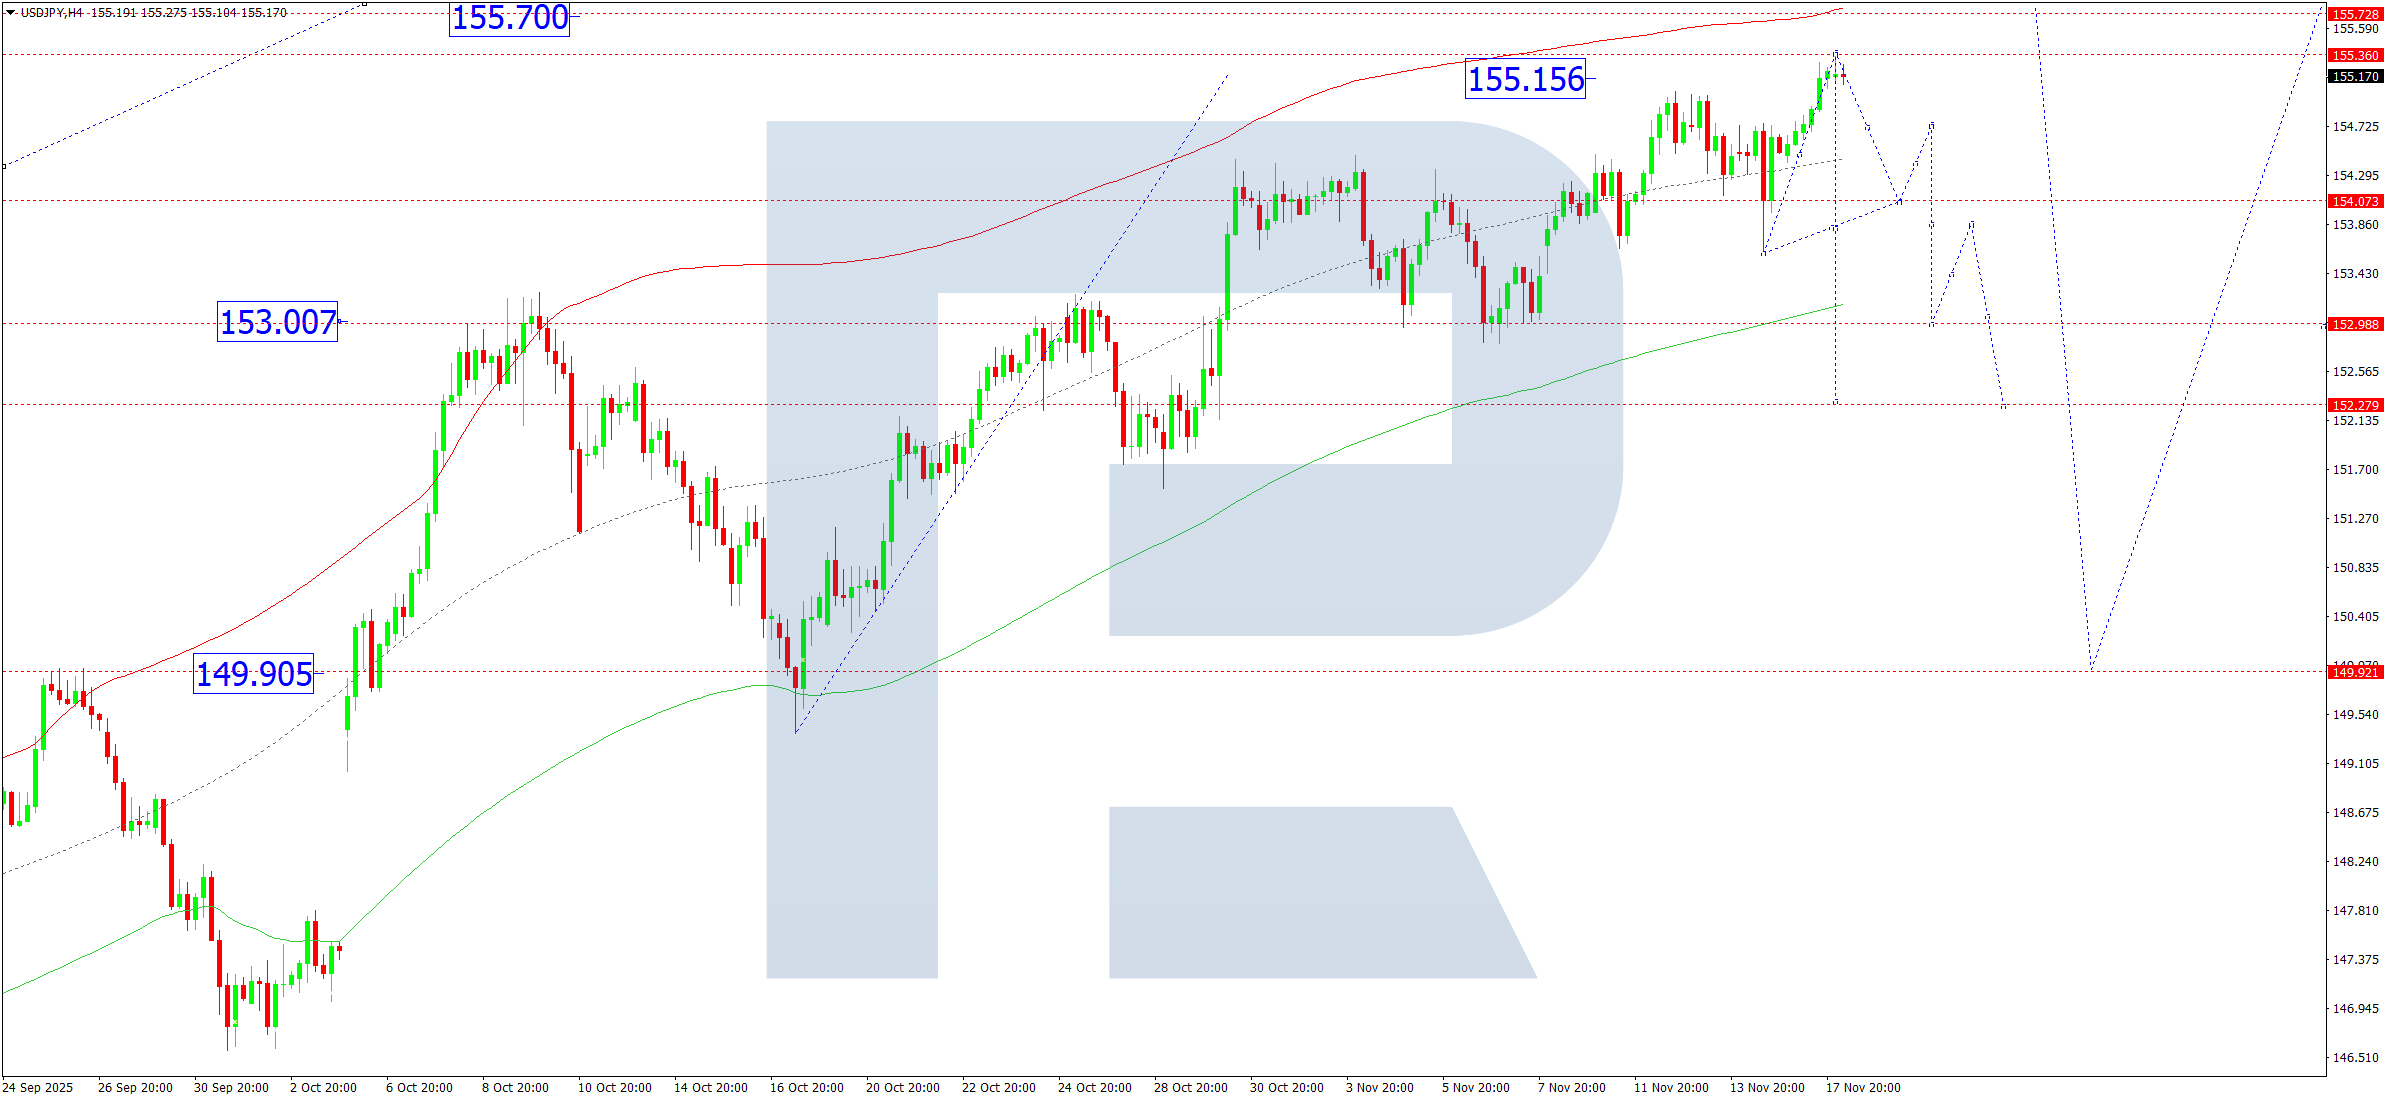
USDJPY completed a bullish wave toward 155.36 on the H4 timeframe and is now expected to form a compact range below this level. A downward breakout could trigger a correction to 154.00, followed by a potential rebound to 154.70. A deeper decline toward 152.22 remains possible. An upward breakout from the range may extend the rally to 155.70.
The Elliott Wave structure and the upward-wave Matrix centred at 152.22 reinforce this scenario. The pair is now consolidating near the Price Envelope’s central line at 154.44, with an upward swing to 155.70 still possible before a corrective dip to 153.00.
Indicators favour a pullback toward 154.00.
GBPUSD Forecast
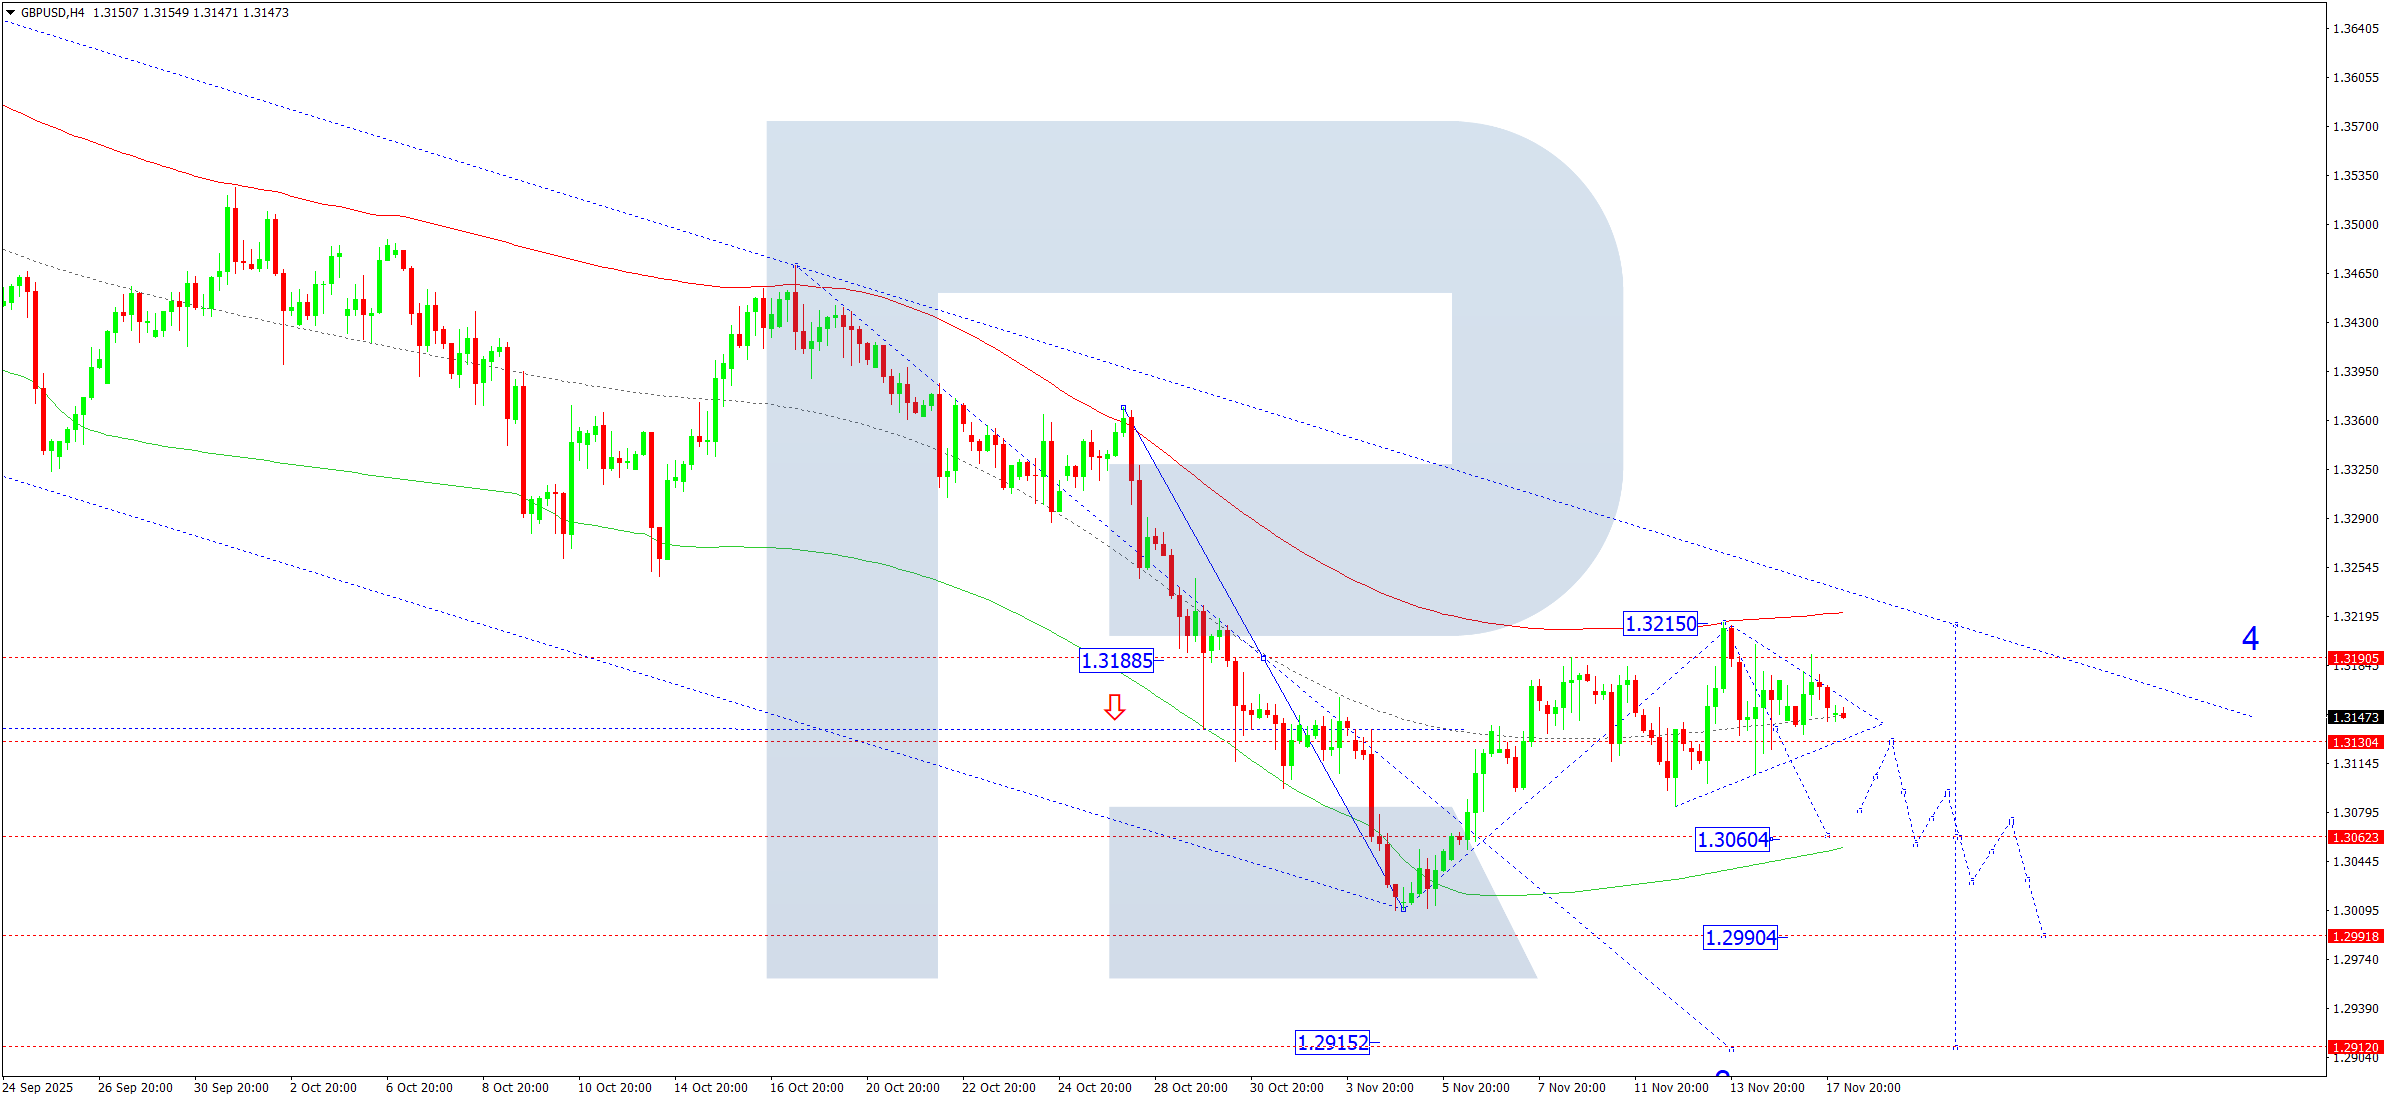
GBPUSD continues to consolidate around 1.3155. A downside breakout is expected on 18 November 2025, opening the way toward 1.3060. If this level is breached, the decline could extend to 1.2990 and potentially to 1.2915.
Elliott Wave analysis and the downward-wave Matrix with a rotation centre at 1.3188 confirm this bearish structure. The pair recently completed a correction toward the upper Price Envelope boundary at 1.3215, and a continuation lower toward 1.3060 is anticipated.
Indicators signal the start of a downward move toward 1.3060.
AUDUSD Forecast
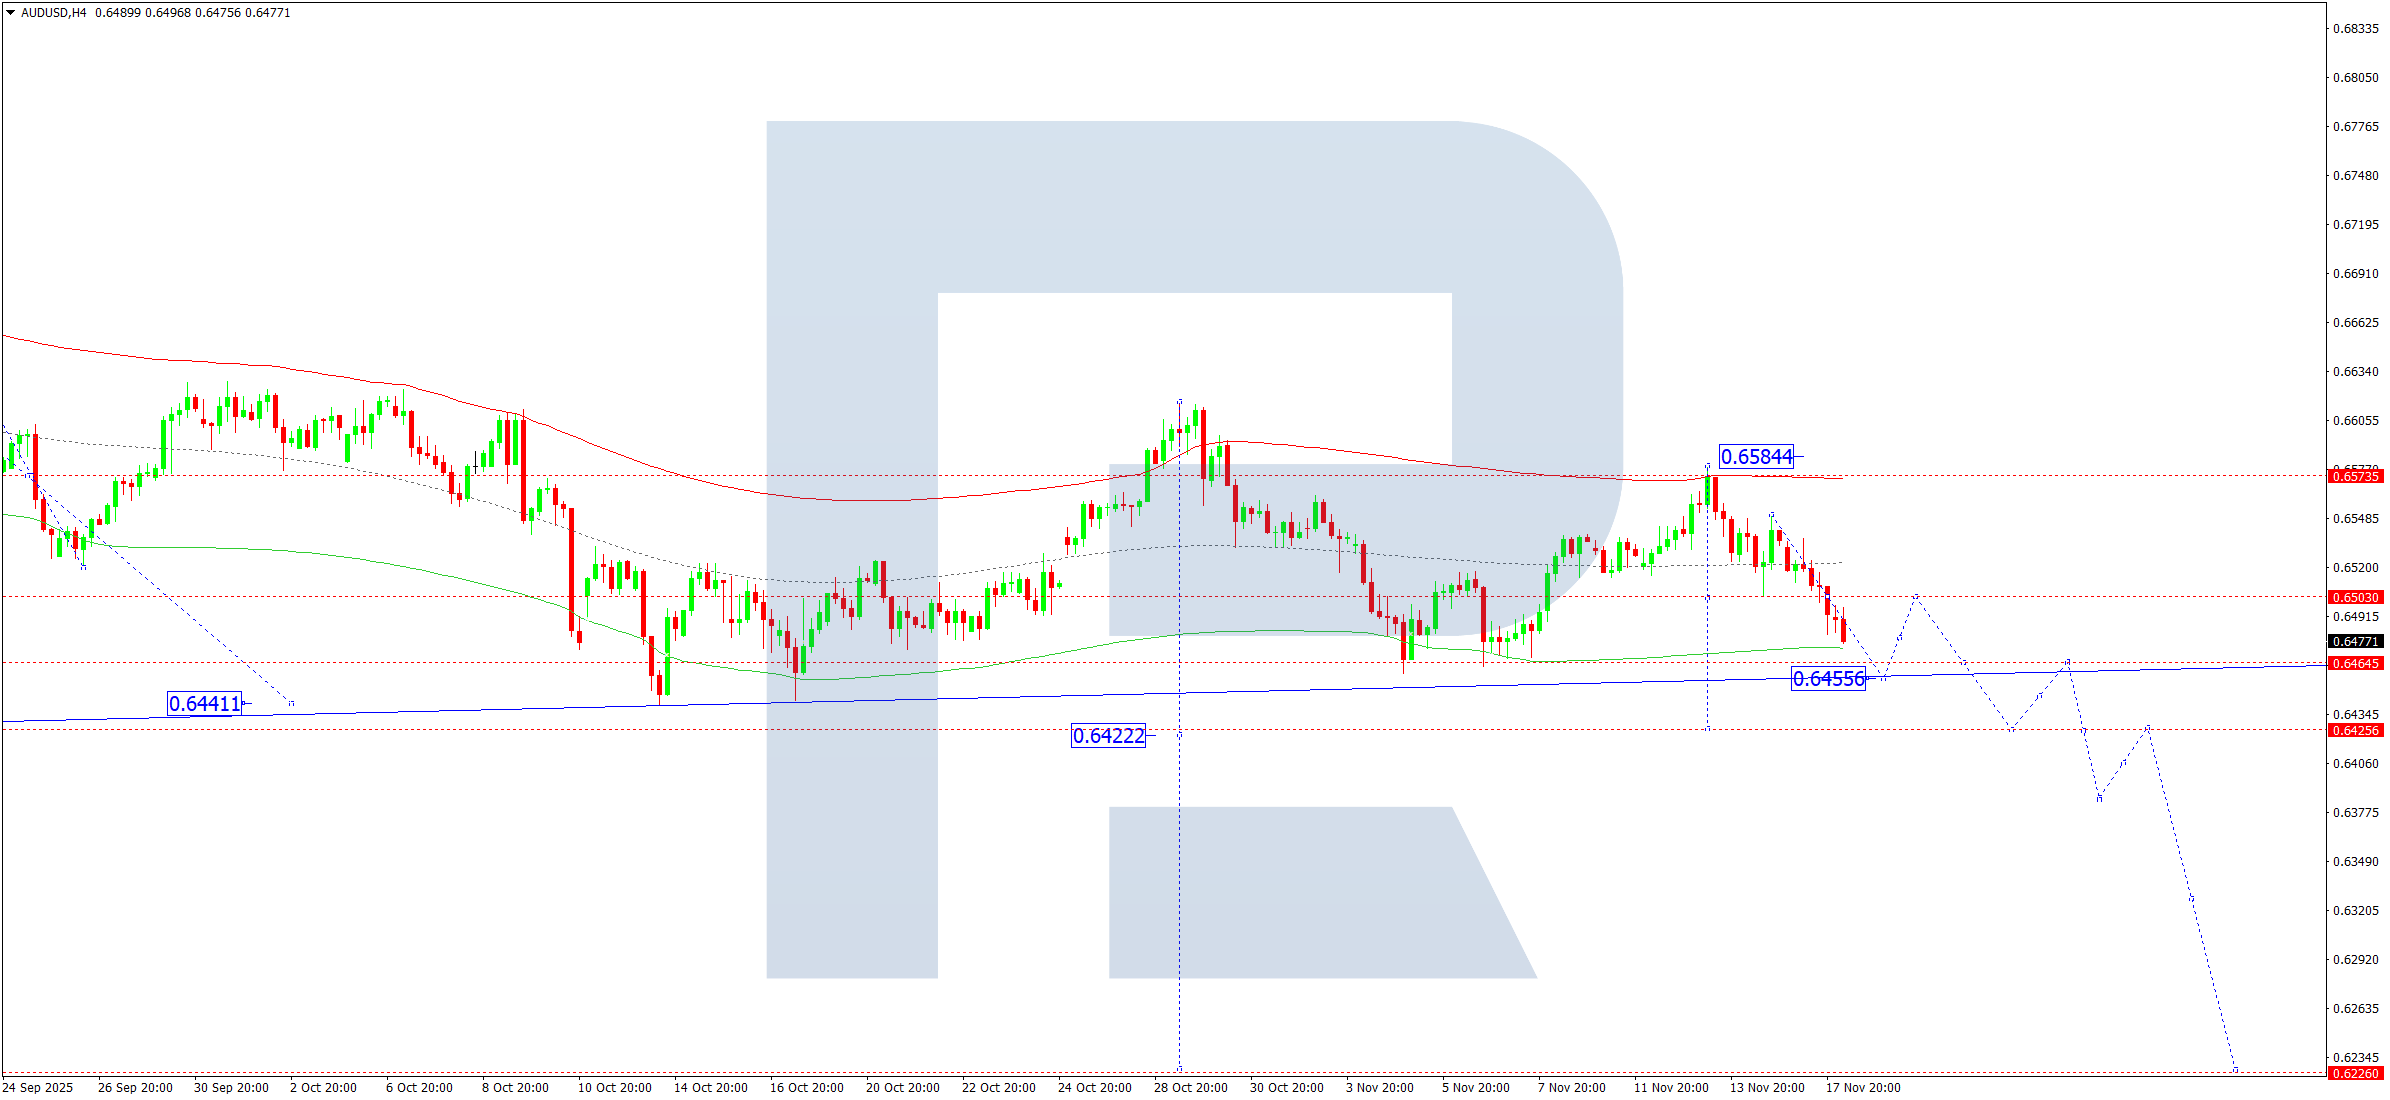
AUDUSD has broken below 0.6500 and continues trending downward toward 0.6455. This level is expected to be reached on 18 November 2025, followed by a corrective rebound toward 0.6500, after which the decline may resume toward 0.6422.
The Elliott Wave pattern and downward-wave Matrix centred at 0.6570 support this outlook. The pair recently completed a corrective rise to the upper Price Envelope boundary at 0.6584, and the next target lies at 0.6455.
Indicators suggest renewed downside movement toward 0.6455.
USDCAD Forecast
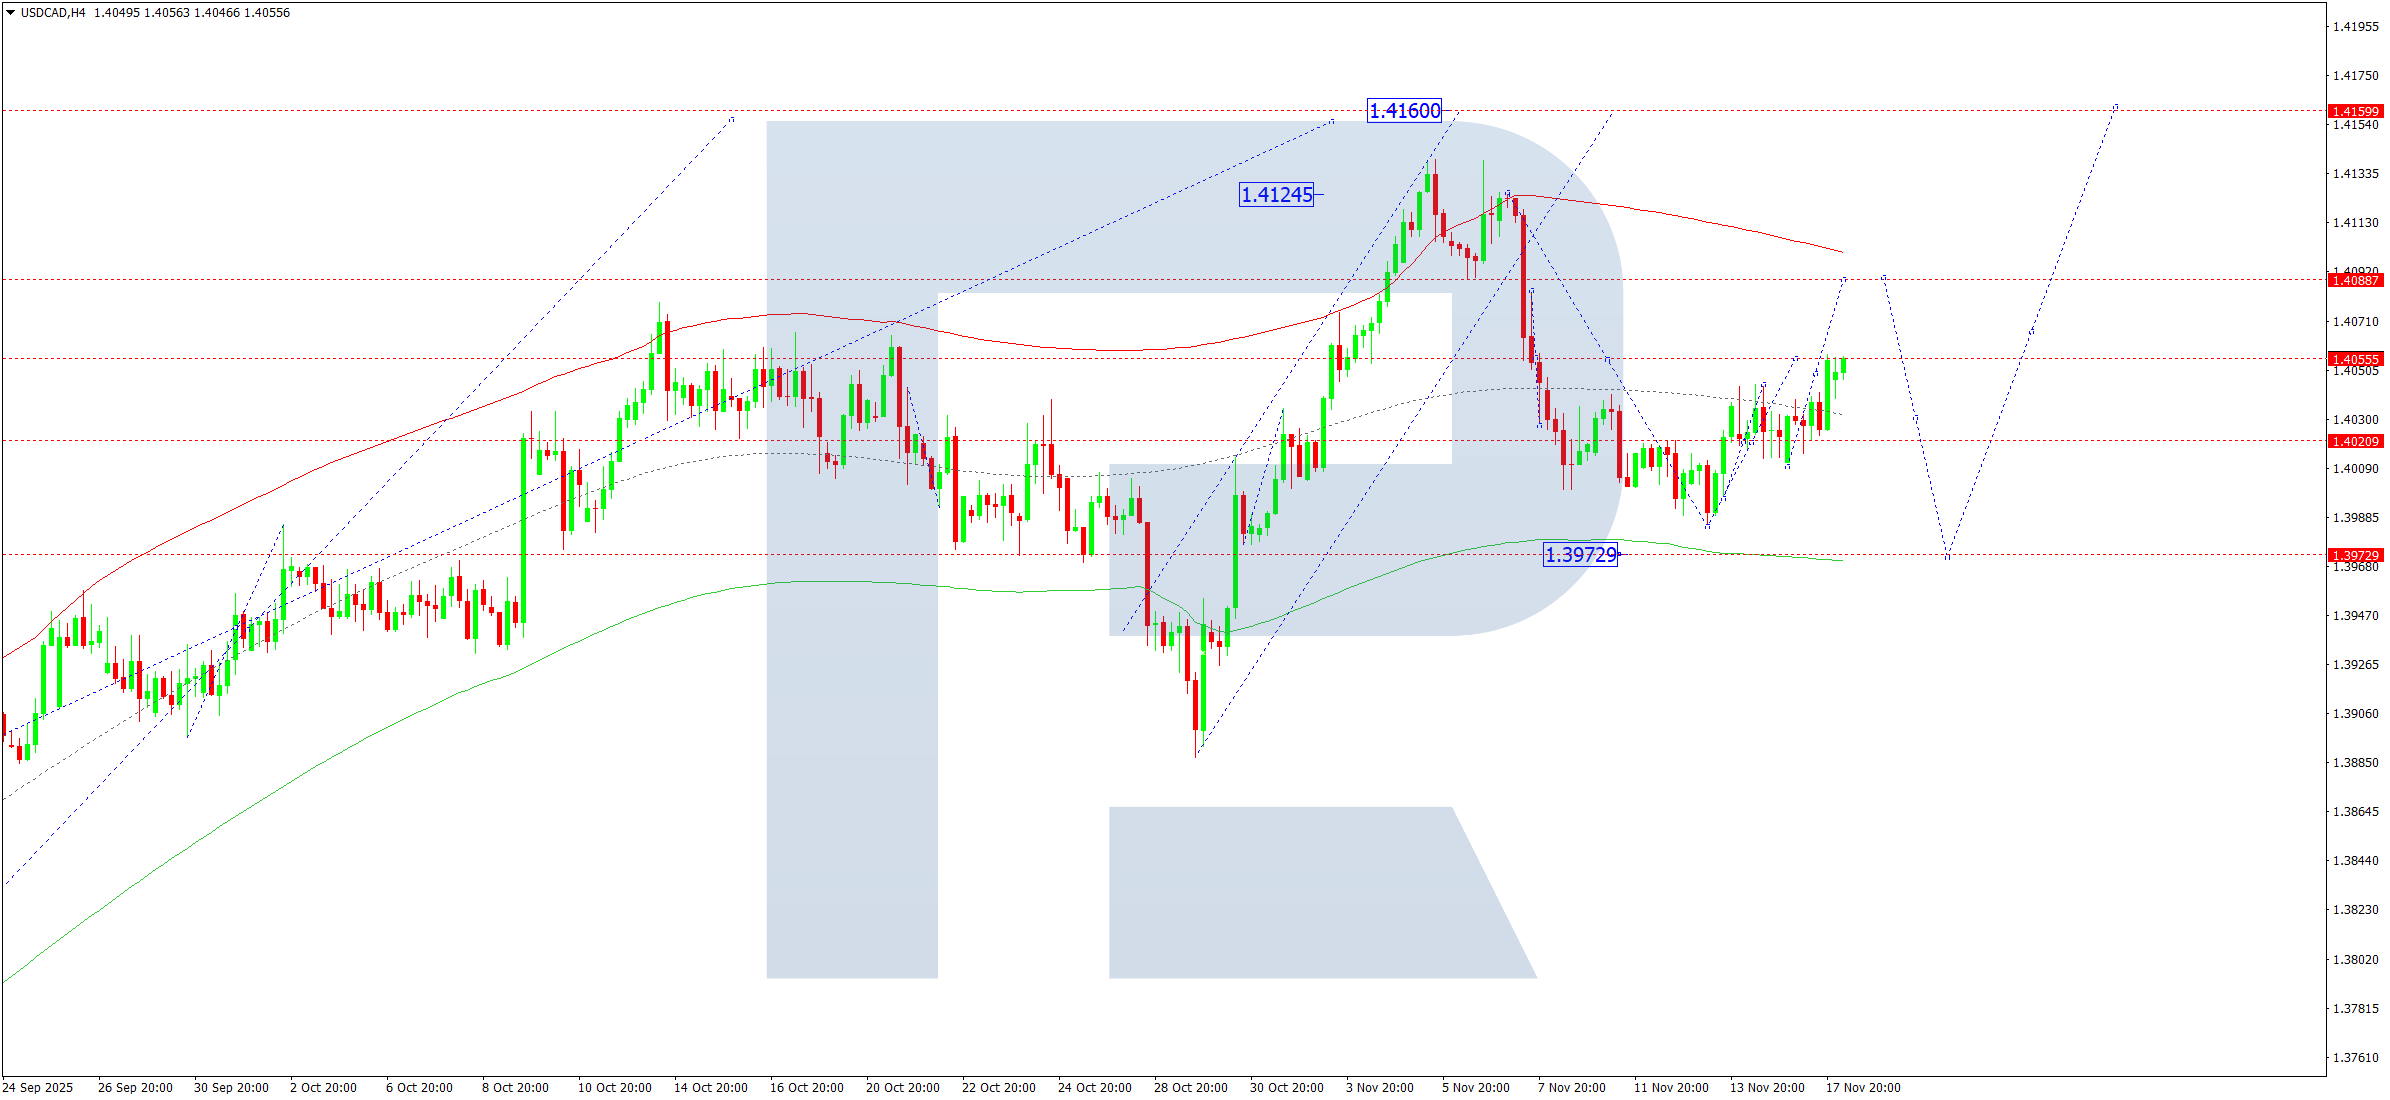
USDCAD continues to consolidate near 1.4055. The range may widen to 1.4088 on the upside and 1.3973 on the downside. A bullish breakout could lead to 1.4160, while a downward breakout could extend the correction to 1.3939 before another move higher toward 1.4160.
The Elliott Wave structure and upward-wave Matrix centred at 1.3939 support a bullish continuation. The current correction toward the Price Envelope’s lower boundary at 1.3973 appears to be nearing completion, with a subsequent rise toward 1.4160 expected.
Indicators favour continuation of the upward wave toward 1.4160.
XAUUSD (Gold) Forecast
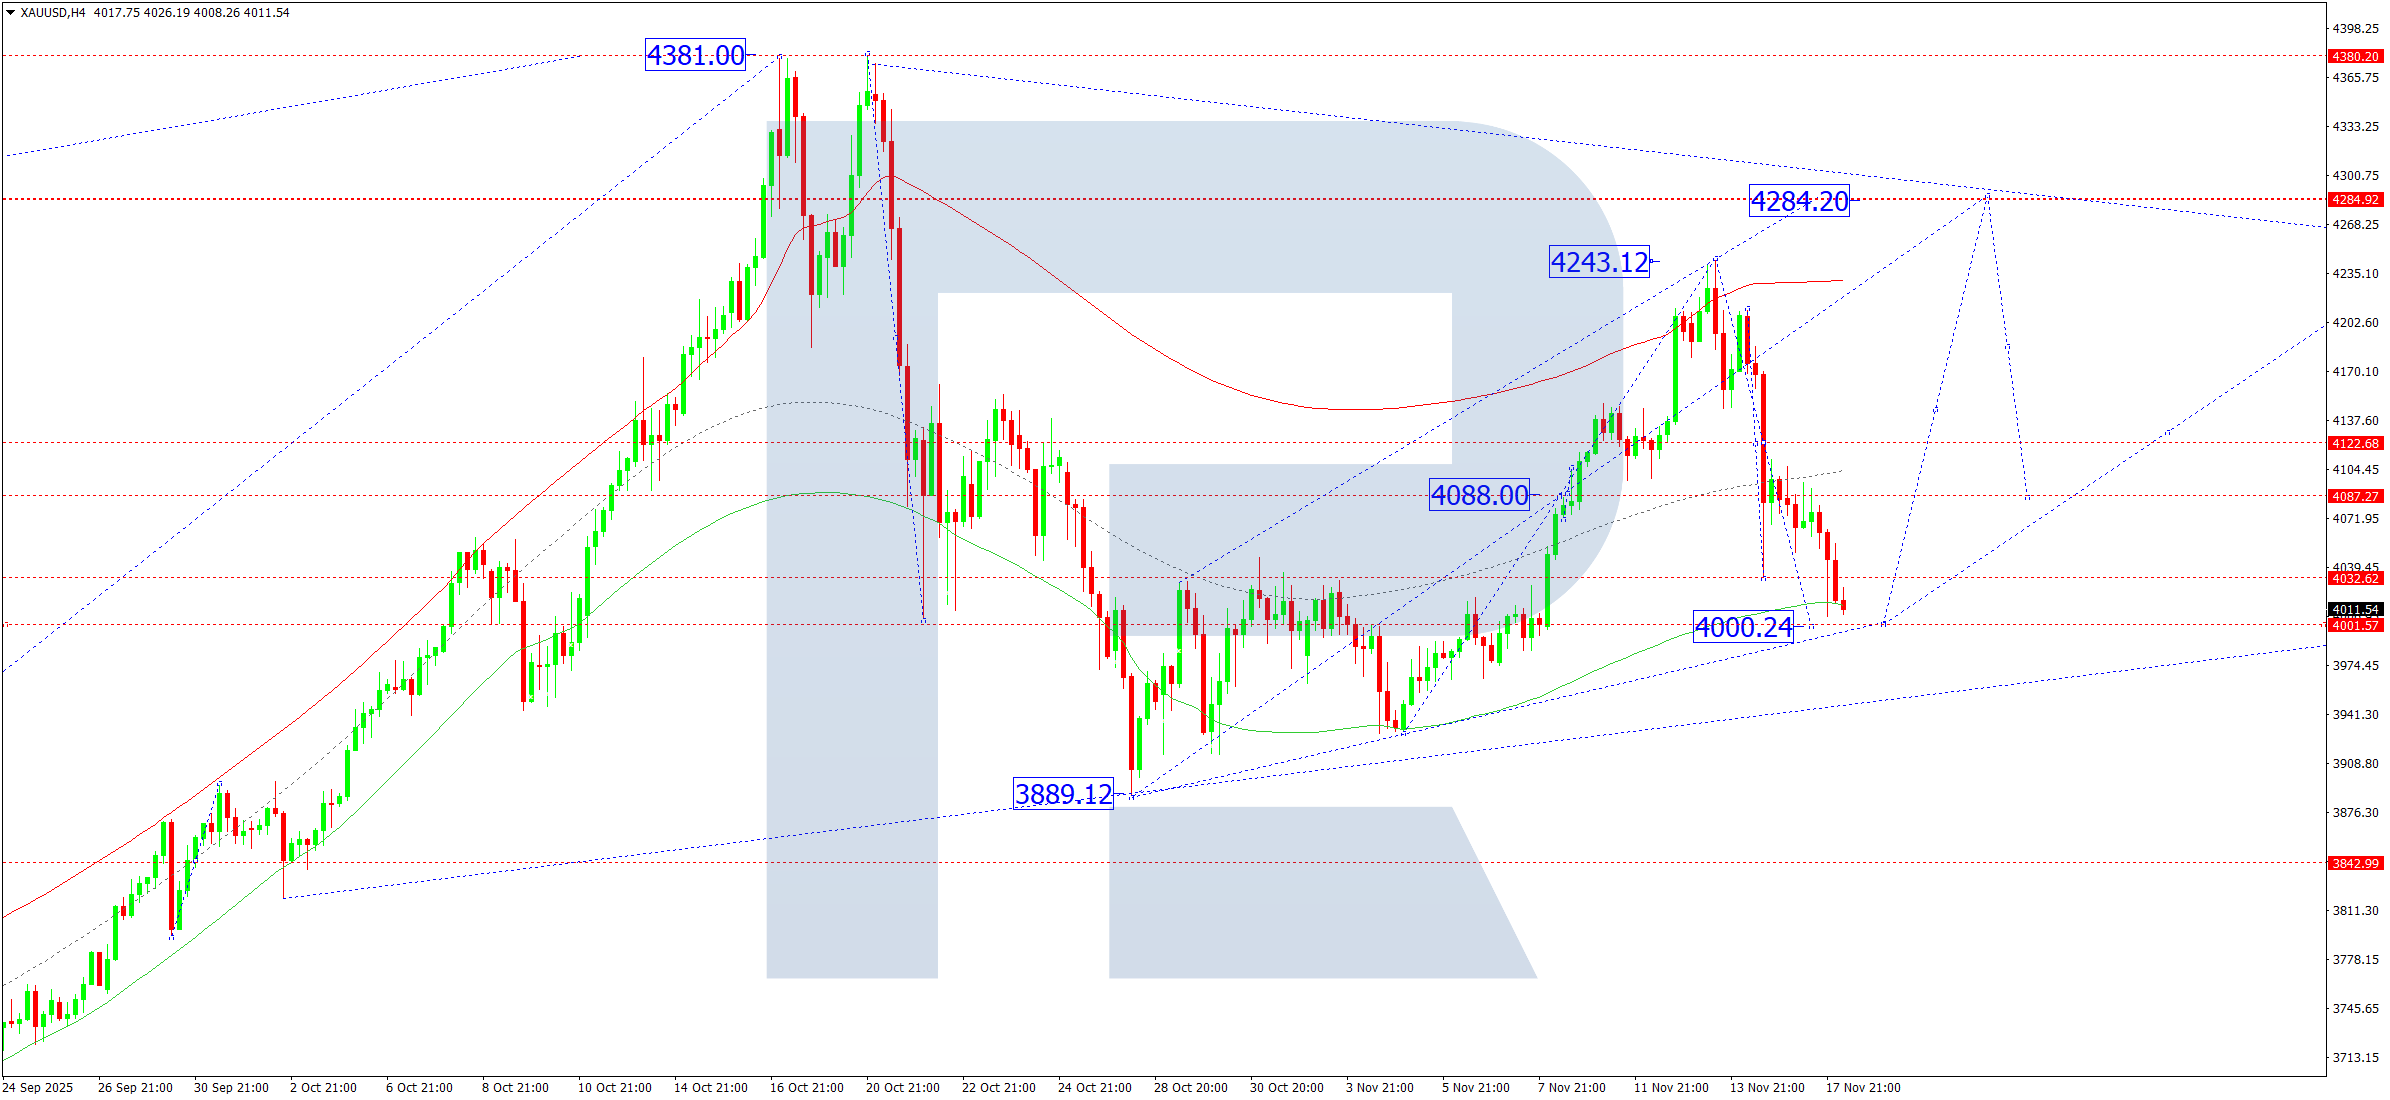
Gold continues its decline toward 4,000 on the H4 chart, a level expected to be reached today. A rebound to 4,133 may follow, forming a consolidation range. A breakout above this range could extend the rally toward 4,400, while a downside breakout could deepen the correction to 3,844.
Elliott Wave analysis and the upward-wave Matrix with a rotation centre at 4,088 confirm this structure. Price is currently moving toward the lower Price Envelope boundary at 4,000 before a projected rise to the central line at 4,133.
Indicators point to a dip toward 4,000, followed by upward movement toward 4,133 and 4,284.
Brent Crude Forecast
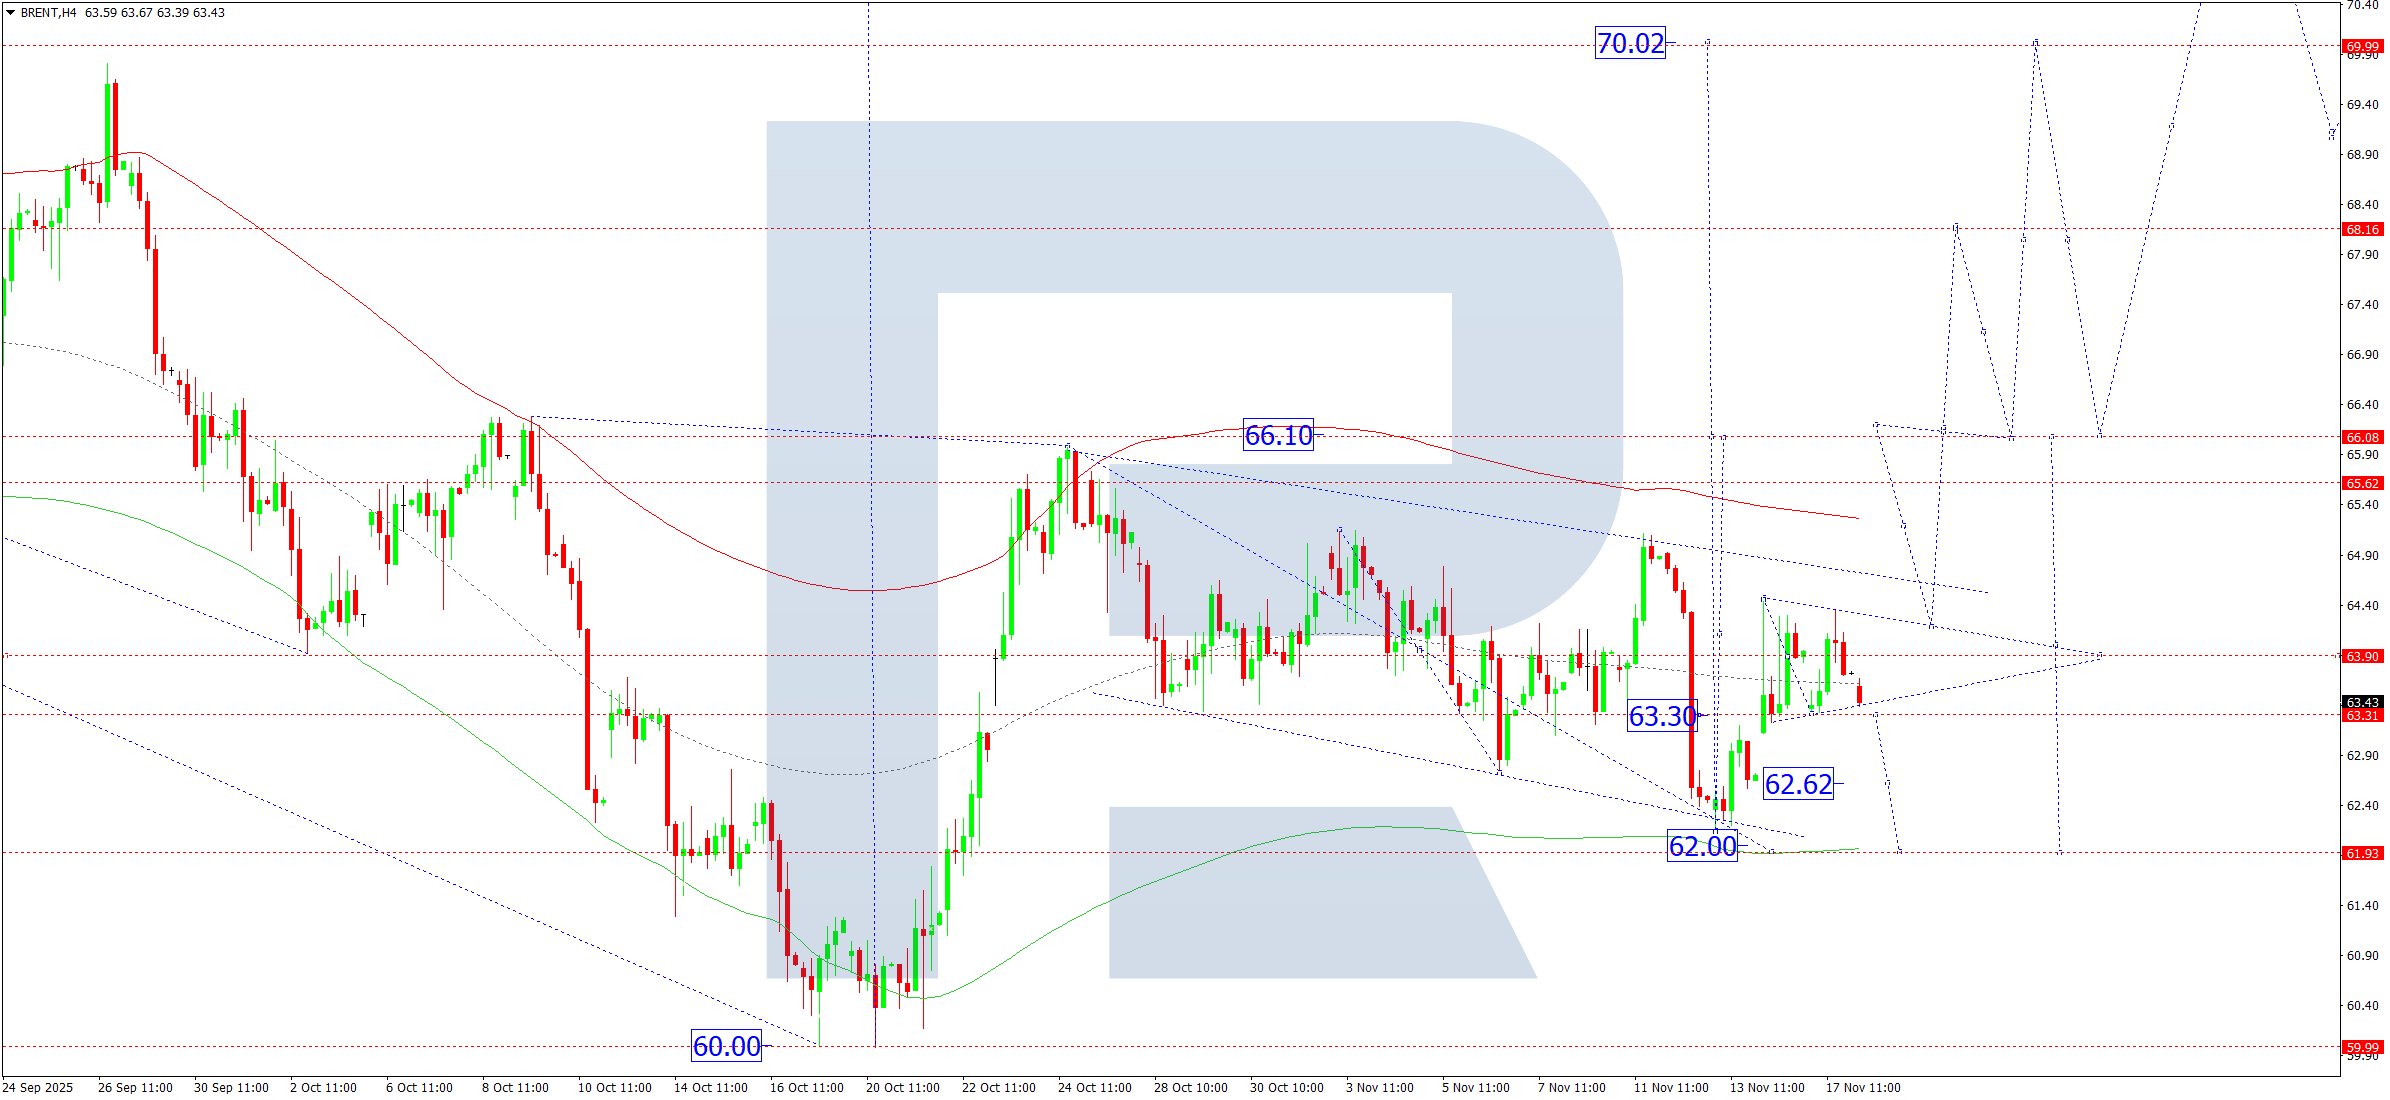
Brent is consolidating above 63.33 on the H4 chart. A downward breakout may trigger a decline toward 62.00, while an upward breakout could extend the bullish impulse to 66.10.
The Elliott Wave structure and upward-wave Matrix centred at 63.33 support this dual-scenario setup. Price remains within the Price Envelope’s central region, and a drop to 62.00 would likely complete the correction before a rise toward 66.10.
Indicators suggest the correction may end at 62.00, followed by a rally toward 66.10.
Risk Warning: Past trading performance does not guarantee future results.
Leave a Reply