
Daily Technical Analysis and Forecast — 19 November 2025
EURUSD Forecast
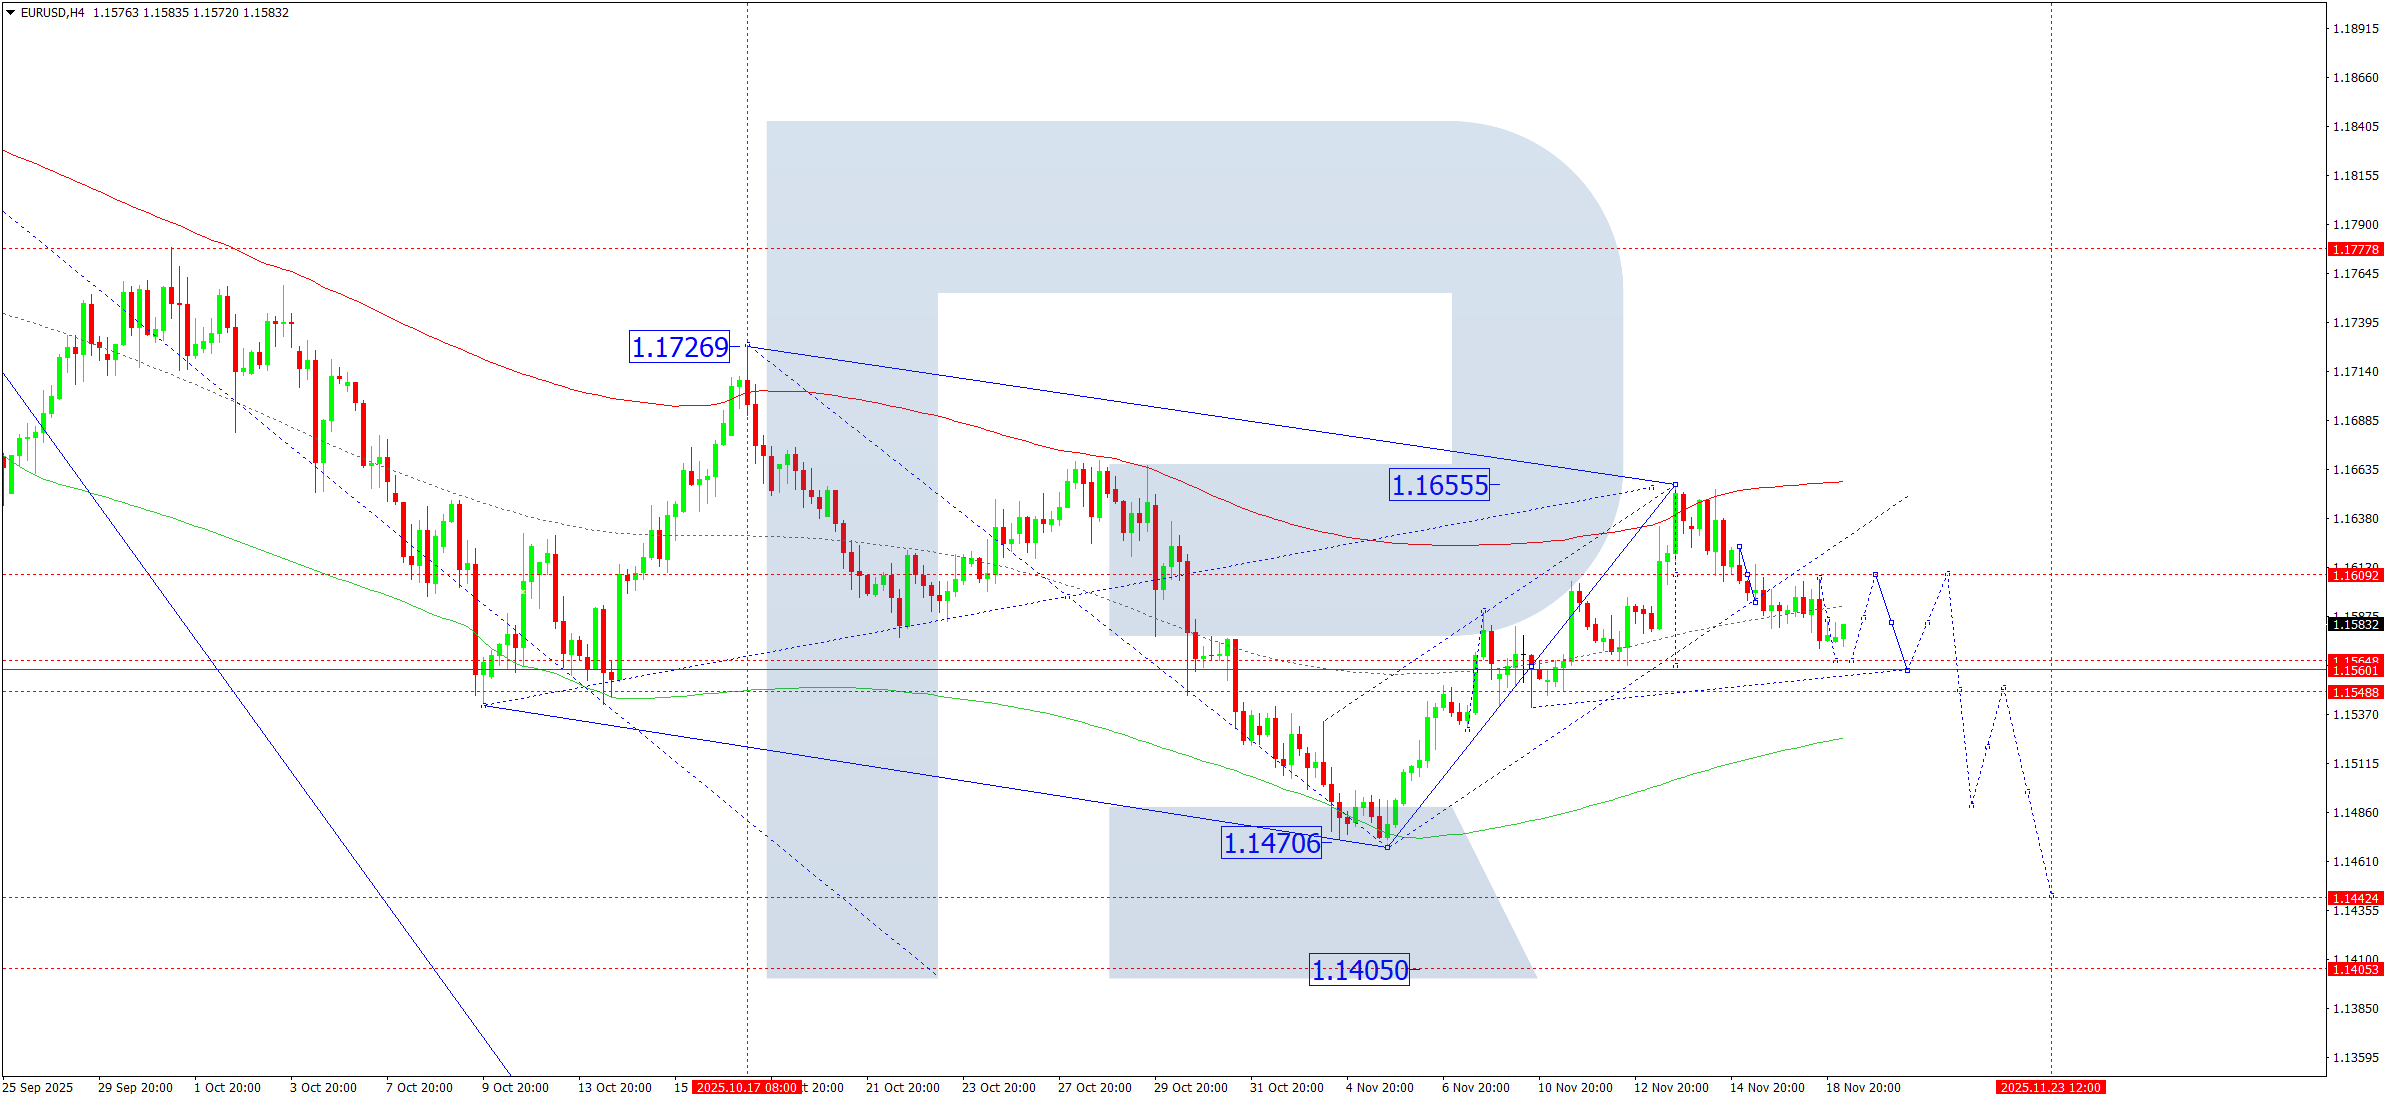
On the EURUSD H4 chart, the market has developed a narrow consolidation zone around 1.1608 and subsequently broke lower. The upward wave channel is nearly invalidated. As of 19 November 2025, part of the next bearish impulse toward 1.1570 has already formed, with price currently consolidating just above this level. The range may extend downward to 1.1565 and upward to 1.1600 before moving toward 1.1560, which serves as the initial target within the broader decline toward 1.1405.
The Elliott wave pattern and the downward wave matrix, anchored by a pivot at 1.1660, support this view. The pair is trending toward the central line of the Price Envelope near 1.1560. A dip to this level followed by a corrective bounce toward 1.1606 is possible. Thereafter, the bearish leg may continue toward the lower Price Envelope boundary at 1.1515, with potential extension to 1.1405.
Technical indicators for today signal a decline toward 1.1560.
Risk Warning: Past trading results do not guarantee future performance.
USDJPY Forecast
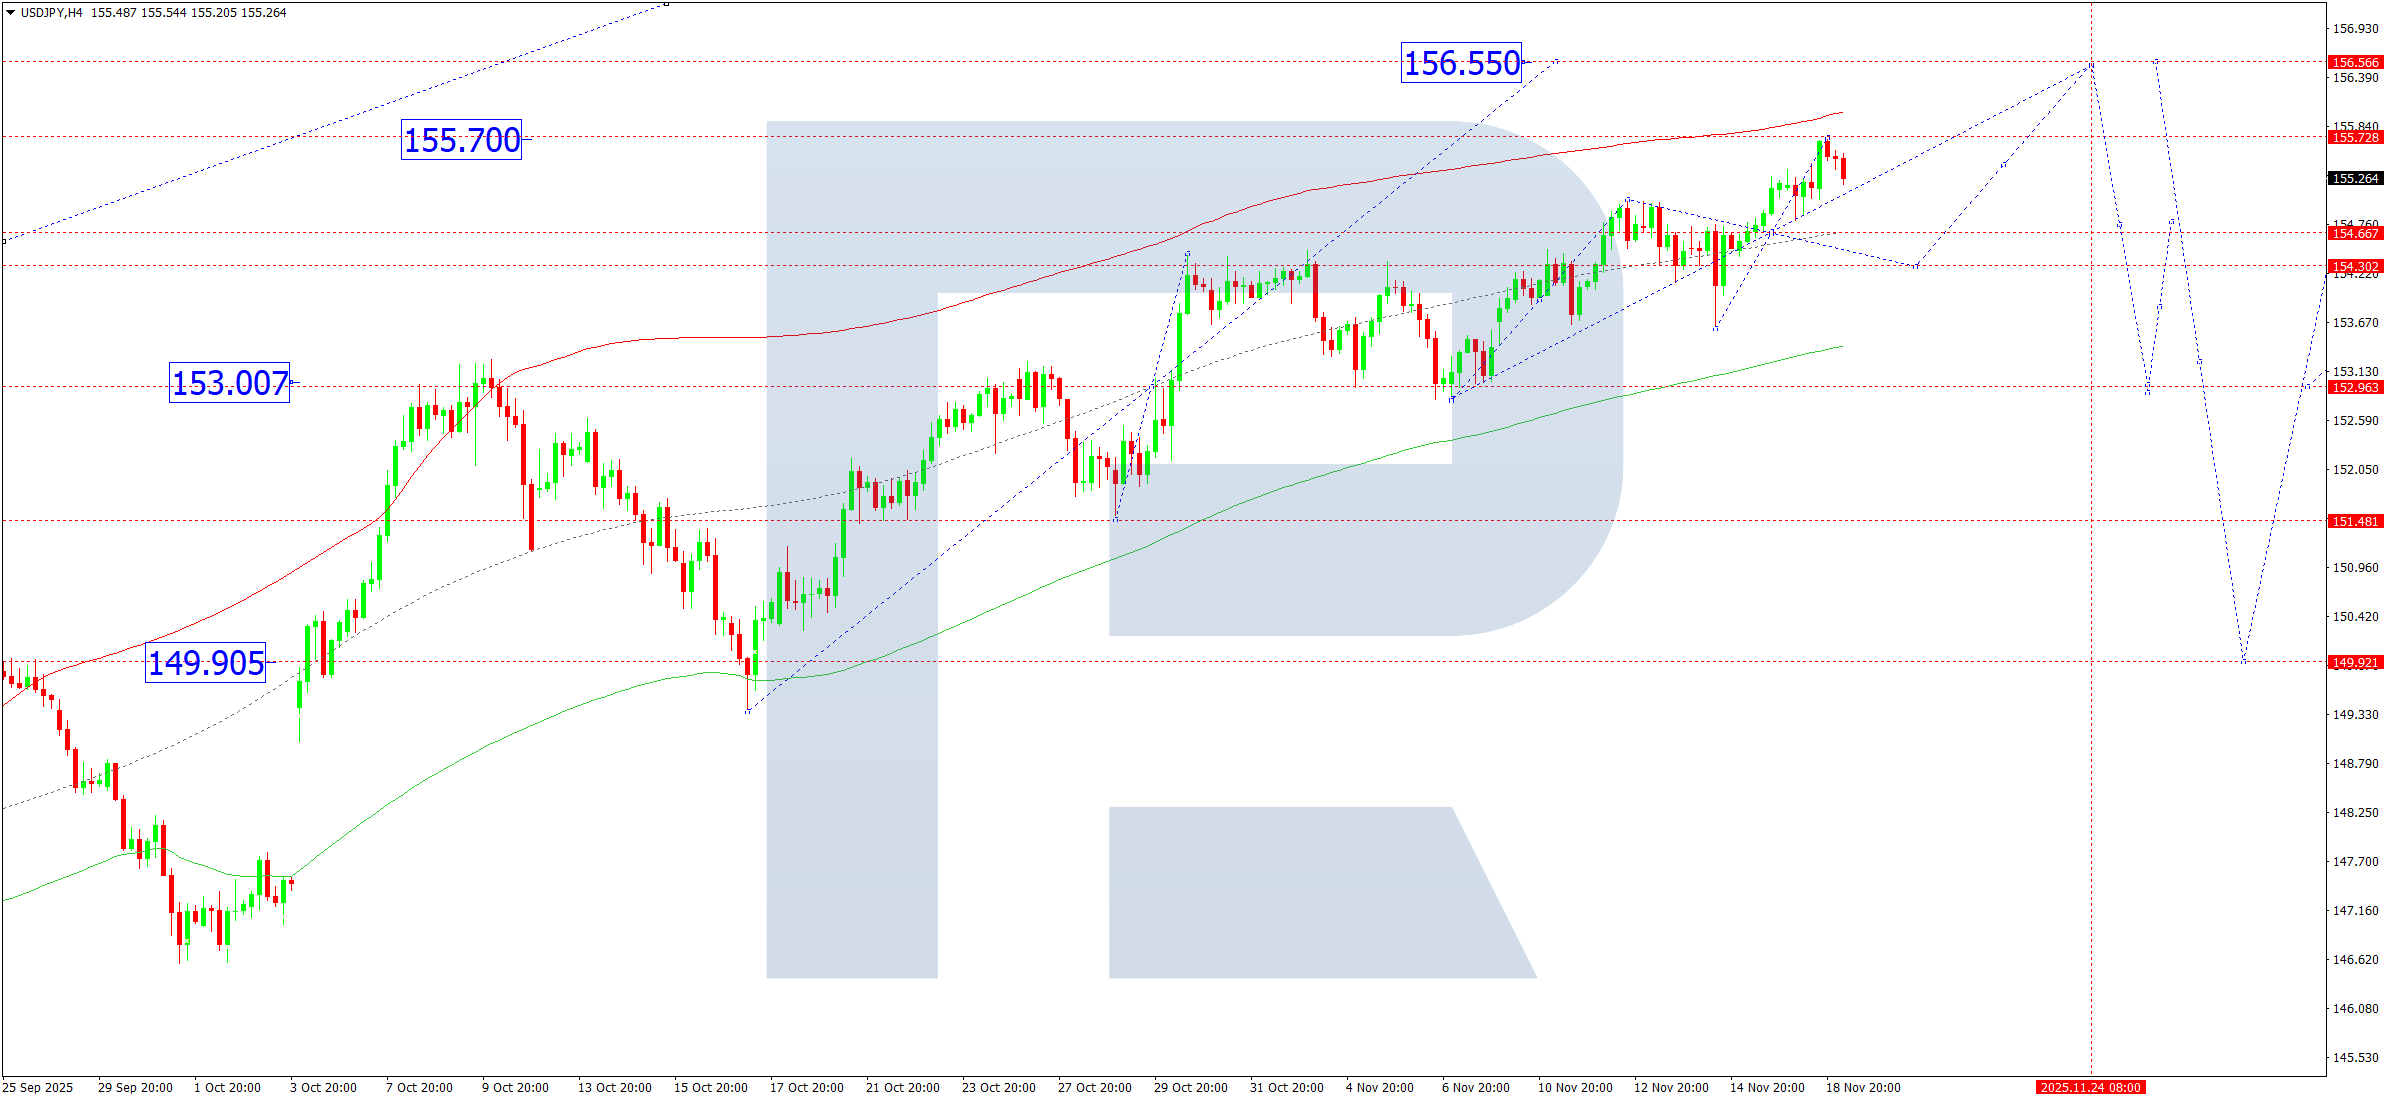
On the USDJPY H4 chart, the market has completed an upward move to 155.70. On 19 November 2025, a tight consolidation range is likely to form below this level. A downside breakout would initiate a correction toward 154.66. Afterward, a renewed rise toward 156.55 may occur as a local target, followed later by a possible pullback toward 153.00.
The Elliott wave structure and upward wave matrix (pivot at 153.00) reinforce this scenario. A corrective move toward the central Price Envelope line at 154.66 is expected, followed by a potential continuation toward the upper boundary at 156.55.
Technical indicators suggest a dip to 154.66 followed by a rise toward 156.55.
Risk Warning: Past trading results do not guarantee future performance.
GBPUSD Forecast
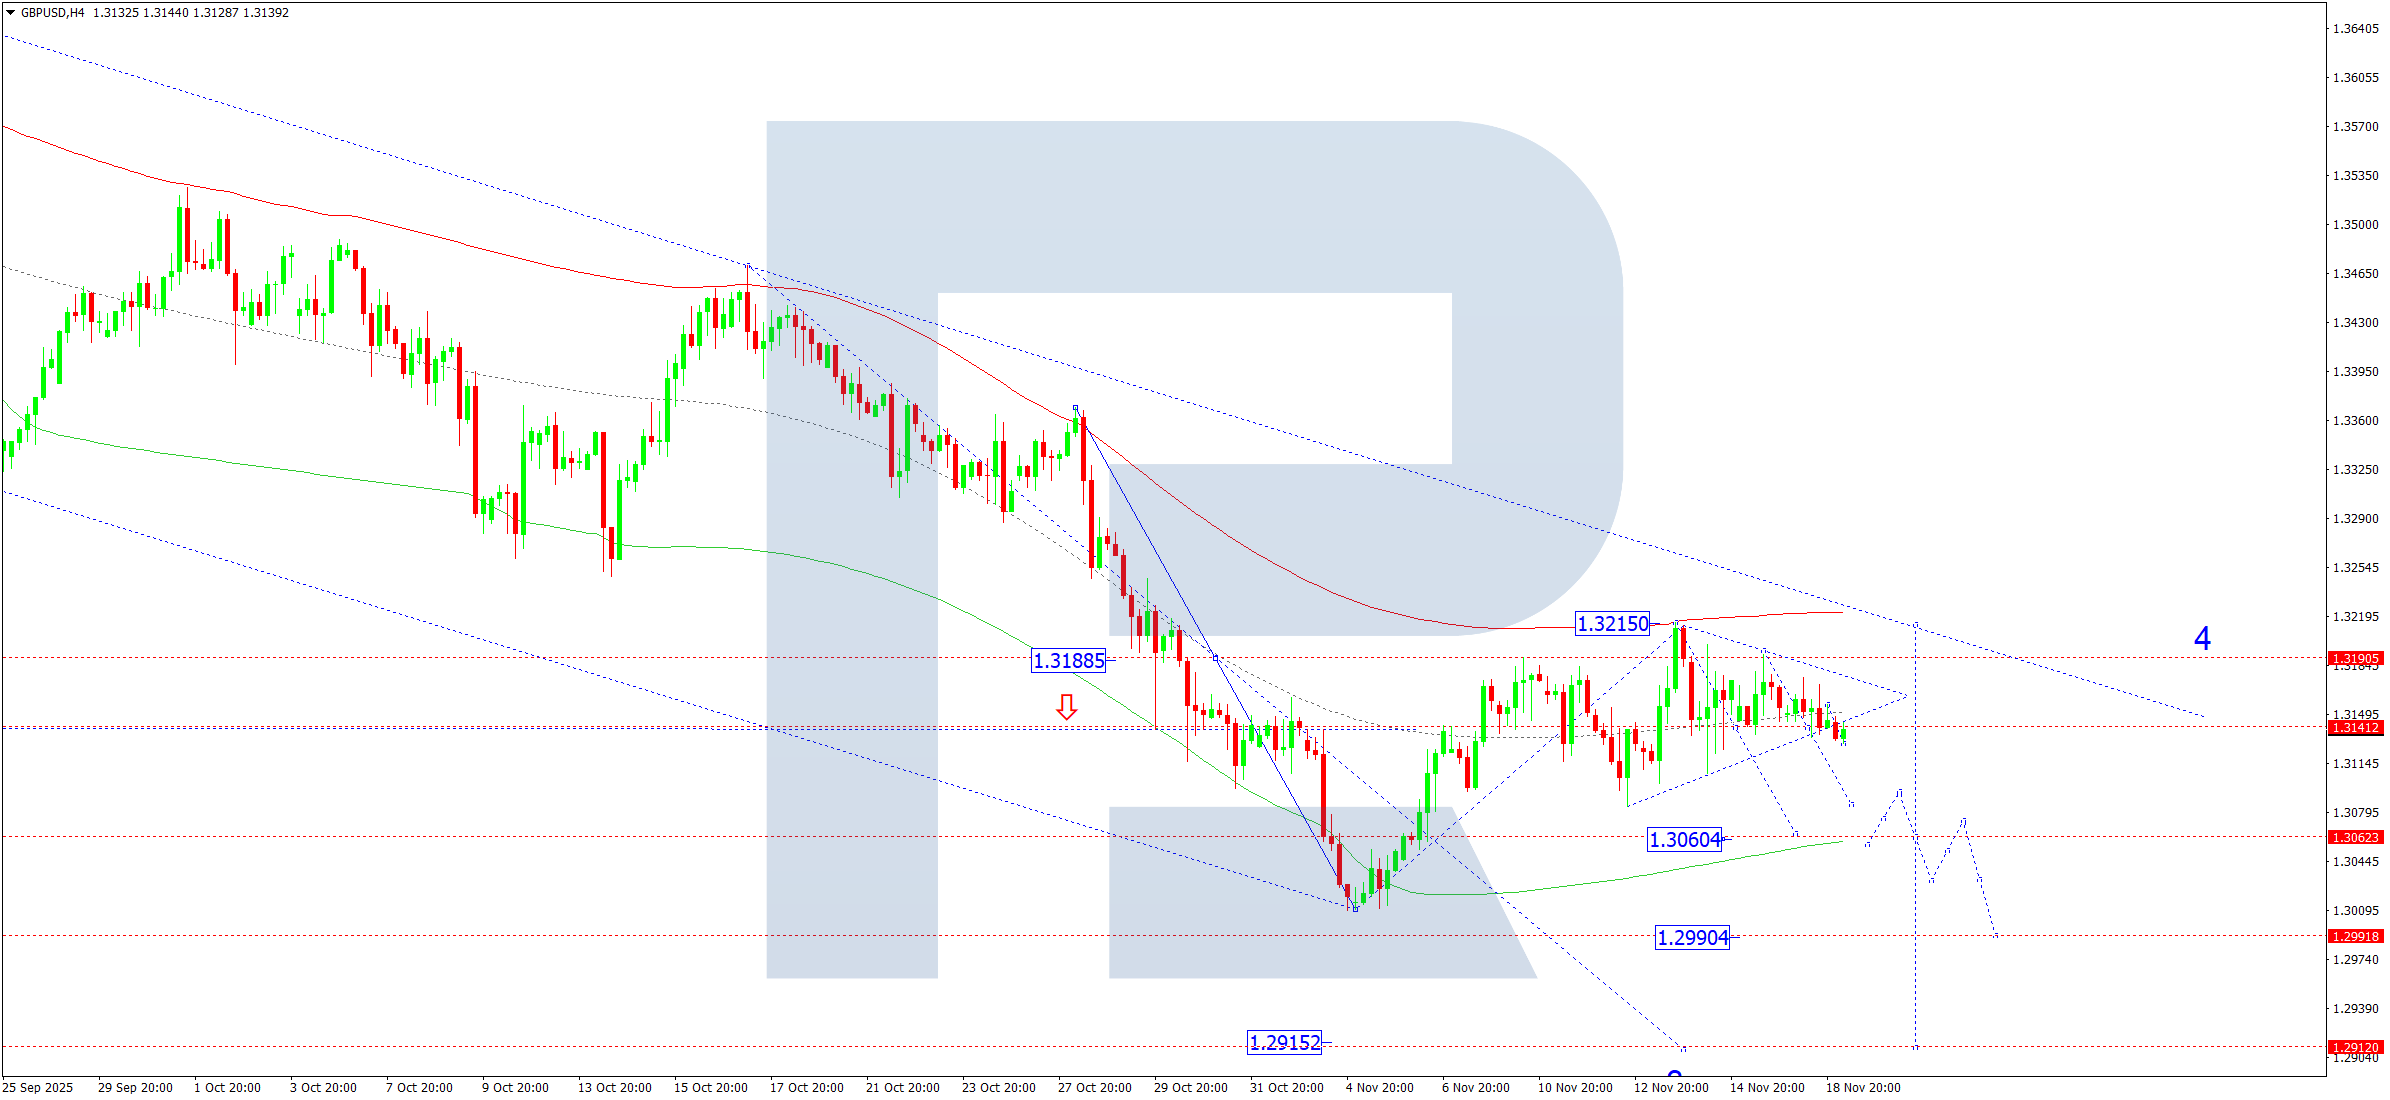
On the GBPUSD H4 chart, the pair is still forming a consolidation band around 1.3140. A downward breakout is expected on 19 November 2025, initiating a new bearish impulse toward 1.3060. A breakdown below this level opens the way for continuation toward 1.2990, with a possible extension to 1.2915.
The Elliott wave framework and downward wave matrix (pivot at 1.3188) validate this bias. The market recently completed a corrective upswing toward the upper Price Envelope boundary at 1.3215, tested from below. Today, the downward wave may extend toward the lower boundary at 1.3060.
Technical indicators point to the start of a downward move toward 1.3060.
Risk Warning: Past trading results do not guarantee future performance.
AUDUSD Forecast
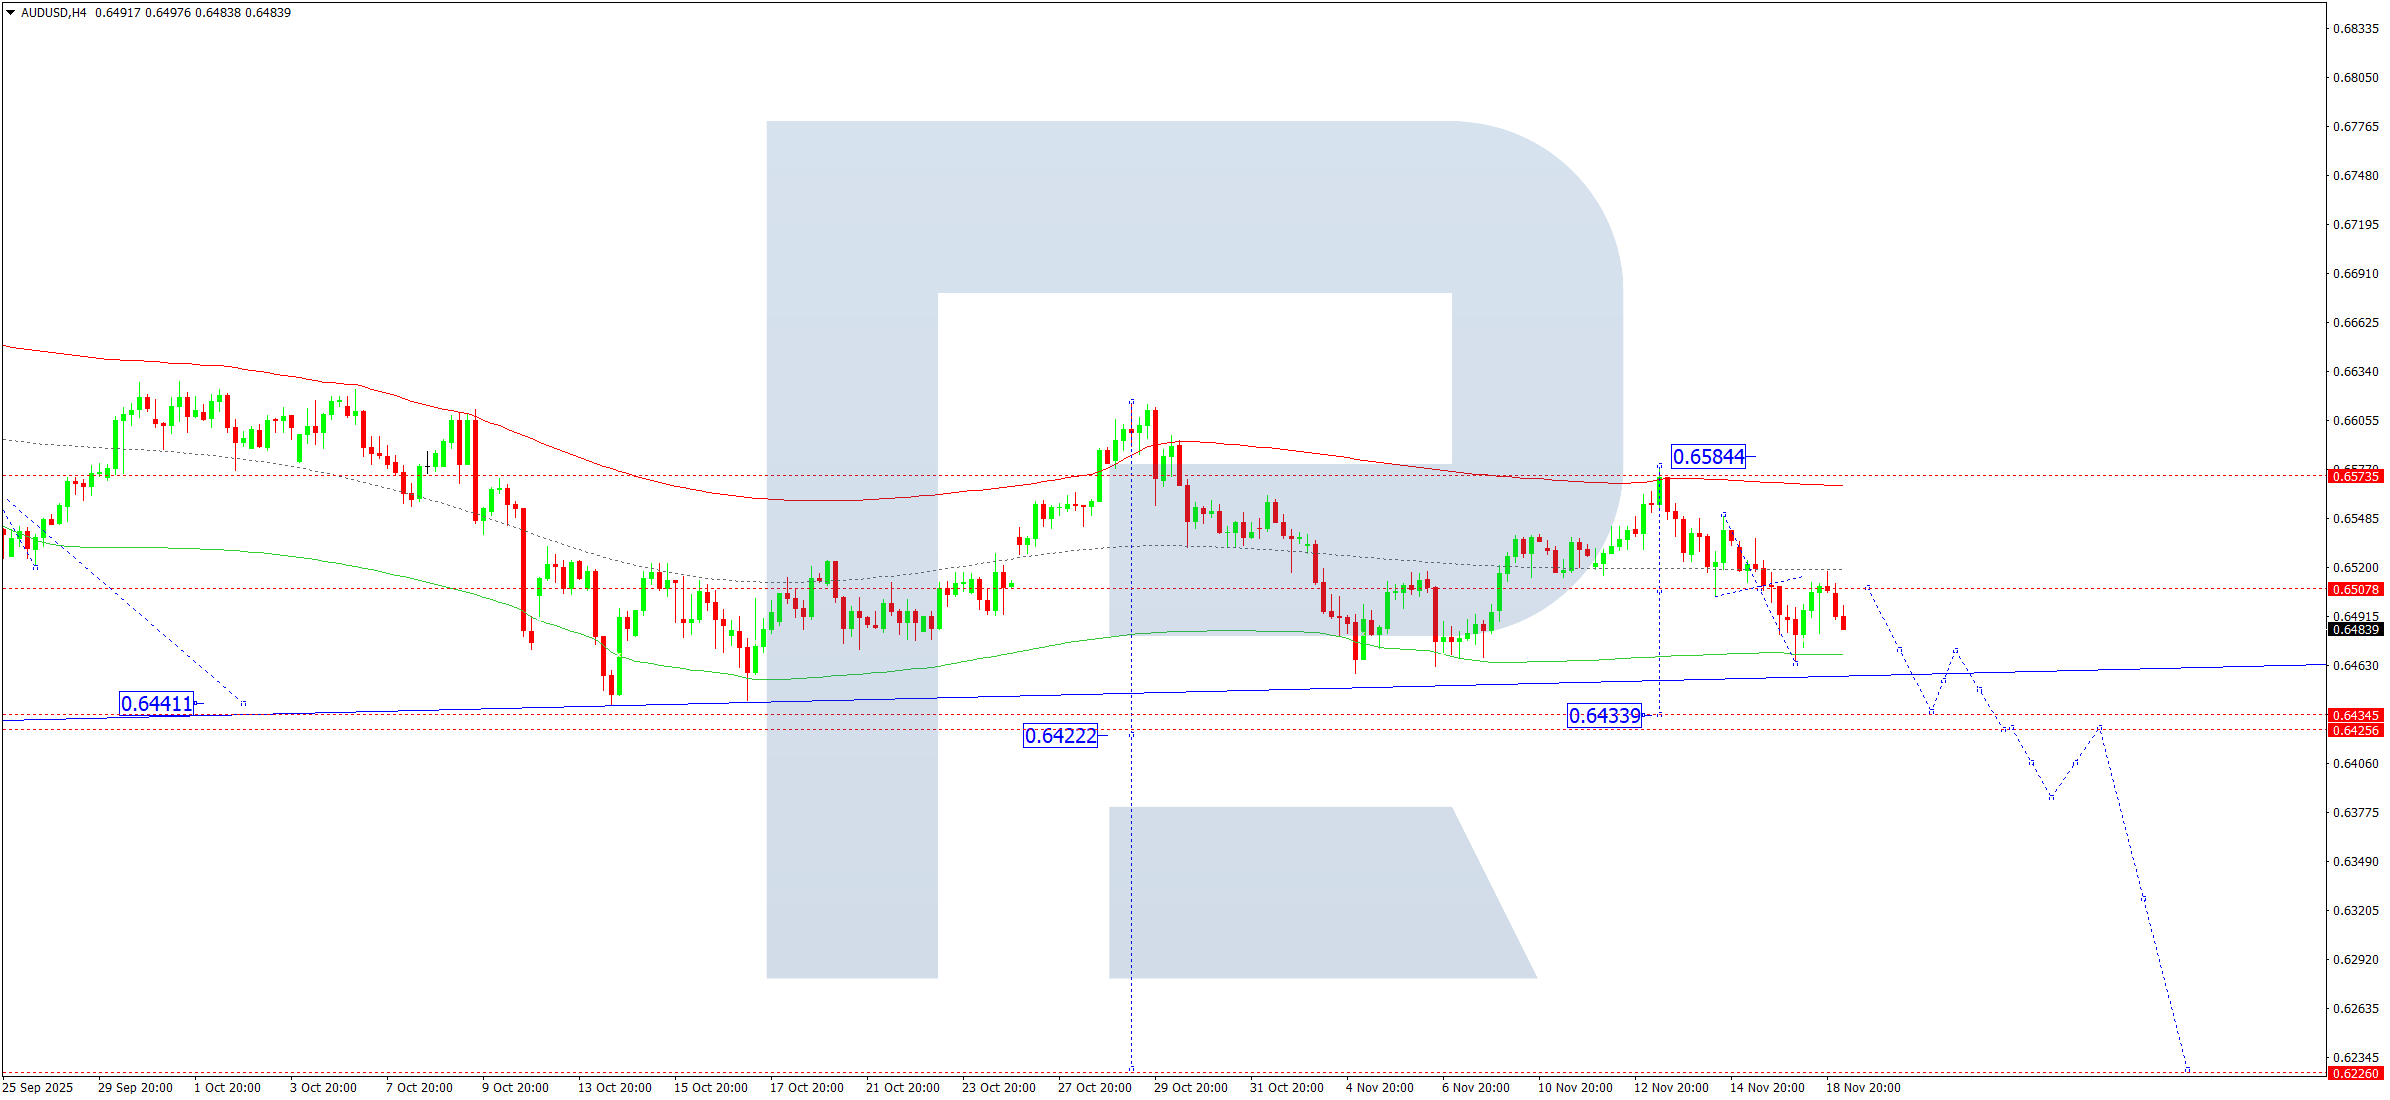
On the AUDUSD H4 chart, a correction has completed at 0.6560. The downward move is now progressing toward 0.6434, the next local target for 19 November 2025. A consolidation range may form around this level. A downward breakout would activate the third bearish wave toward 0.6222.
The Elliott wave model and downward wave matrix (pivot 0.6570) support this outlook. The correction reached the upper Price Envelope boundary at 0.6584, and today’s expectation includes a continuation down to the lower boundary at 0.6434.
Technical indicators suggest continued bearish movement toward 0.6434.
Risk Warning: Past trading results do not guarantee future performance.
USDCAD Forecast
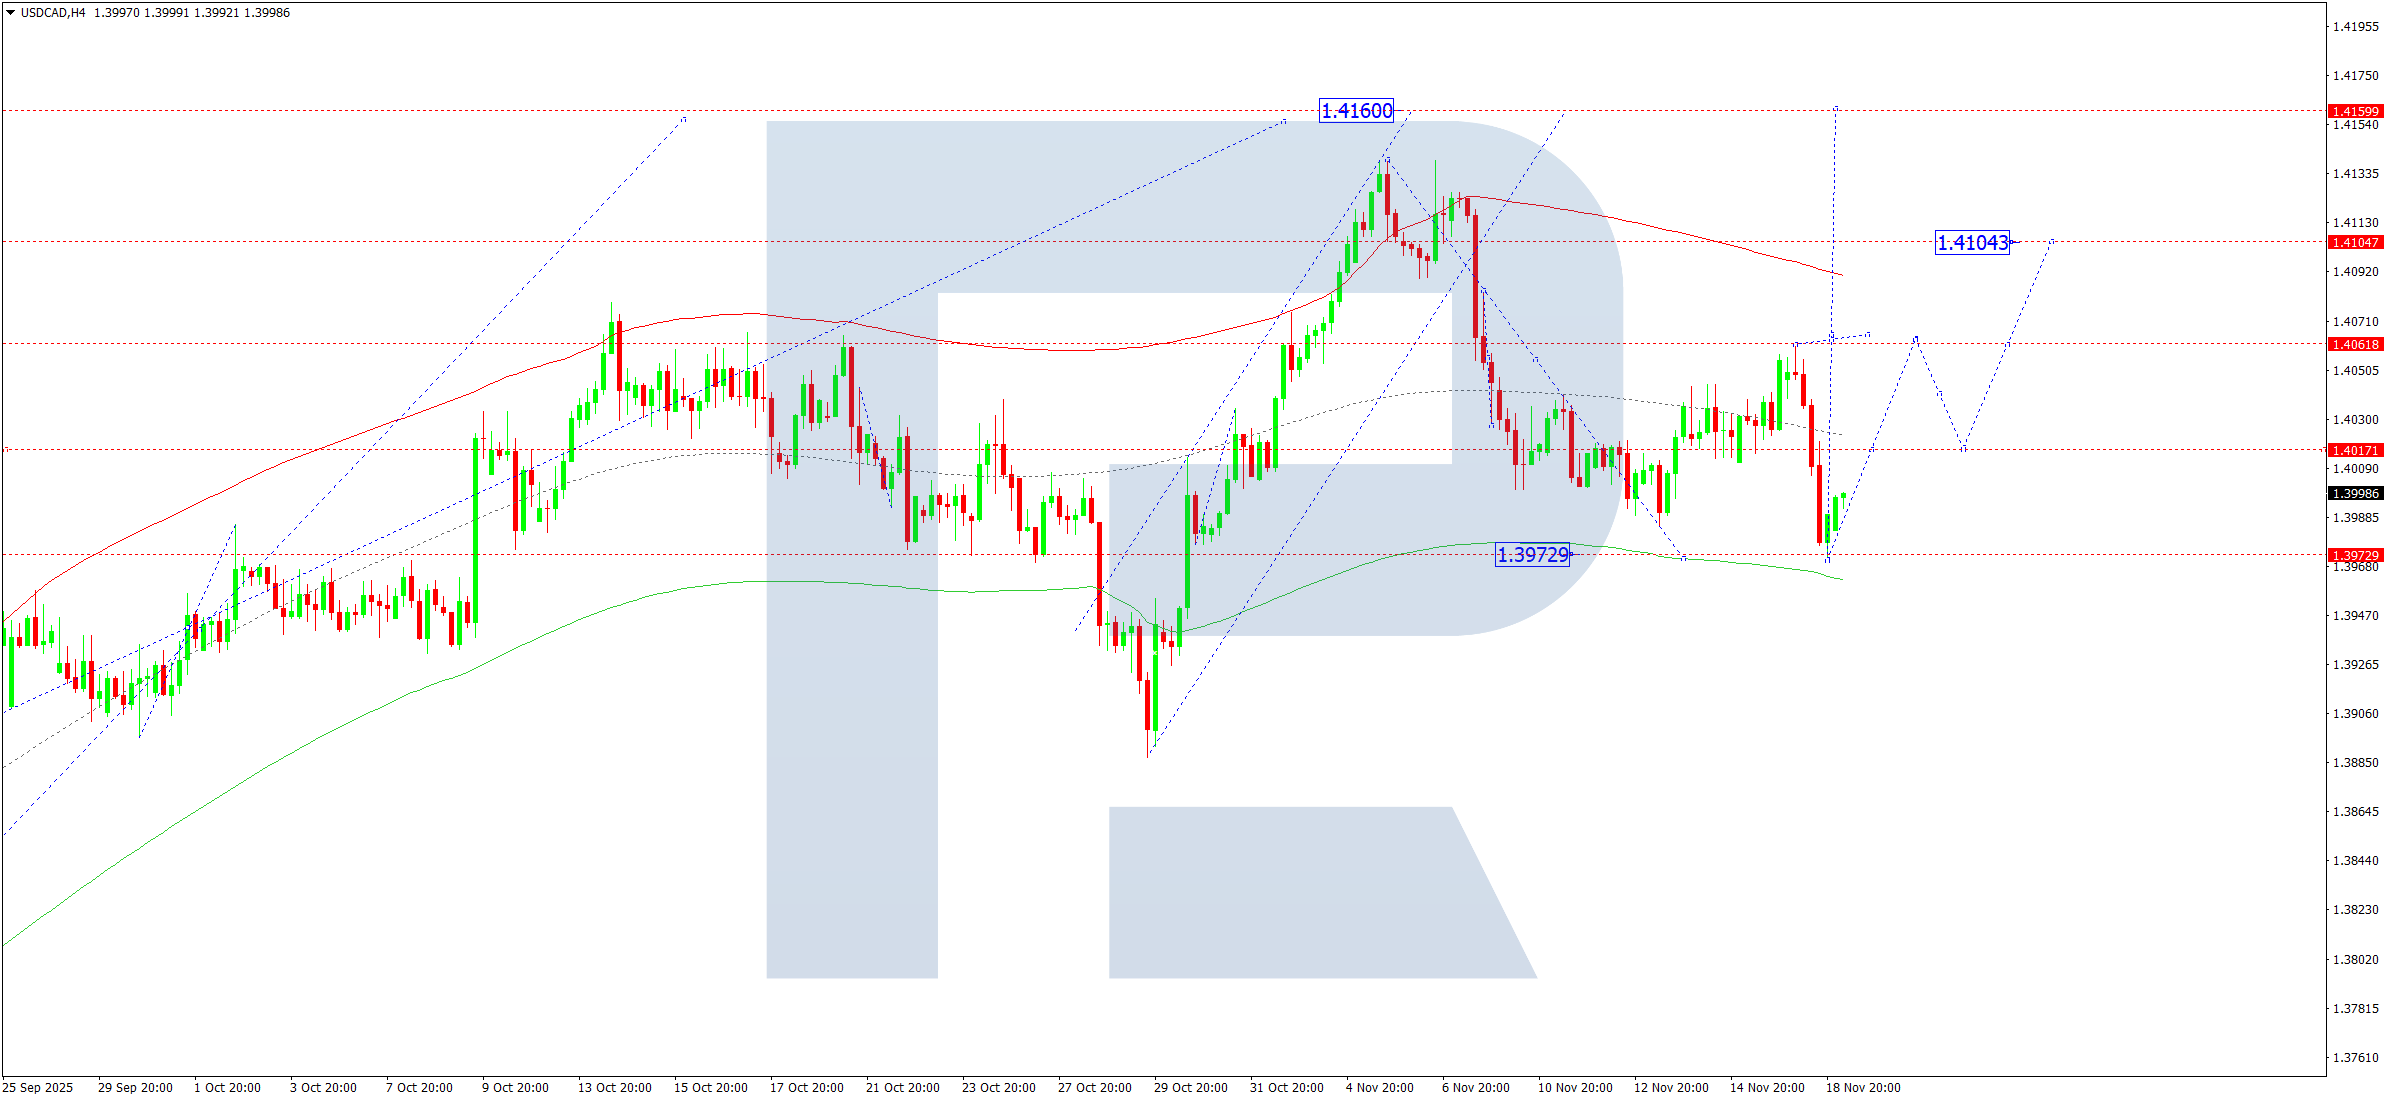
On the USDCAD H4 chart, the market has completed a decline to 1.3970. For 19 November 2025, a rising wave toward 1.4017 may begin. A breakout above this level opens the path toward 1.4062, marking the first target within the larger uptrend toward 1.4160.
The Elliott wave structure and upward wave matrix (pivot 1.3939) support this scenario. Price is still correcting near the lower Price Envelope boundary at 1.3973, with today’s outlook favoring the beginning of an upward move toward the upper boundary at 1.4160.
Technical indicators favor continued upward movement toward 1.4160.
Risk Warning: Past trading results do not guarantee future performance.
XAUUSD (Gold) Forecast
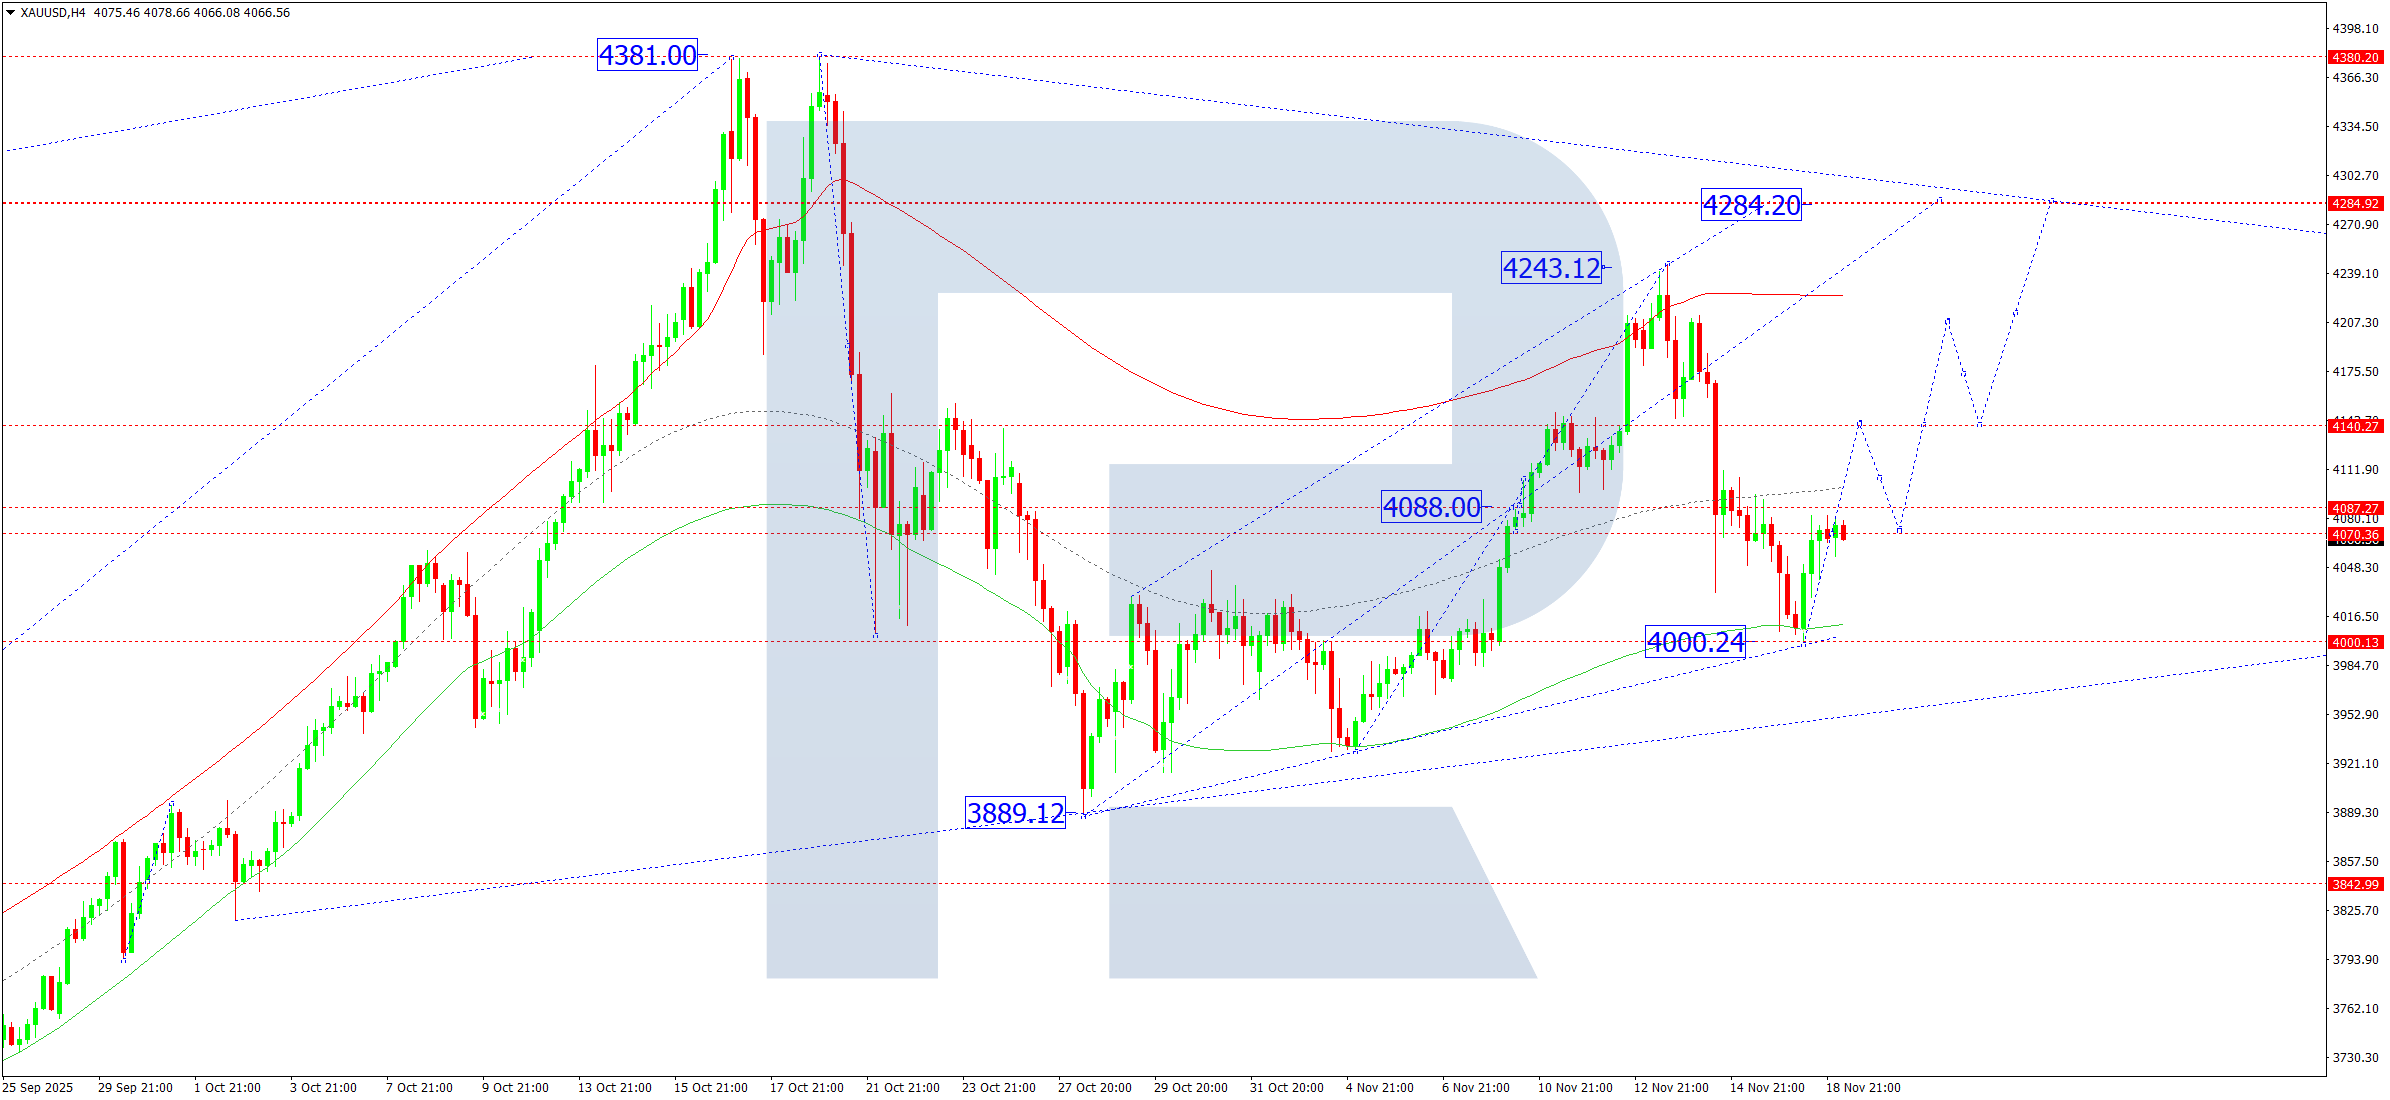
On the XAUUSD H4 chart, an upward impulse has reached 4,070. For 19 November 2025, a compact consolidation phase may develop near this level. A bullish breakout would enable continuation toward 4,140, the next target within the rising wave toward 4,284.
The Elliott wave model and upward wave matrix (pivot 4,088) confirm this scenario. The market is now forming the fifth upward wave toward the upper Price Envelope boundary at 4,284.
Technical indicators suggest an upward sequence toward 4,140, 4,208, and 4,284.
Risk Warning: Past trading results do not guarantee future performance.
Brent Forecast
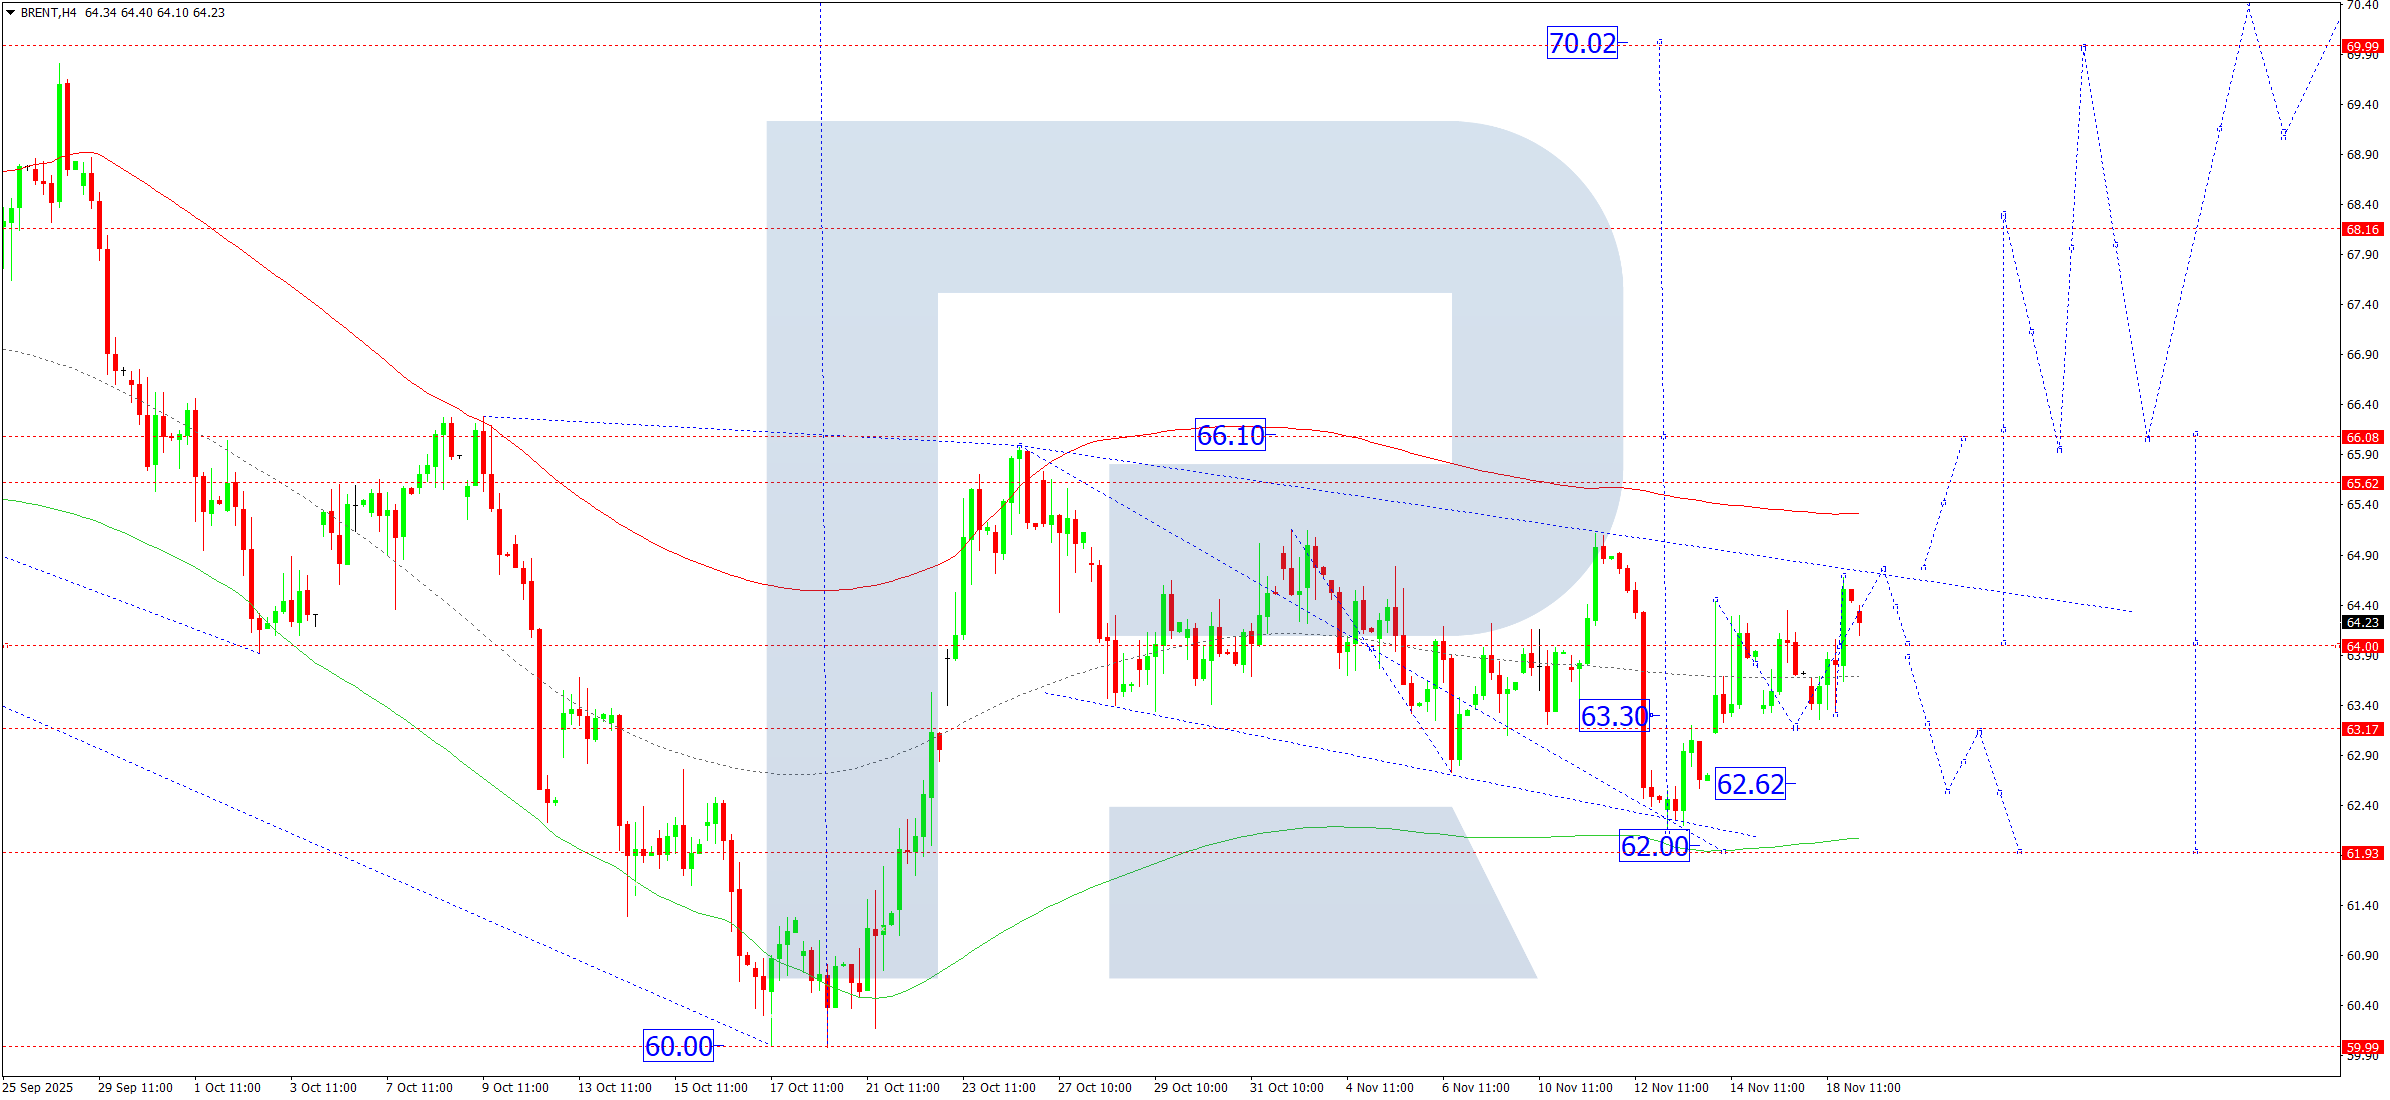
On the Brent H4 chart, the market is consolidating above 64.00. On 19 November 2025, this range may extend upward to 64.75. A breakout to the upside would indicate continuation toward 66.10, with potential to advance further toward 70.00. A downside breakout leaves room for another corrective dip toward 62.00, after which the upward trend toward 70.00 may resume.
The Elliott wave structure and upward wave matrix (pivot 64.00) support this outlook. Price is consolidating near the central Price Envelope line at 64.00. A downward breakout suggests a move toward 62.00, while an upward breakout favors a rise toward 66.10.
Technical indicators for today lean toward an upward move toward 66.10.
Risk Warning: Past trading results do not guarantee future performance.
Leave a Reply