
Daily Technical Analysis and Forecast – 20 November 2025
EURUSD Forecast
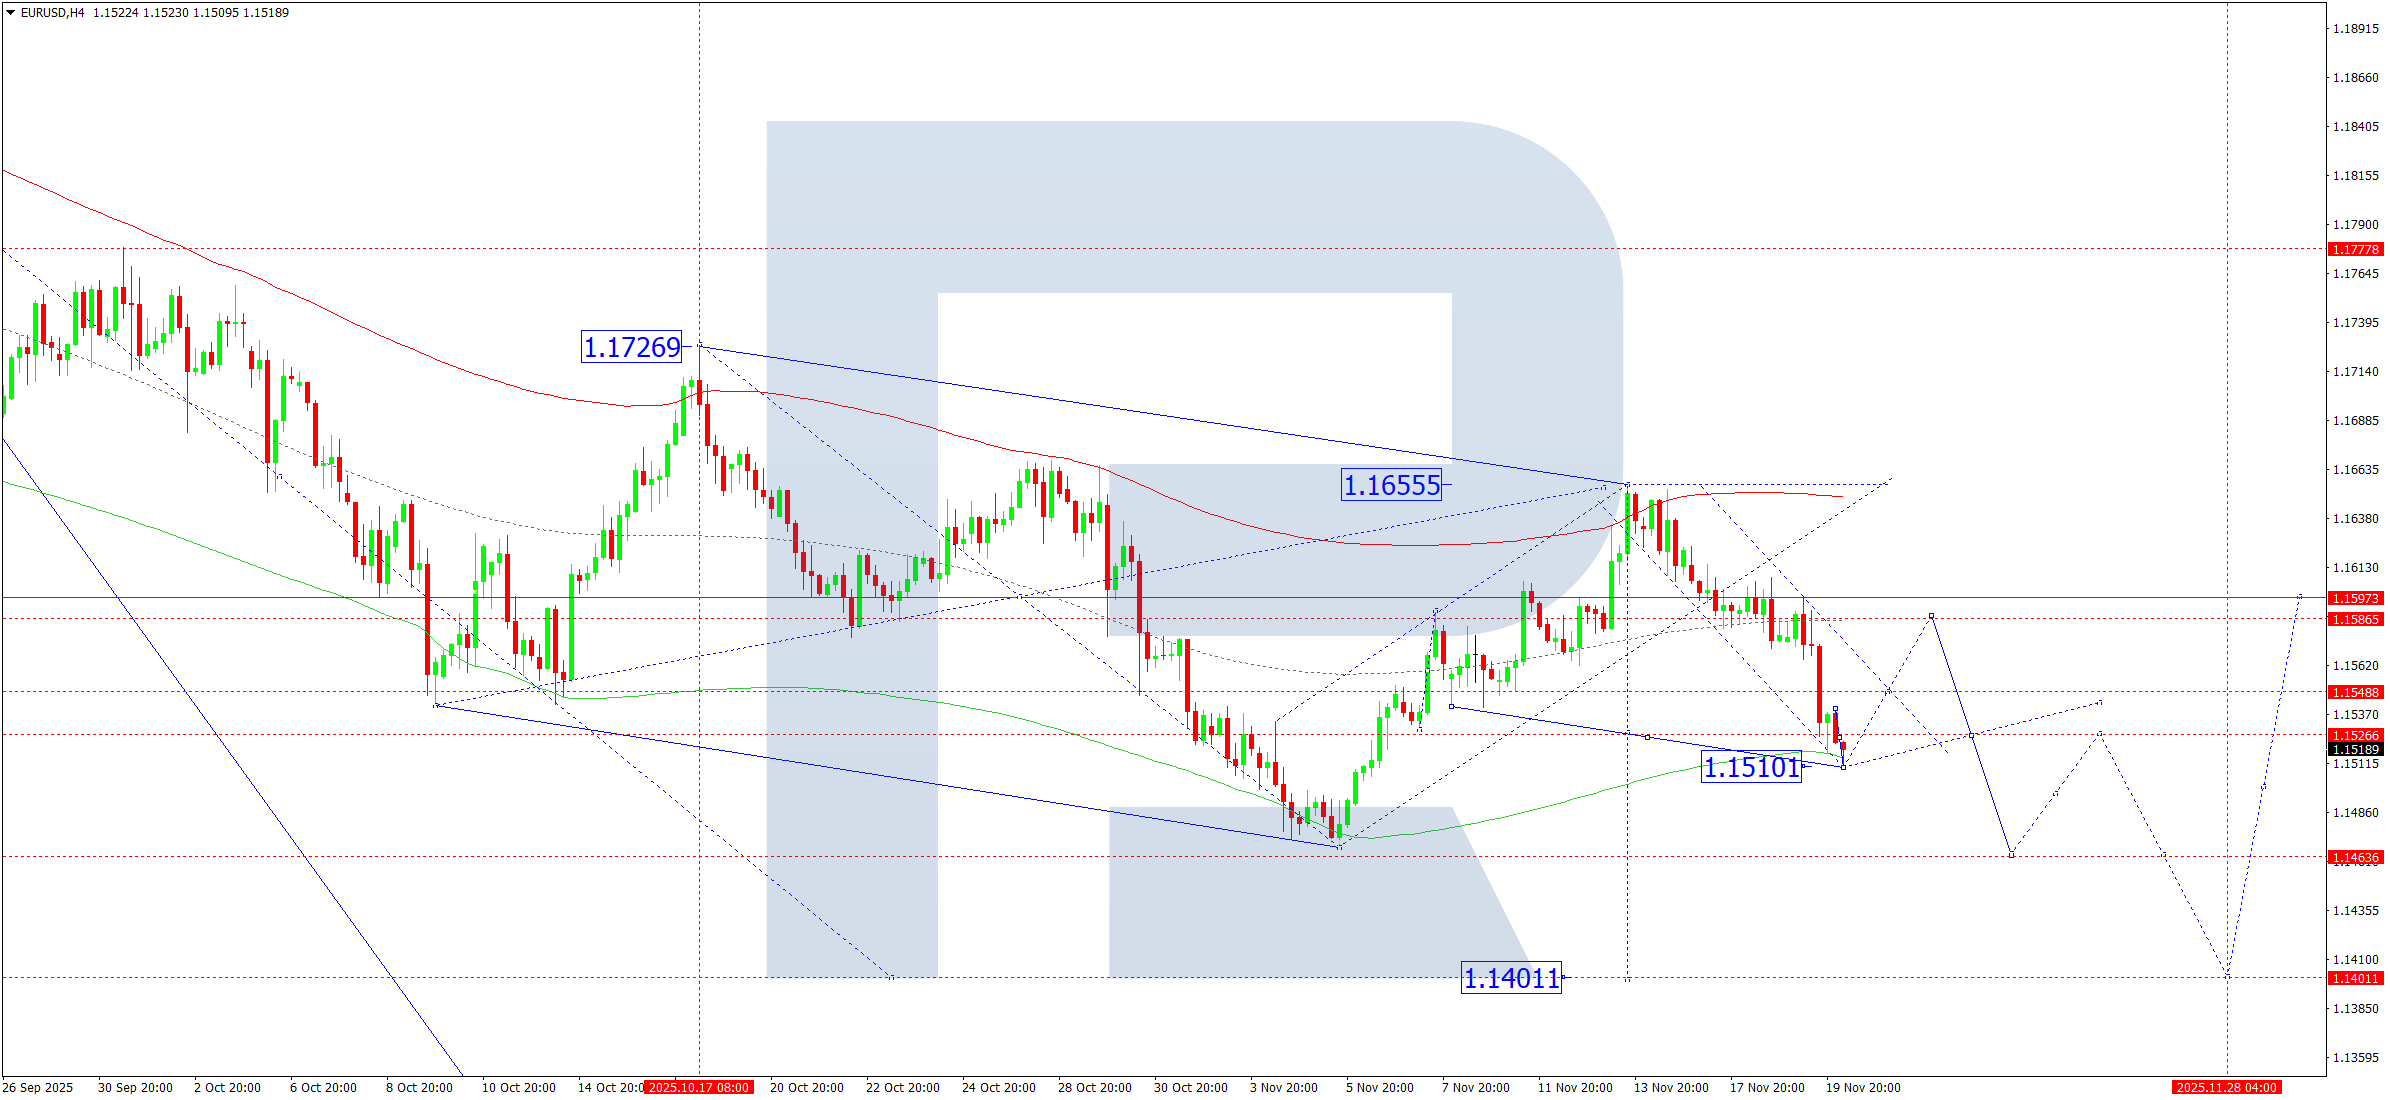
On the H4 chart, EURUSD has broken downward from its consolidation range. As of 20 November 2025, the market has completed a downward wave to 1.1510, marking the start of the fifth bearish wave. A narrow consolidation zone is forming above this level, which may extend upward toward 1.1548, with a potential corrective rise to 1.1585. Afterwards, a move lower towards 1.1464 is expected, with a broader bearish target near 1.1401.
The Elliott Wave structure and downward wave matrix, with a pivot at 1.1660, reinforce this outlook. The price has reached the lower boundary of the Price Envelope at 1.1510, suggesting a corrective rebound toward 1.1548, followed by a continuation lower toward 1.1464 and possibly 1.1401.
Technical indicators point to a correction toward 1.1548, followed by renewed downside pressure targeting 1.1464.
USDJPY Forecast
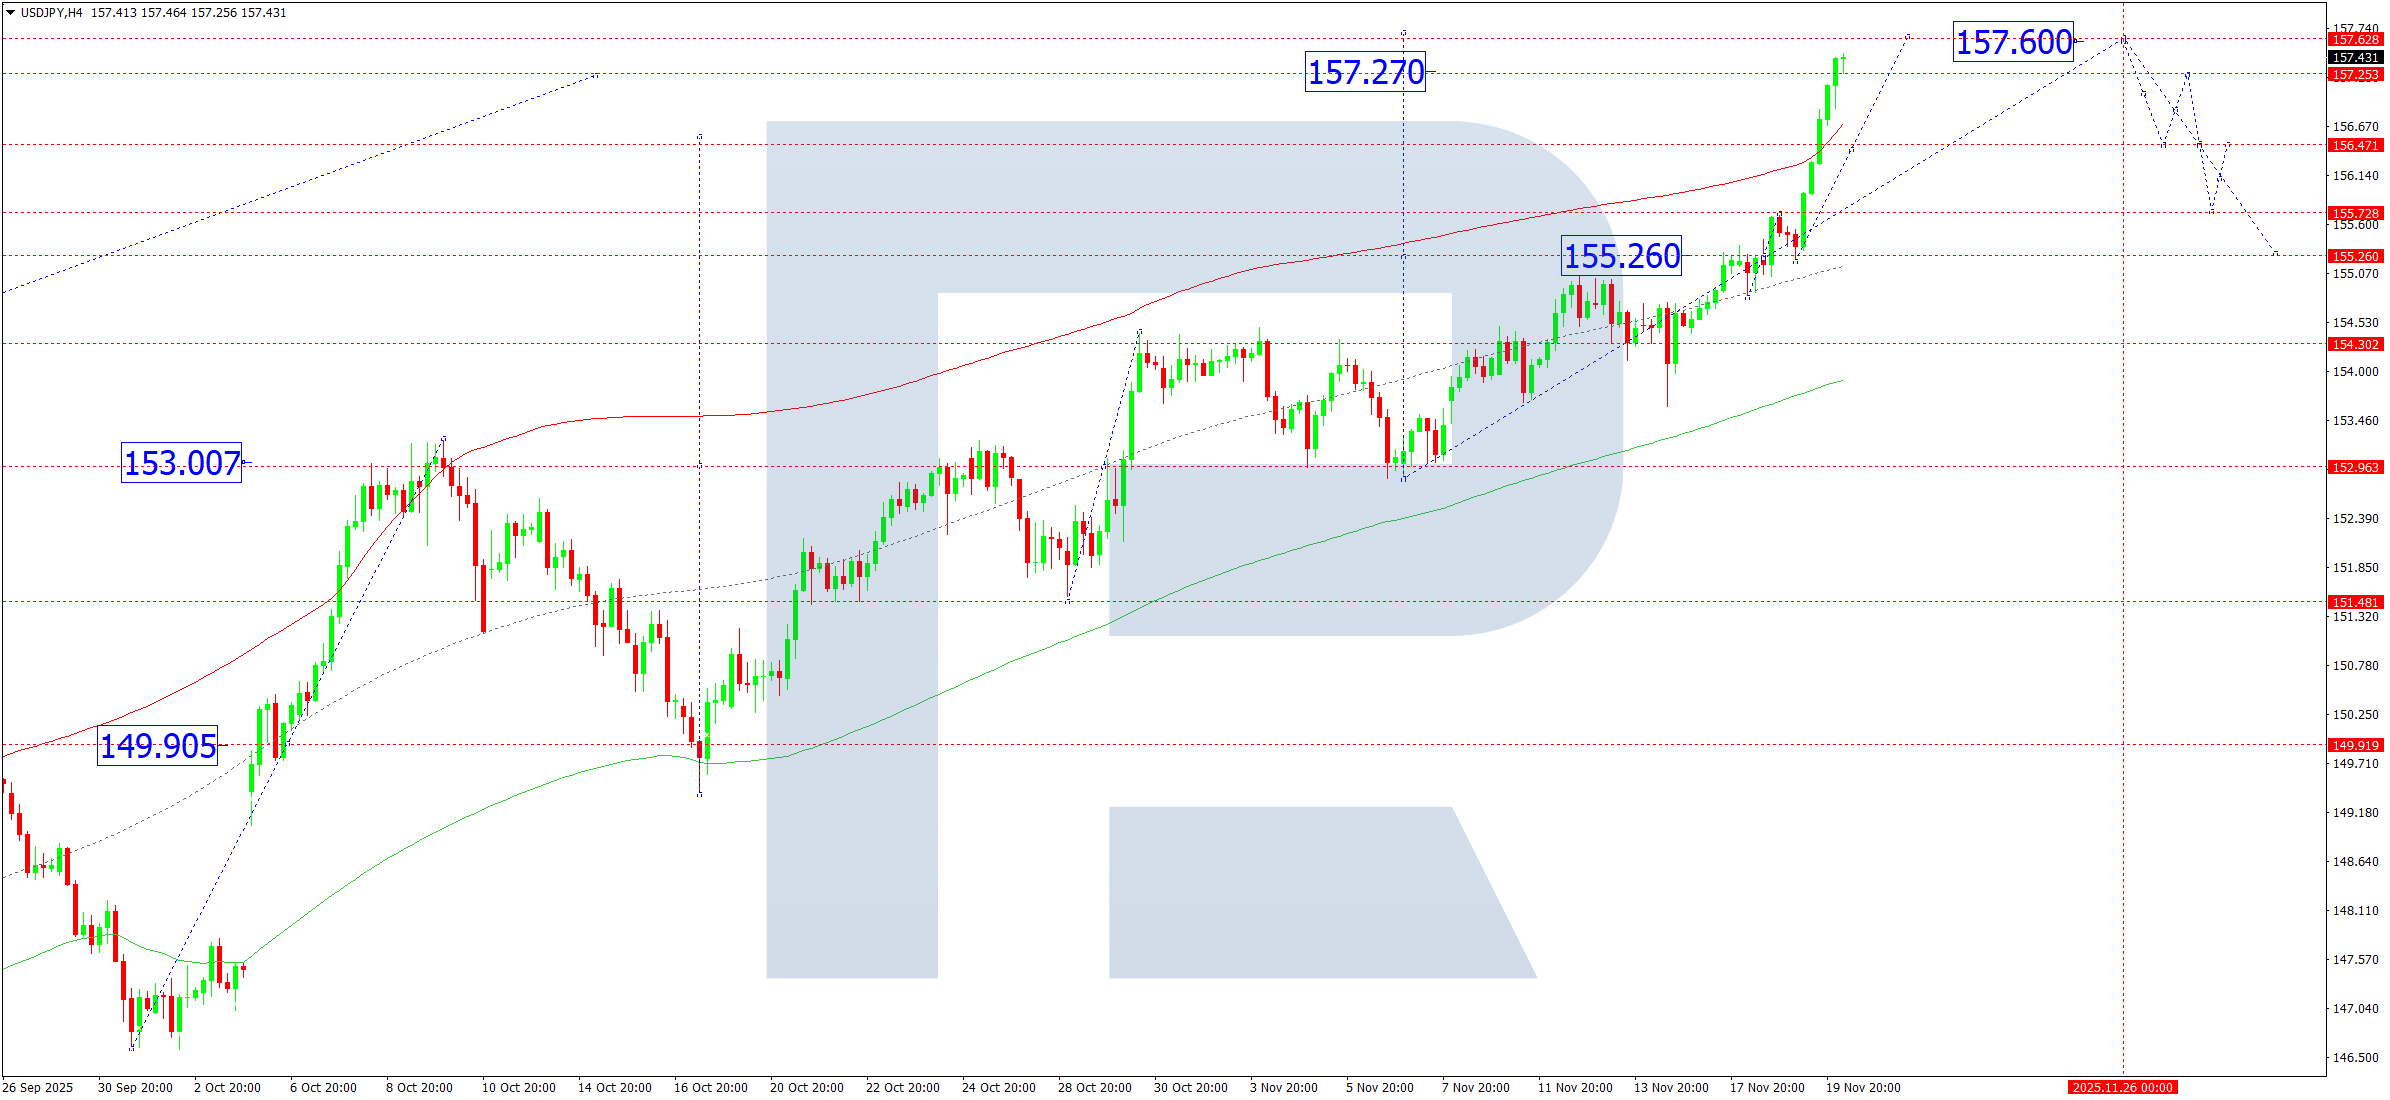
On the H4 timeframe, USDJPY consolidated near 155.26 before breaking upward and hitting the projected target of 157.27. A compact consolidation zone may form beneath this level. A downward breakout could trigger a correction toward 155.26, while an upward breakout would signal an extension toward 157.60.
The Elliott Wave structure and upward wave matrix with a pivot at 153.00 support this scenario. After completing an upward move to 157.20, a corrective pullback to the Price Envelope’s central line at 155.26 appears possible before another rise toward 157.60.
Technical indicators suggest a corrective dip to 155.26, followed by further upside toward 157.60.
GBPUSD Forecast
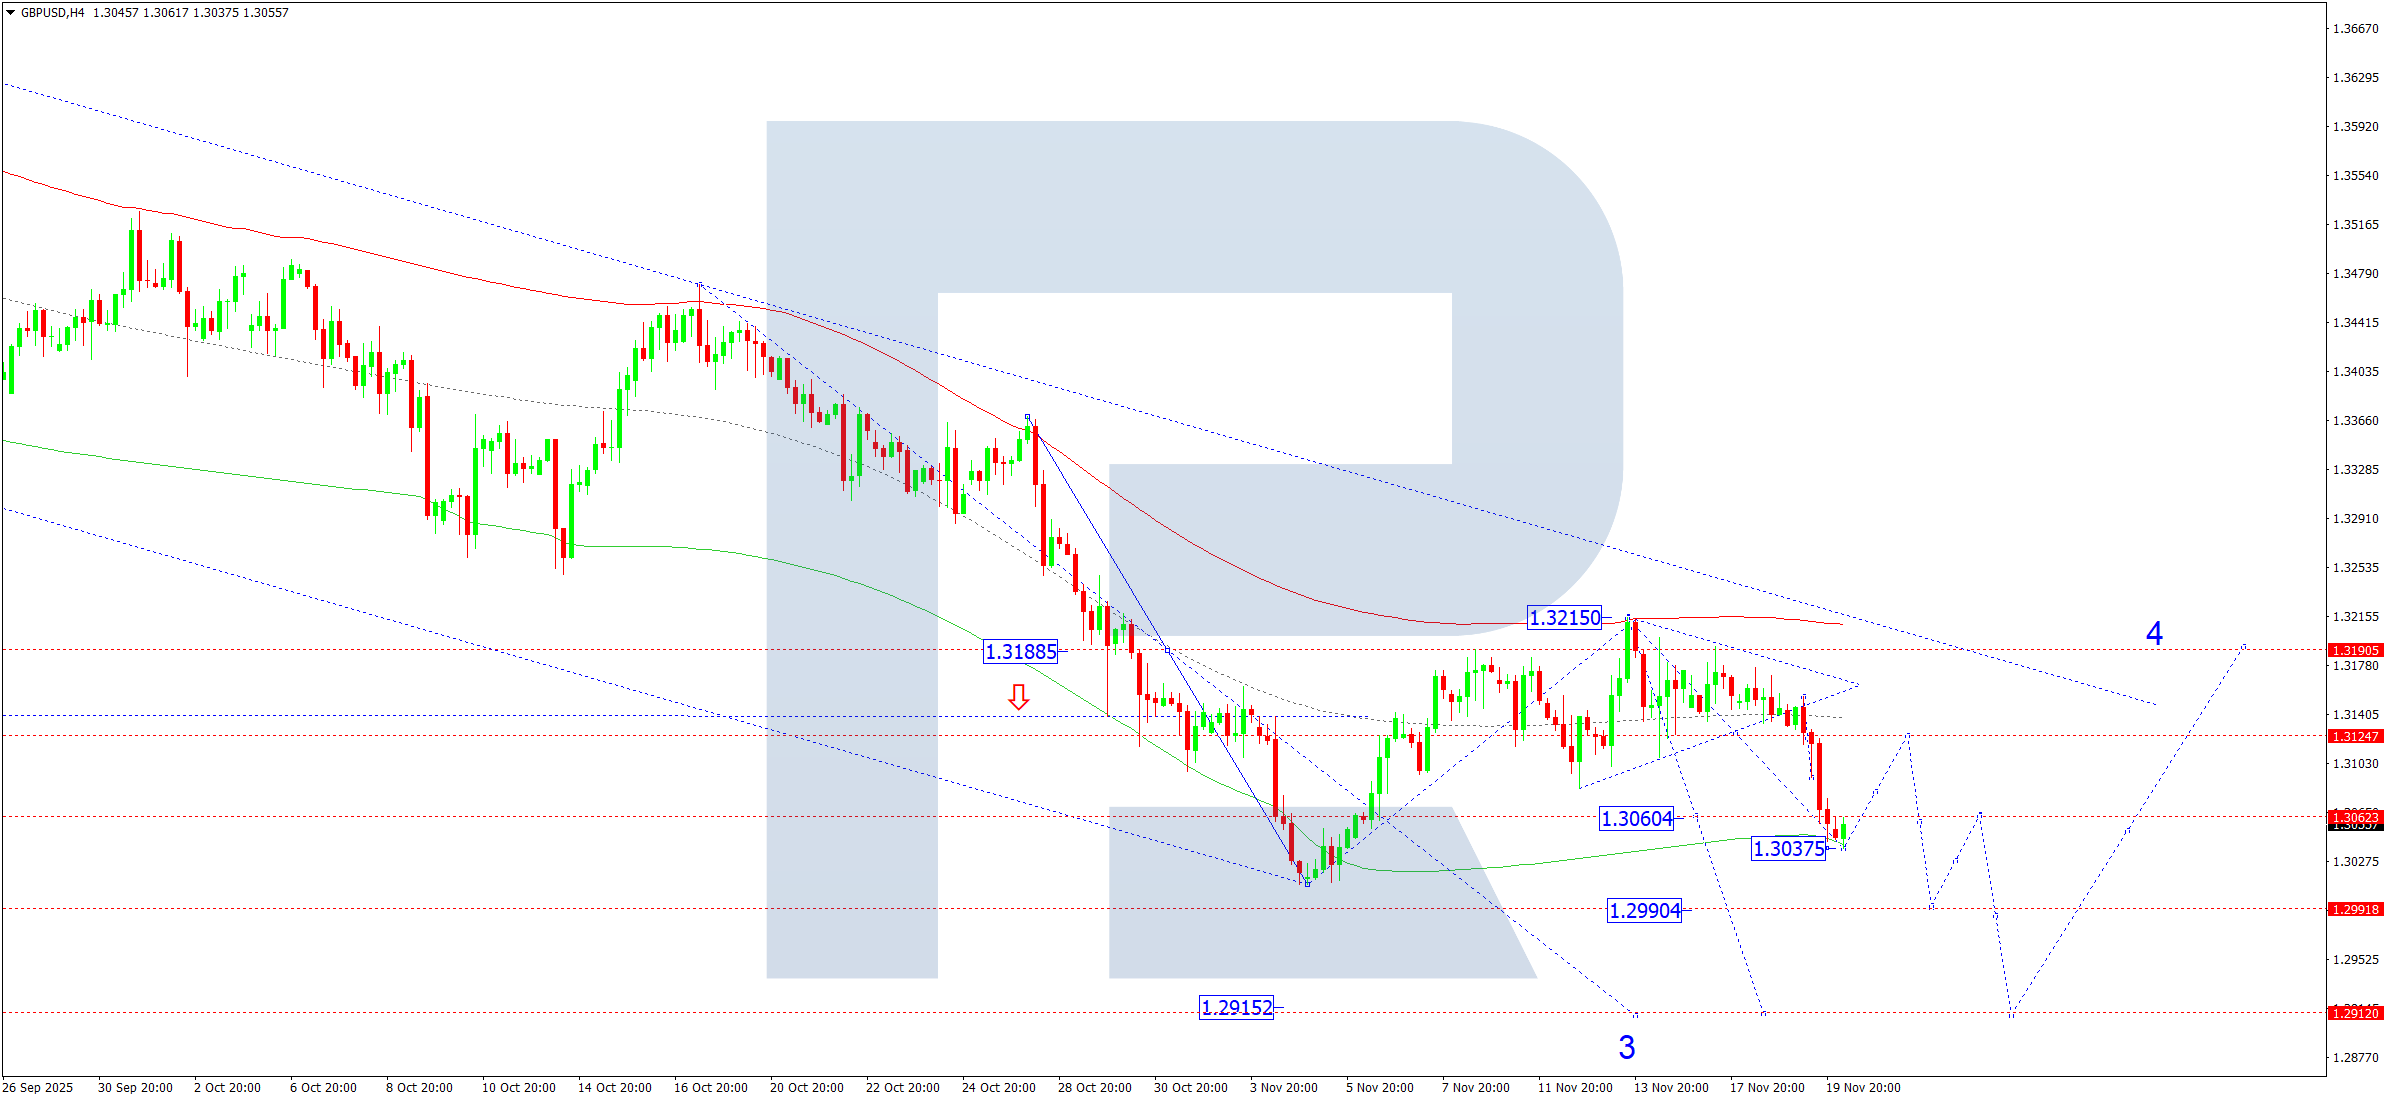
On the H4 chart, GBPUSD has completed a bearish wave to 1.3037. A consolidation phase may develop above this level. A breakout to the upside could trigger a correction toward 1.3080, while a downside breakout would confirm continuation toward 1.2990, with potential extension to 1.2915.
The Elliott Wave structure and downward matrix with a pivot at 1.3188 confirm the bearish outlook. With the price at the lower Price Envelope boundary, a correction toward 1.3080 is likely before a continuation lower toward 1.2990.
Technical indicators point toward further downward movement targeting 1.2990.
AUDUSD Forecast
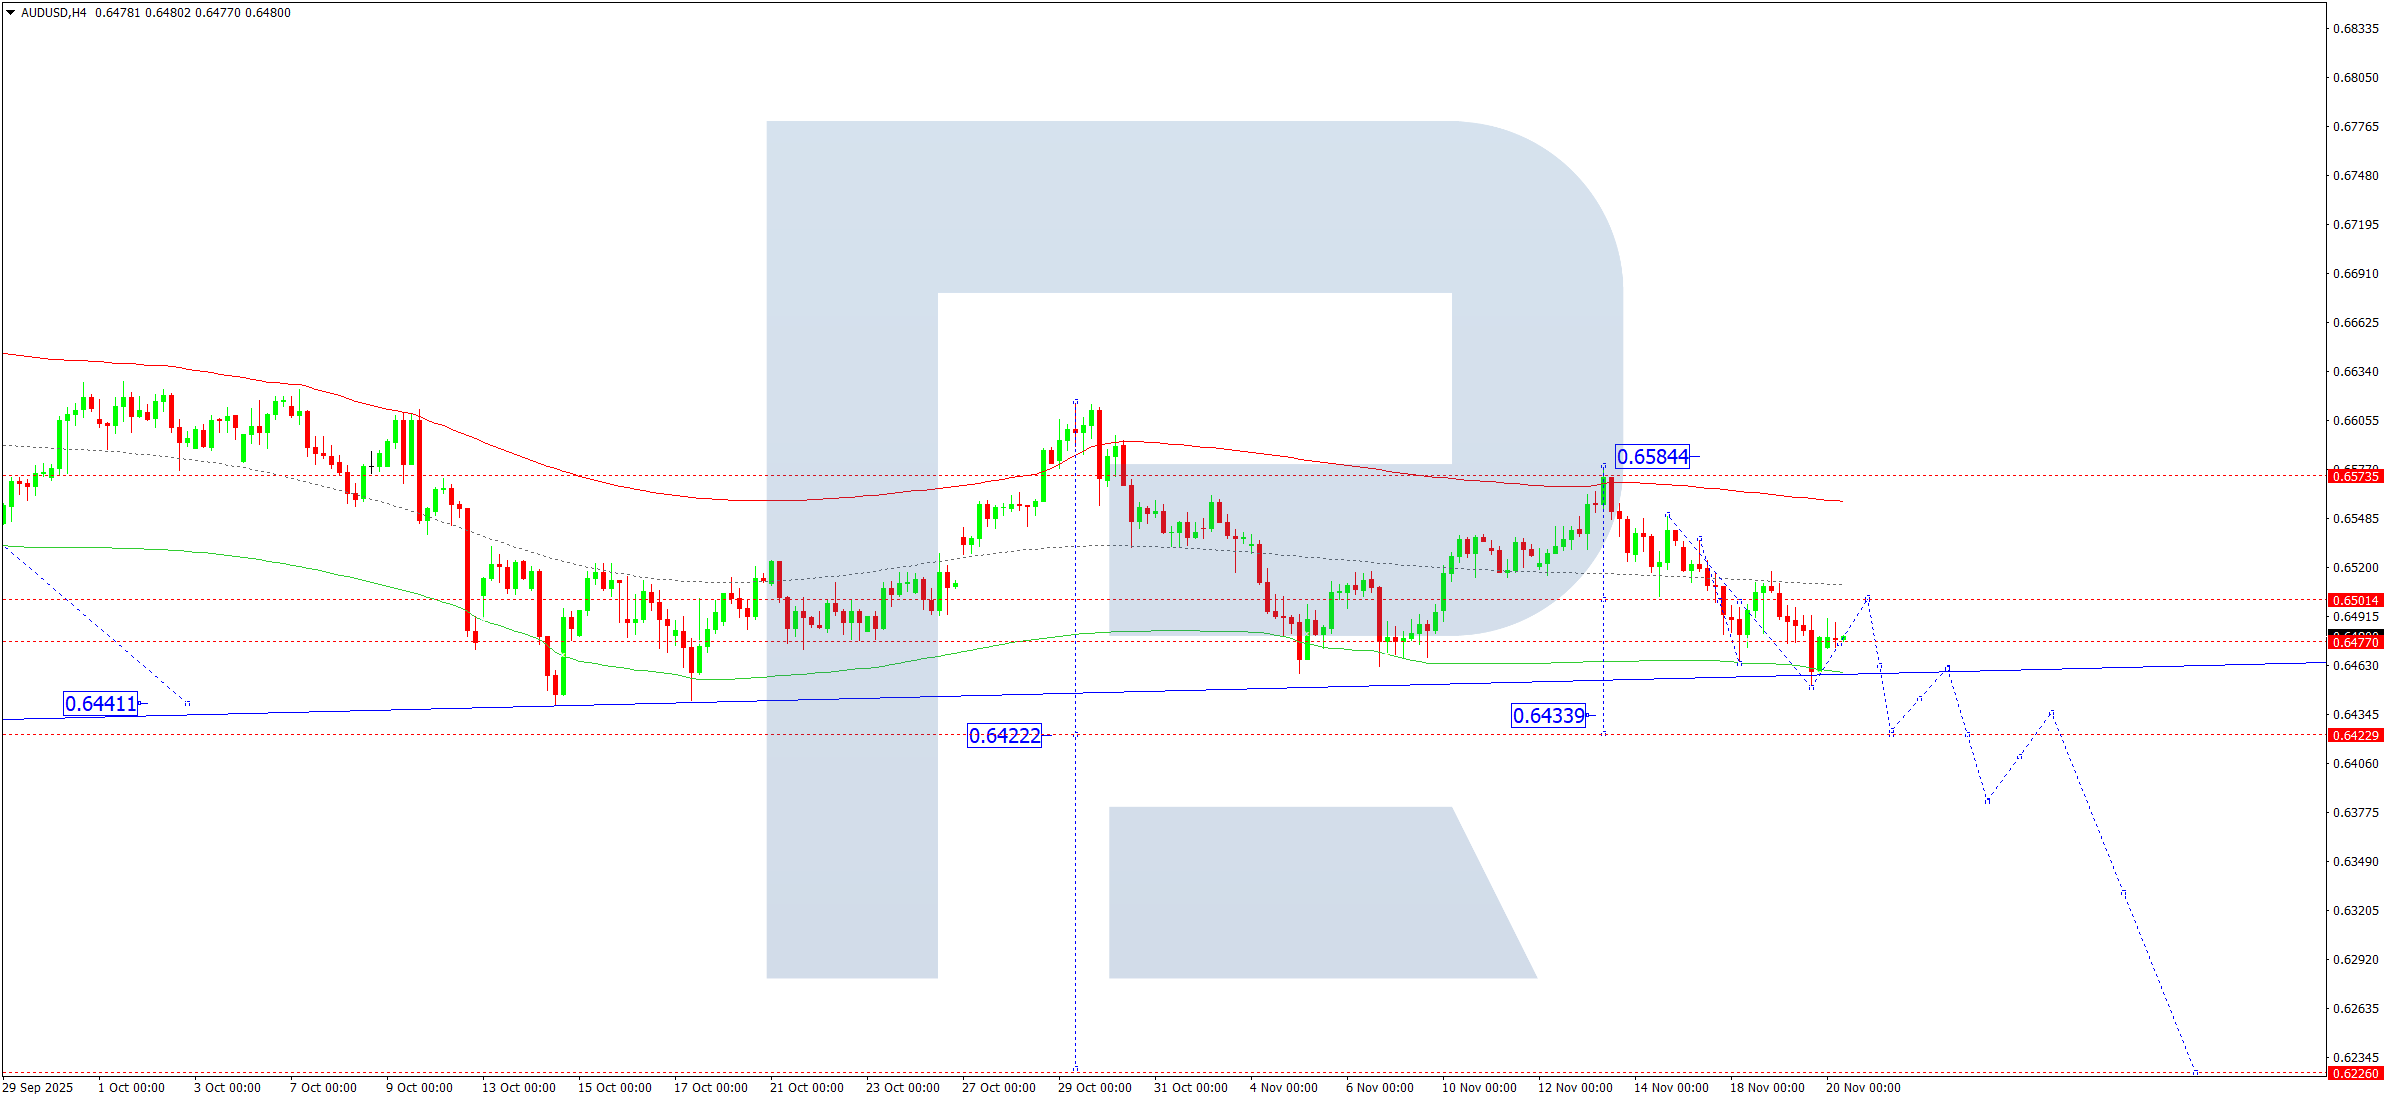
AUDUSD completed its local bearish target at 0.6450. A correction toward 0.6477 has formed, and the market is now consolidating. A bullish breakout may extend the correction toward 0.6500, but the dominant bearish outlook remains, with a decline toward 0.6422 expected afterward.
The Elliott Wave structure and downward matrix with a pivot at 0.6570 support this bias. A rise to the central Price Envelope line at 0.6500 may precede a continuation lower toward 0.6422.
Technical indicators favor further decline toward 0.6422.
USDCAD Forecast
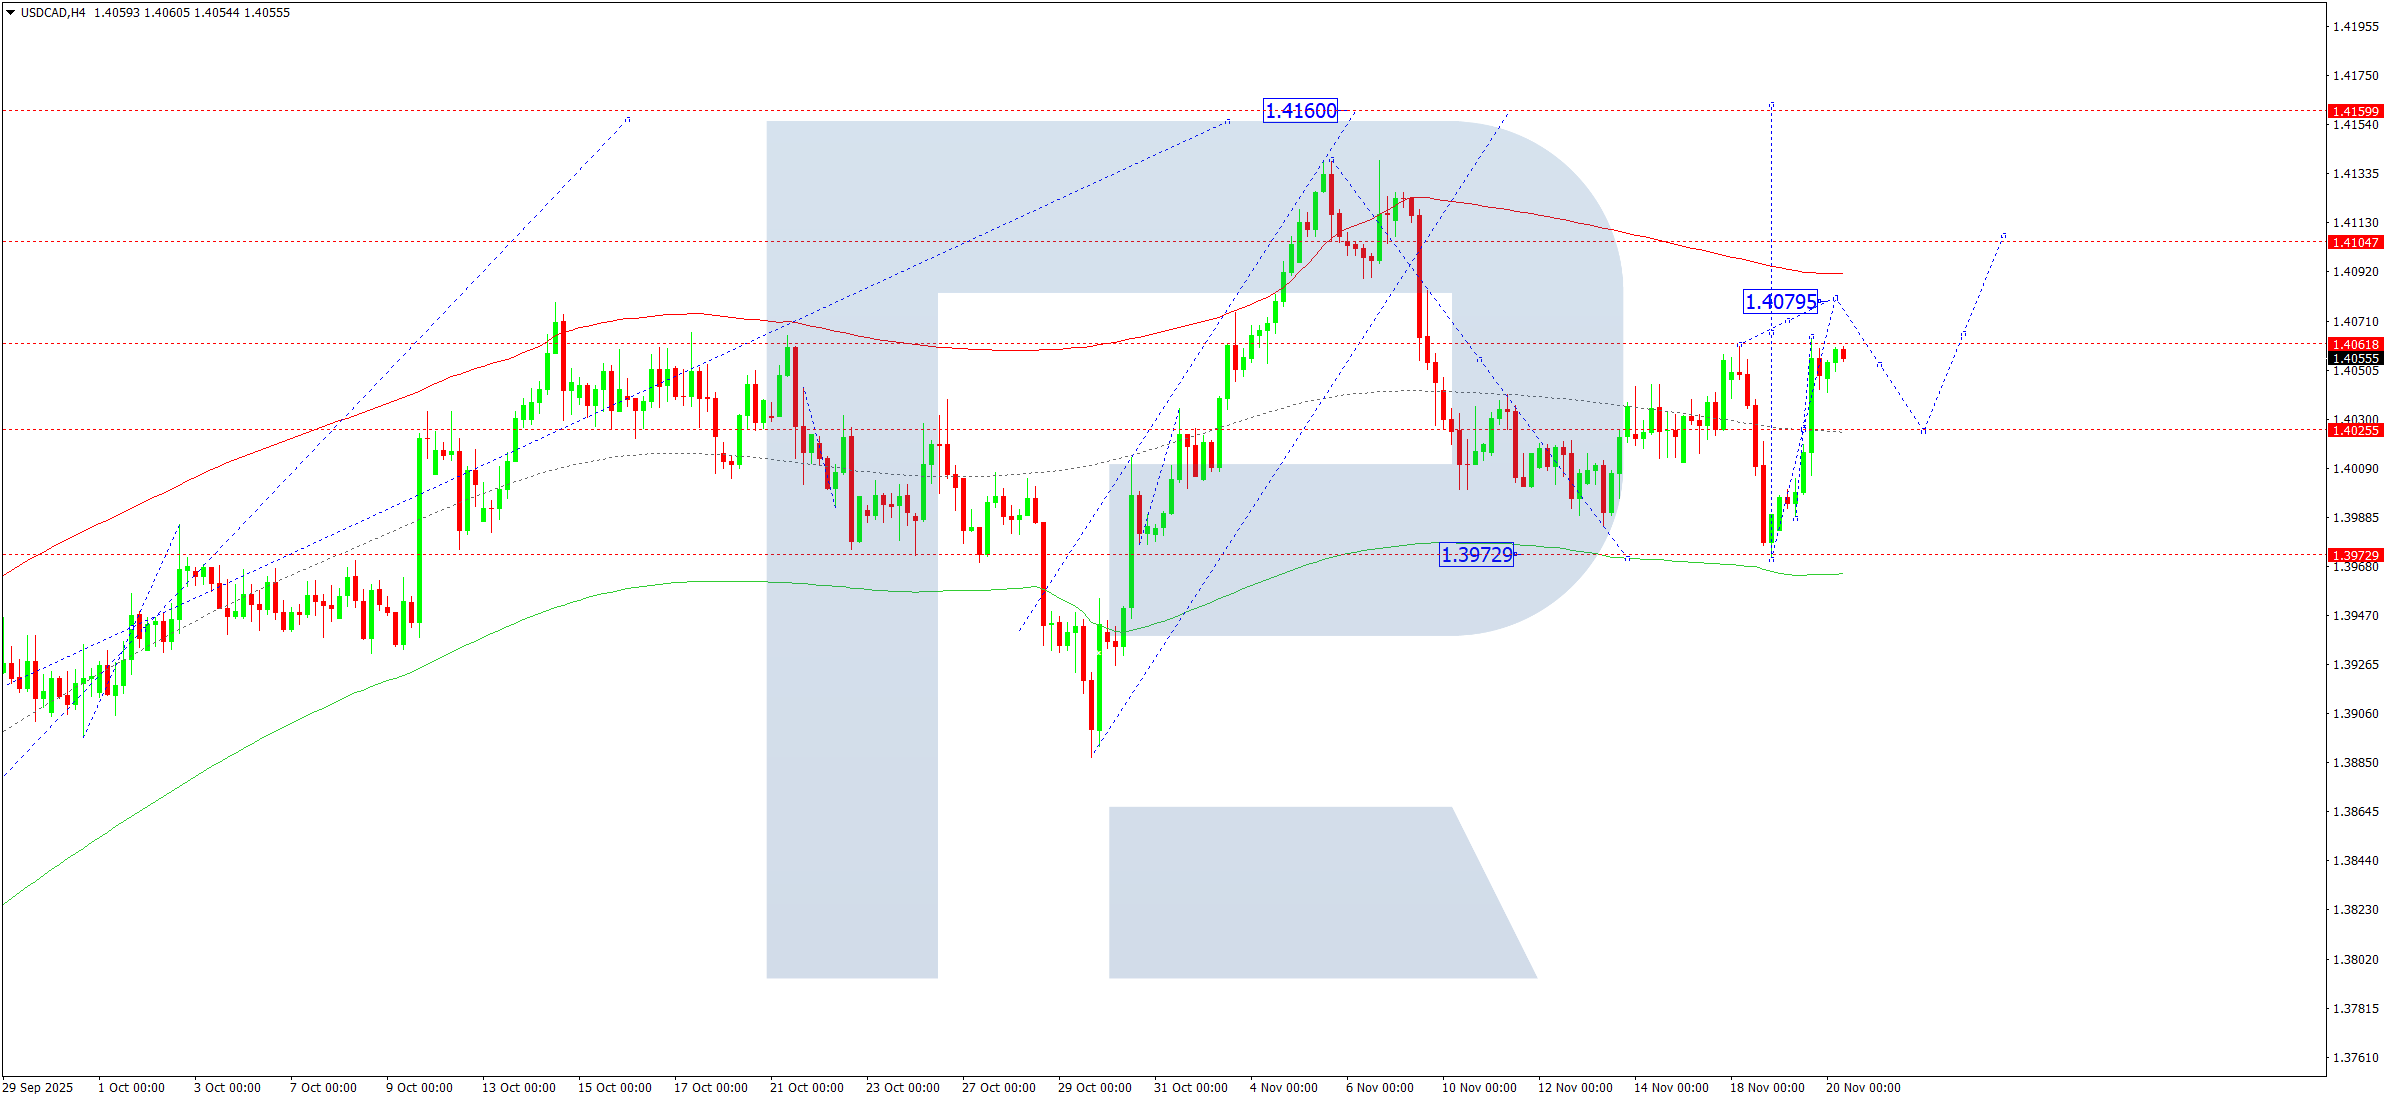
USDCAD has completed an upward wave to 1.4064. A correction toward 1.4025 may develop, followed by another upward movement toward 1.4080. This may evolve into a fifth-wave advance toward 1.4160.
The Elliott Wave structure and upward wave matrix with a pivot at 1.3939 confirm this setup. The price is nearing the upper Price Envelope boundary at 1.4080, suggesting a corrective pullback toward 1.4025 before another rise to 1.4140.
Technical indicators point to continued upside movement toward 1.4080.
XAUUSD (Gold) Forecast
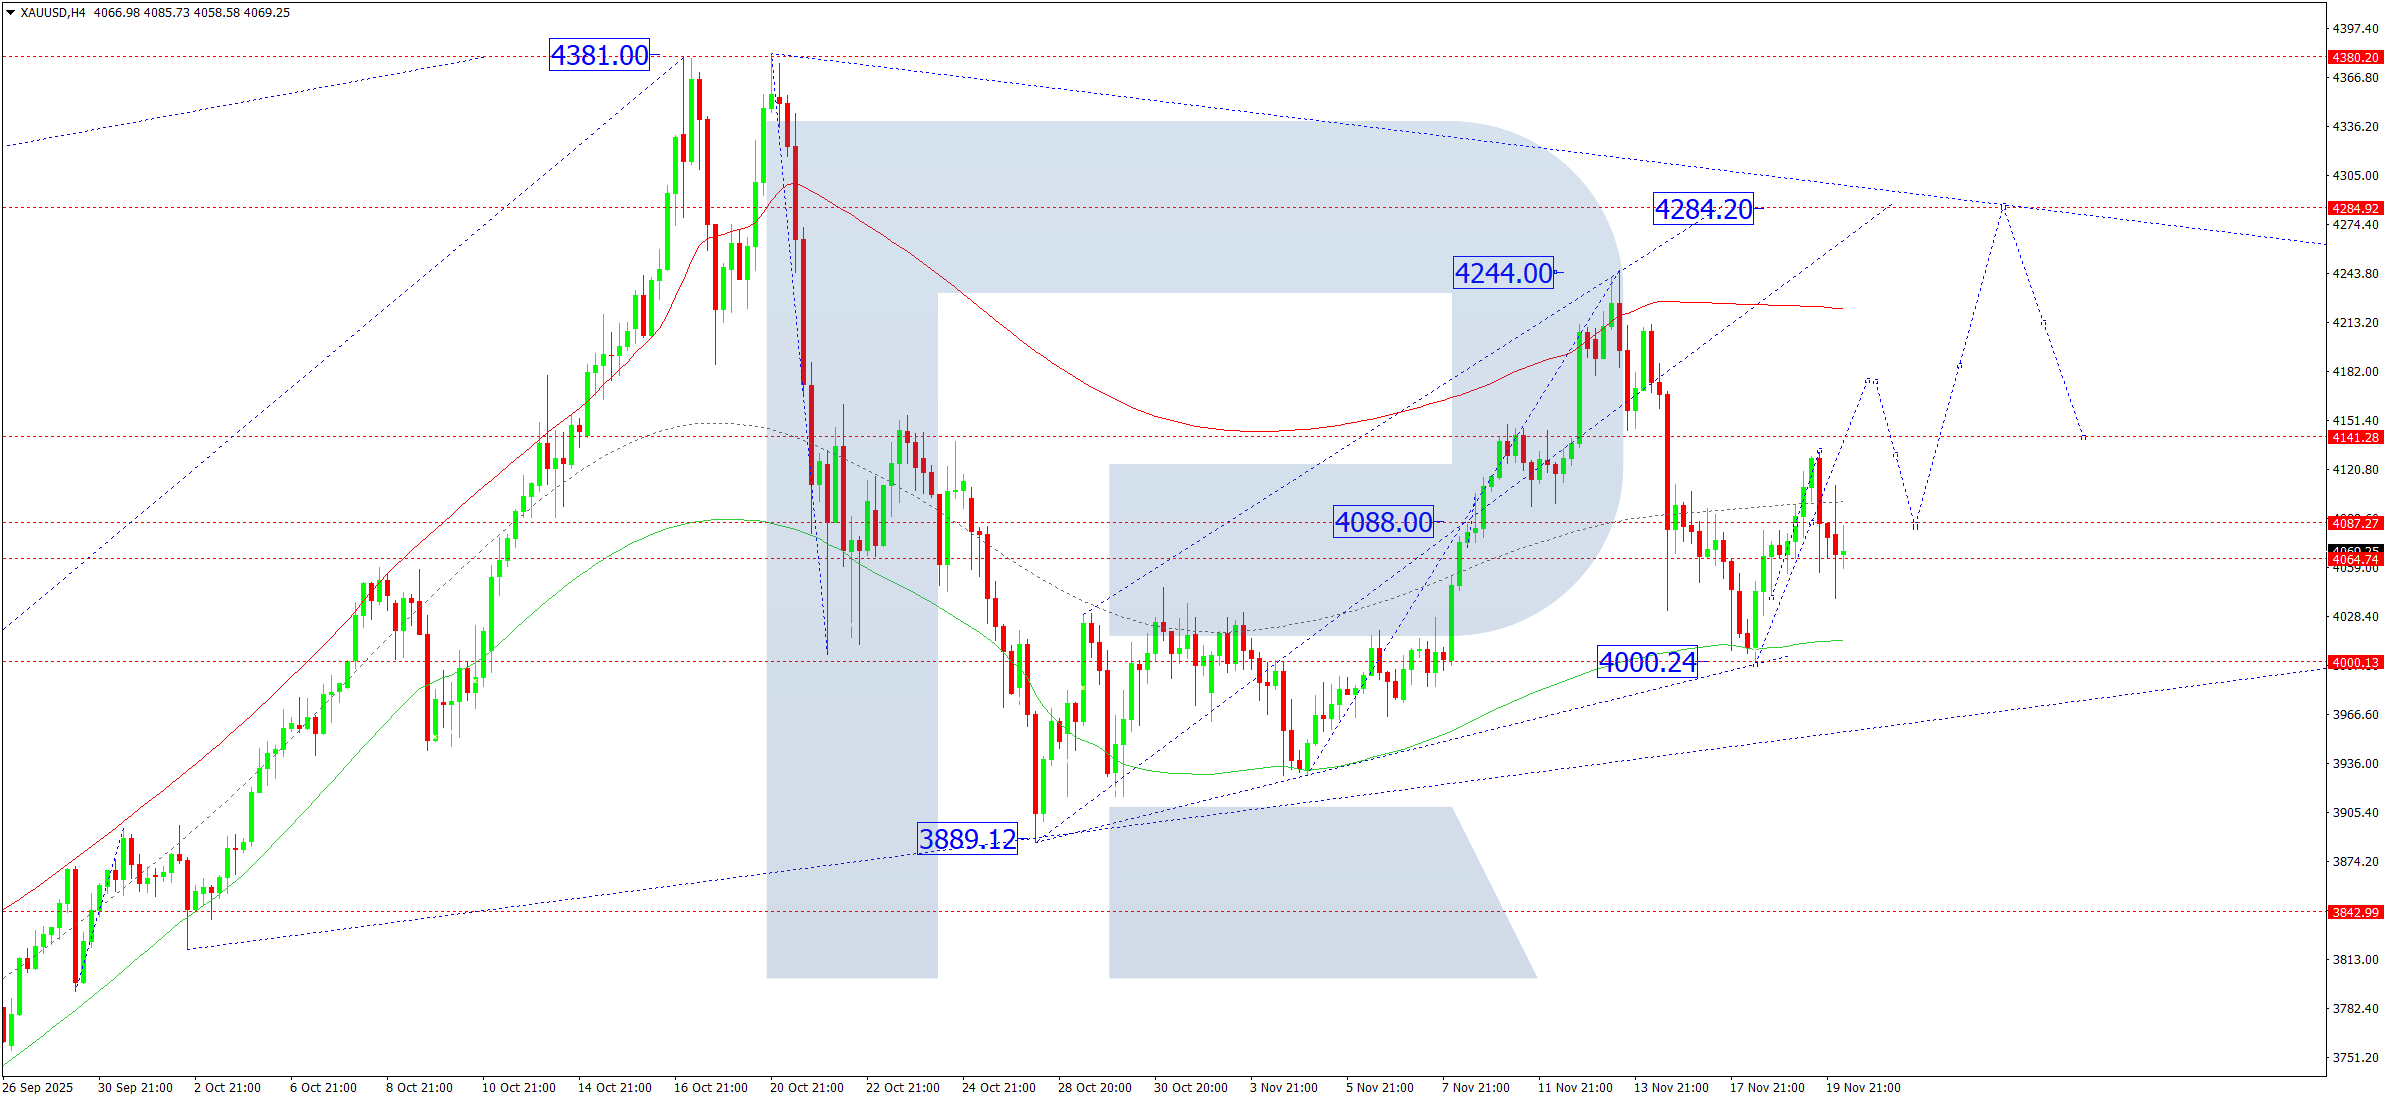
XAUUSD is forming a consolidation range around 4088. An upward impulse toward 4180 remains likely as part of a larger bullish trend targeting 4284.
The Elliott Wave structure and bullish matrix with a pivot at 4088 confirm the ongoing development of the fifth wave toward the upper Price Envelope boundary at 4284.
Technical indicators favor upward movement toward 4180, 4208, and ultimately 4284.
Brent Crude Oil Forecast
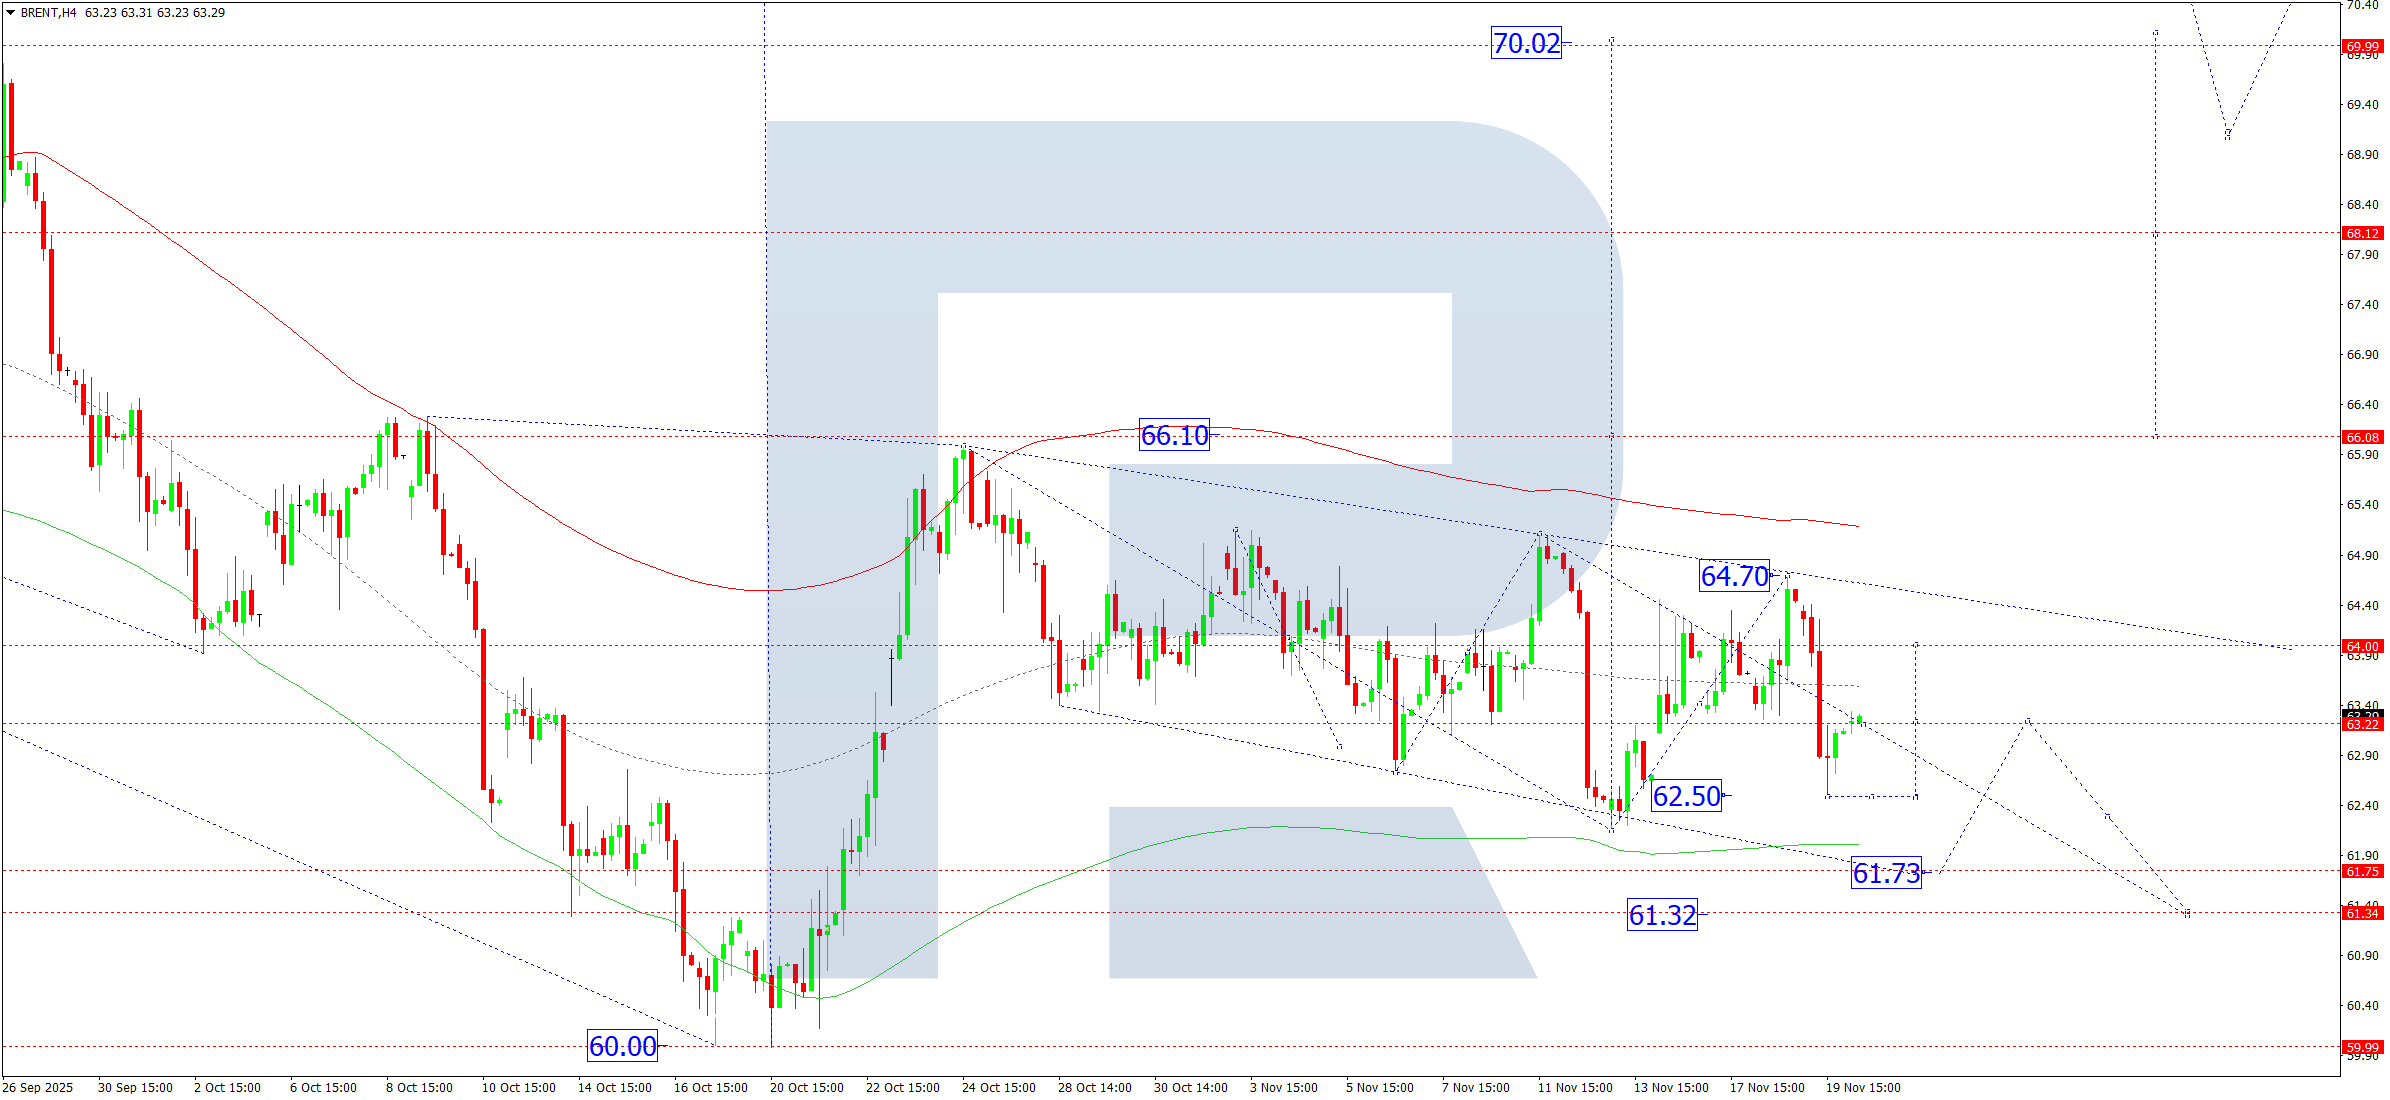
Brent is consolidating around 64.00 on the H4 chart. An upward breakout may open the way toward 66.10, with an extended target near 70.00. Alternatively, a downward breakout could trigger a corrective decline to 61.75, after which the market may resume its rise toward 70.00.
The Elliott Wave structure and upward matrix with a pivot at 64.00 support this view. The market is currently near the central Price Envelope line at 64.00, with potential for either a drop to 61.75 or an upward continuation to 66.10.
Technical indicators indicate the likelihood of a dip to 61.75, followed by a rebound toward 66.10.
Risk Warning: Past trading performance does not guarantee future results.
Leave a Reply