
Daily Technical Analysis and Forecast – 23 July 2025
EURUSD Forecast
On the H4 chart, EURUSD formed a consolidation range around 1.1640. After an upward breakout, the market completed a correction to 1.1716. Currently, it is consolidating near 1.1690. A downward breakout could prompt a decline to 1.1640 (as a retest from above), followed by a potential rise toward 1.1726. If the price breaks upwards from the current range, it could extend directly to 1.1726. Subsequently, a new downward wave may develop towards 1.1560, possibly stretching to 1.1488.
This outlook aligns with the current Elliott wave structure, highlighting 1.1640 as a pivotal level. Price action suggests a continuation towards the upper boundary of the Price Envelope at 1.1726 before possibly reversing towards its central line at 1.1640.
Technical indicators suggest further upside potential toward 1.1726.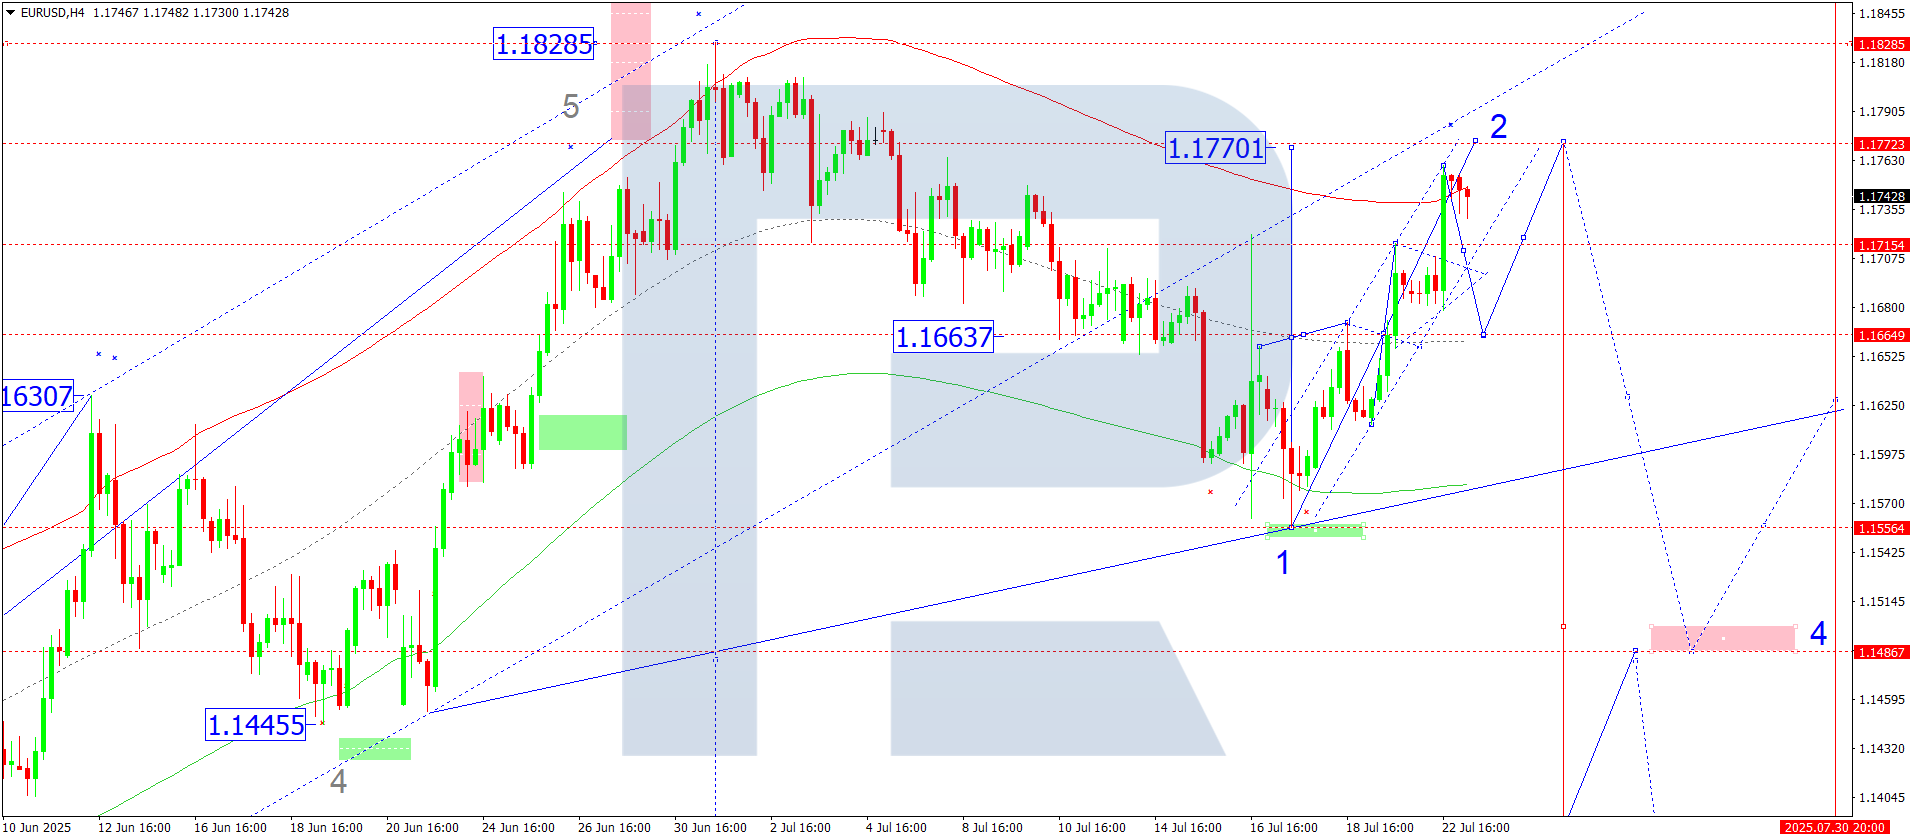
USDJPY Forecast
On the H4 chart, USDJPY completed a corrective move to 147.10. The pair is now expected to rise toward 148.50. A breakout above this level would open the path for a rally to 150.05. Once this target is met, a corrective decline back to 147.10 may follow.
This scenario is supported by the Elliott wave structure, with 147.10 serving as the key pivot point. Price is trending toward the upper boundary of the Price Envelope at 150.05, with a potential retracement toward the central line afterward.
Technical indicators support the continuation of the uptrend toward 150.05.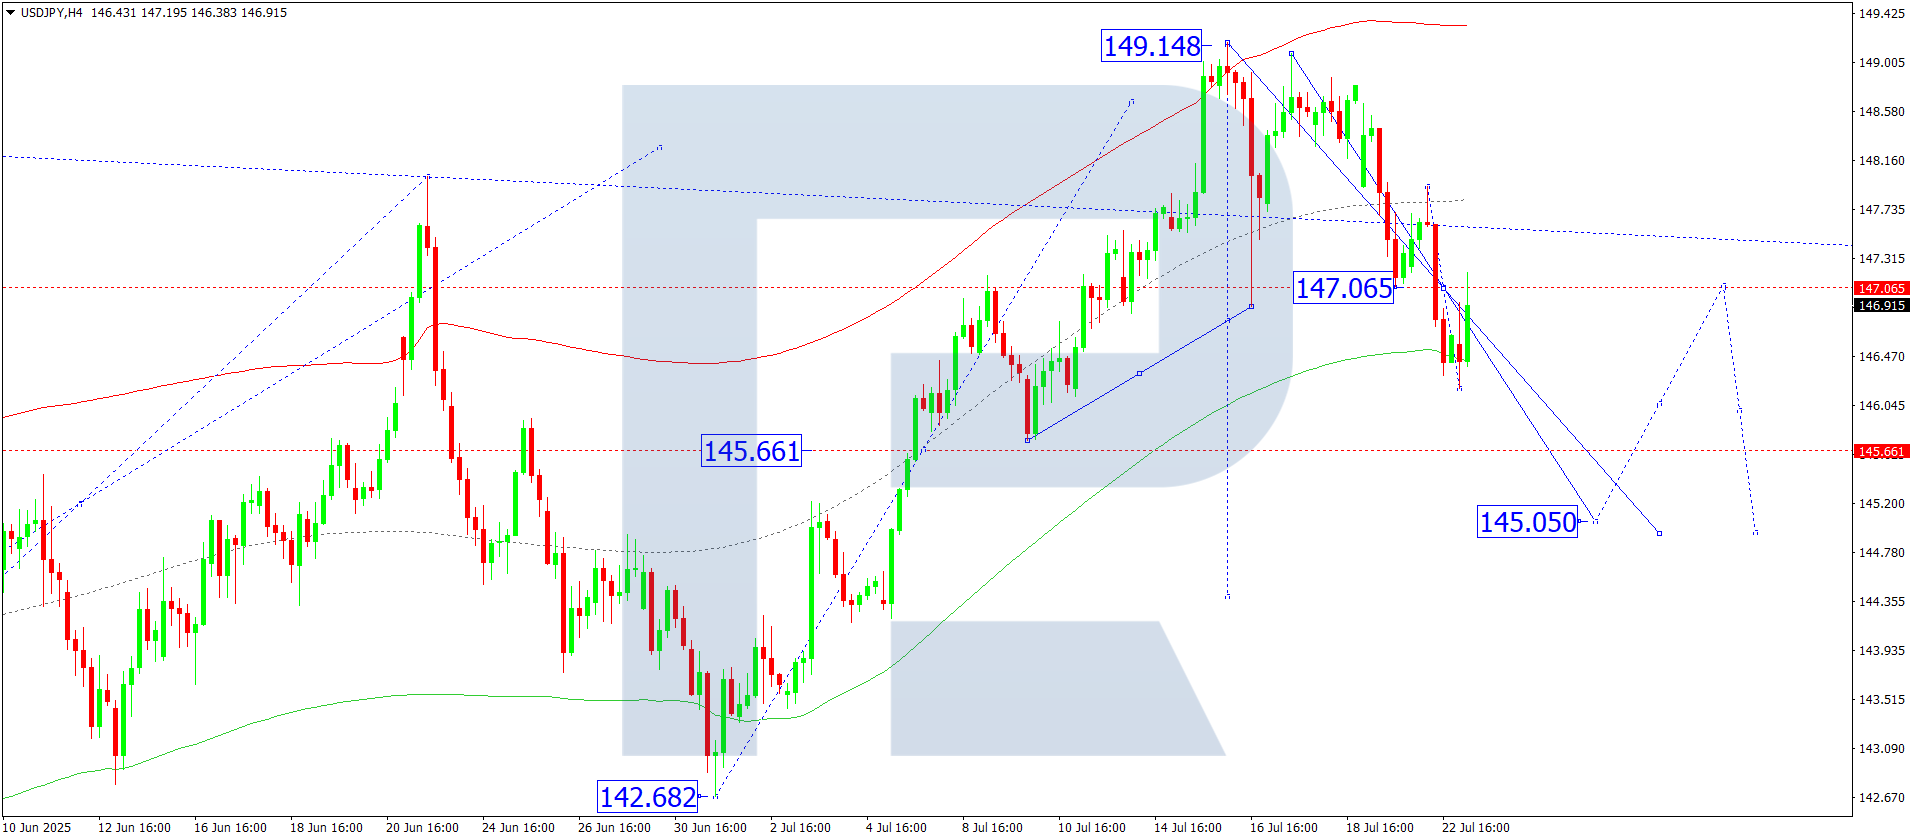
GBPUSD Forecast
On the H4 chart, GBPUSD completed a correction to 1.3510. The current expectation is for a decline toward 1.3424. A break below this level could lead to a drop to 1.3300, followed by a short-term rebound to 1.3430 and another leg down toward 1.3295.
This forecast is based on the Elliott wave pattern, with 1.3455 as the rotation centre. The pair is consolidating around 1.3430, near the Price Envelope’s central line, with potential downside to the lower boundary at 1.3340 and further to 1.3295.
Technical indicators point to a downward move toward 1.3340.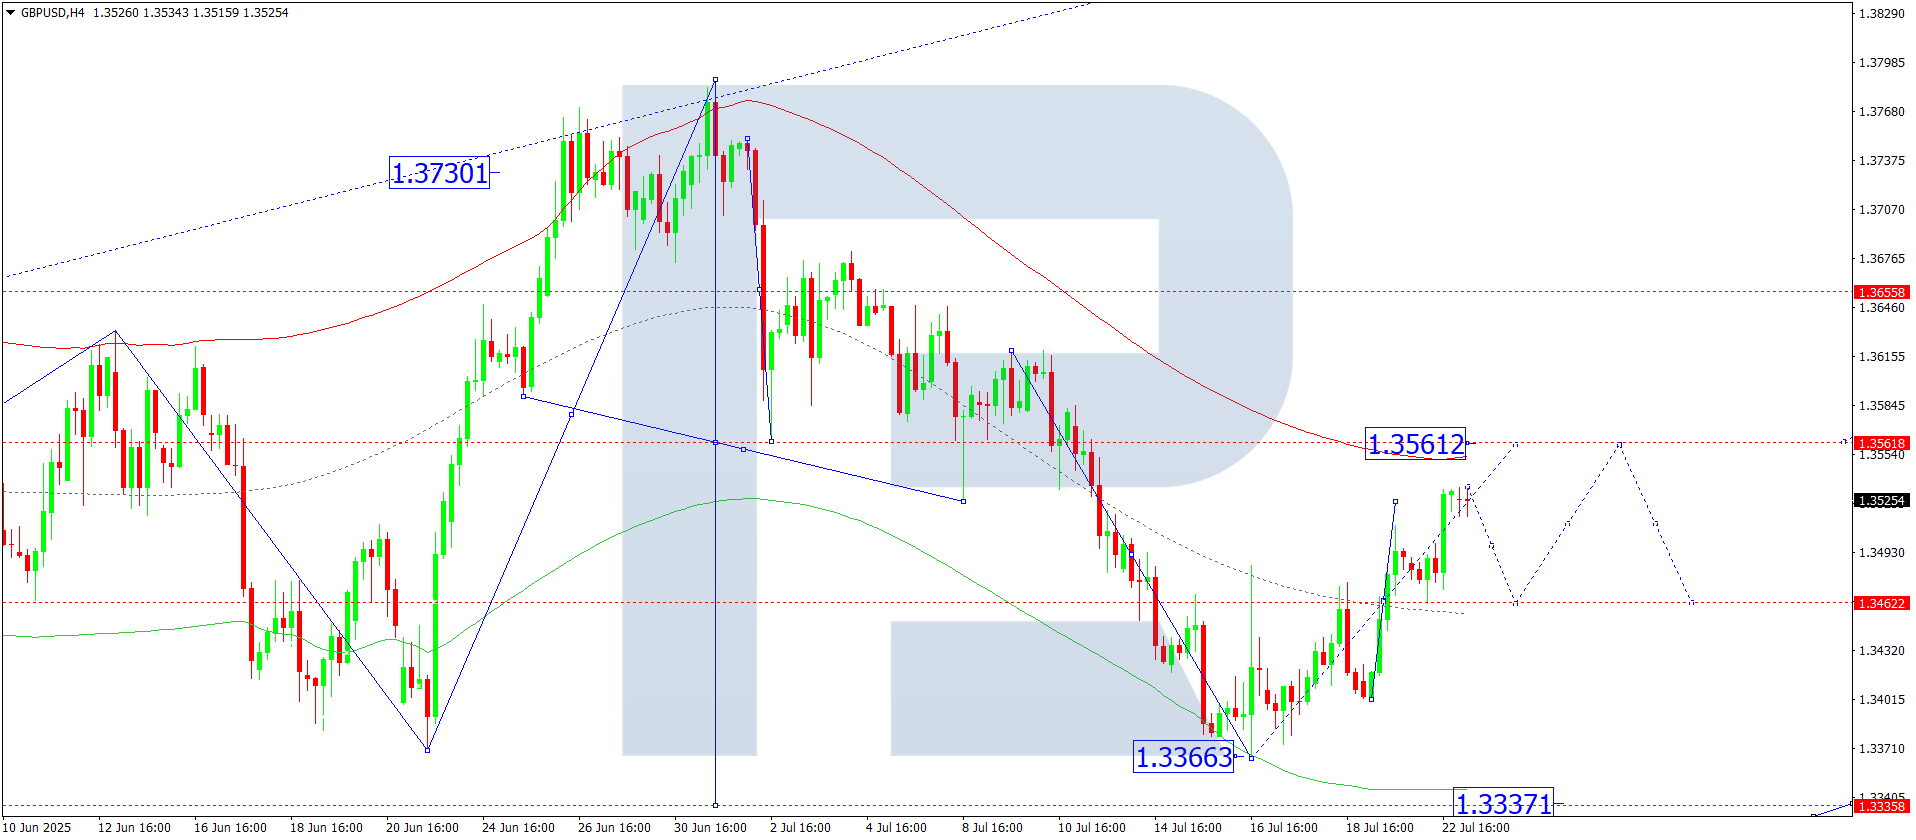
AUDUSD Forecast
On the H4 chart, AUDUSD is forming a consolidation pattern around 0.6525. A downward move to 0.6484 is expected. A breakout below this level could drive the price toward 0.6433.
This scenario follows the Elliott wave structure, with 0.6525 as a key rotation point. The pair is expected to fall toward the Price Envelope’s lower boundary at 0.6454. A corrective move back to the central line at 0.6500 may occur before another decline toward 0.6433.
Technical indicators suggest a likely continuation of the downtrend to 0.6433.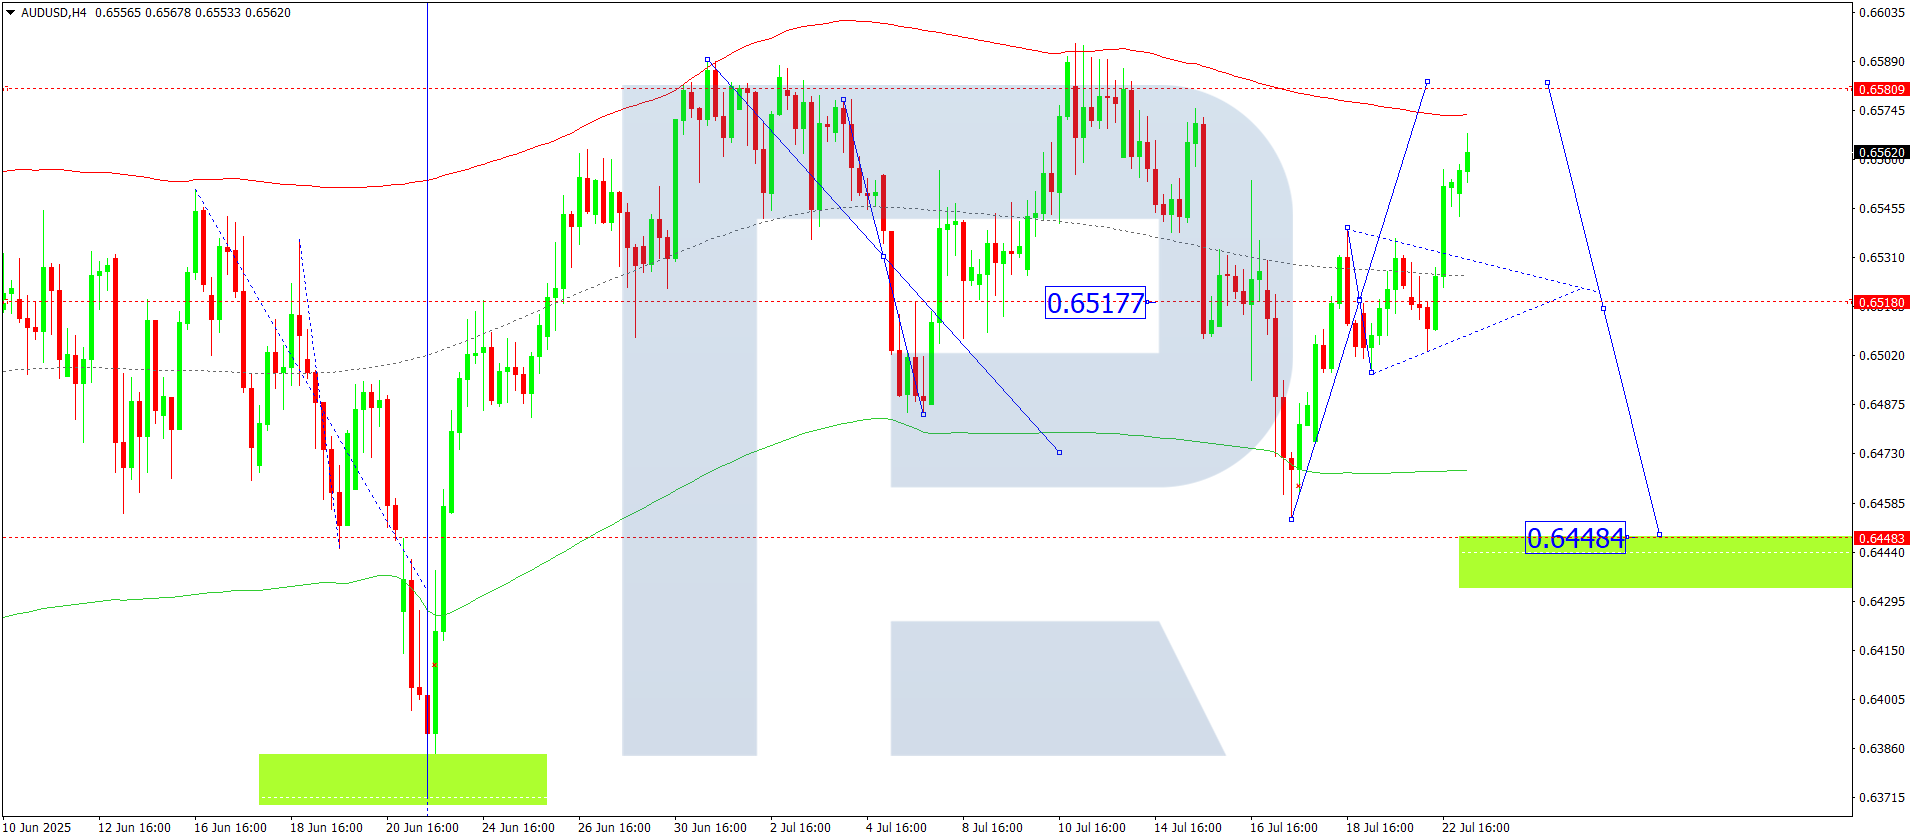
USDCAD Forecast
On the H4 chart, USDCAD completed a downward move to 1.3684. A new upward wave is now anticipated toward 1.3745, with the potential to reach 1.3815.
This scenario is confirmed by the Elliott wave structure, with 1.3685 acting as the key rotation level. Price is forming a consolidation range near the central line of the Price Envelope, with a move to the upper boundary at 1.3815 remaining a relevant scenario.
Technical indicators support a bullish move toward 1.3815.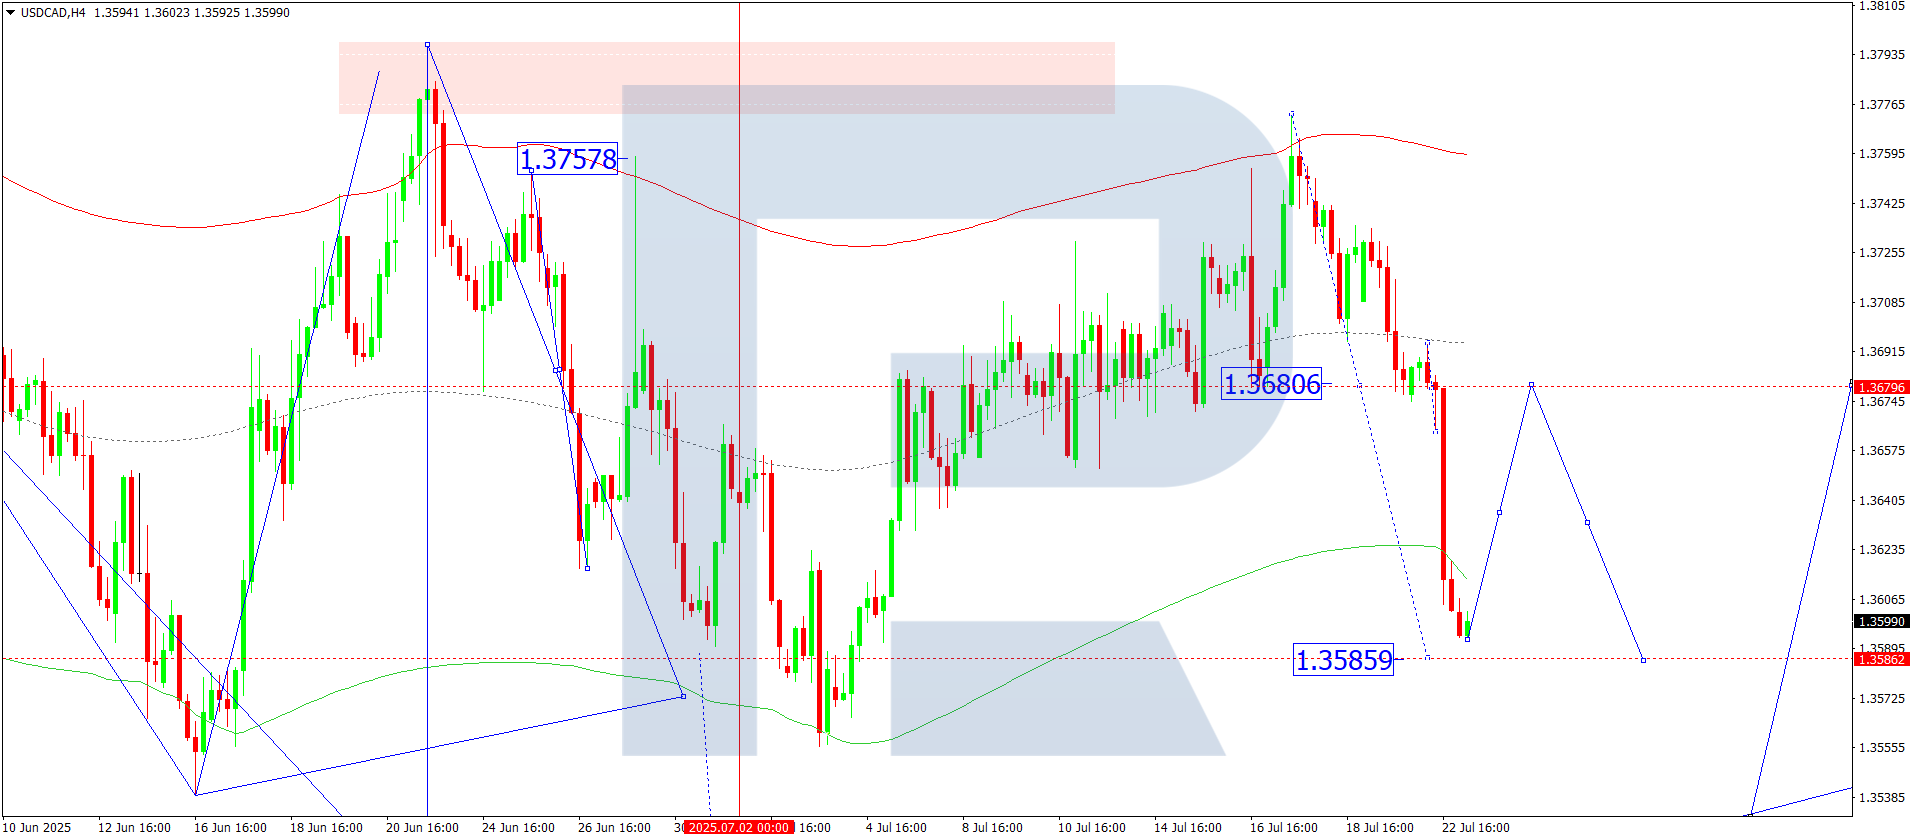
XAUUSD Forecast (Gold)
On the H4 chart, gold completed a rally to $3,400 and is now consolidating around this level. A downward breakout could initiate a correction toward $3,333.
This outlook is based on the Elliott wave structure, with $3,333 serving as the key rotation level. The market has reached the upper boundary of the Price Envelope at $3,400, and a move to the central line at $3,333 is likely. A further decline to the lower boundary at $3,235 may follow.
Technical indicators suggest potential downside toward $3,333.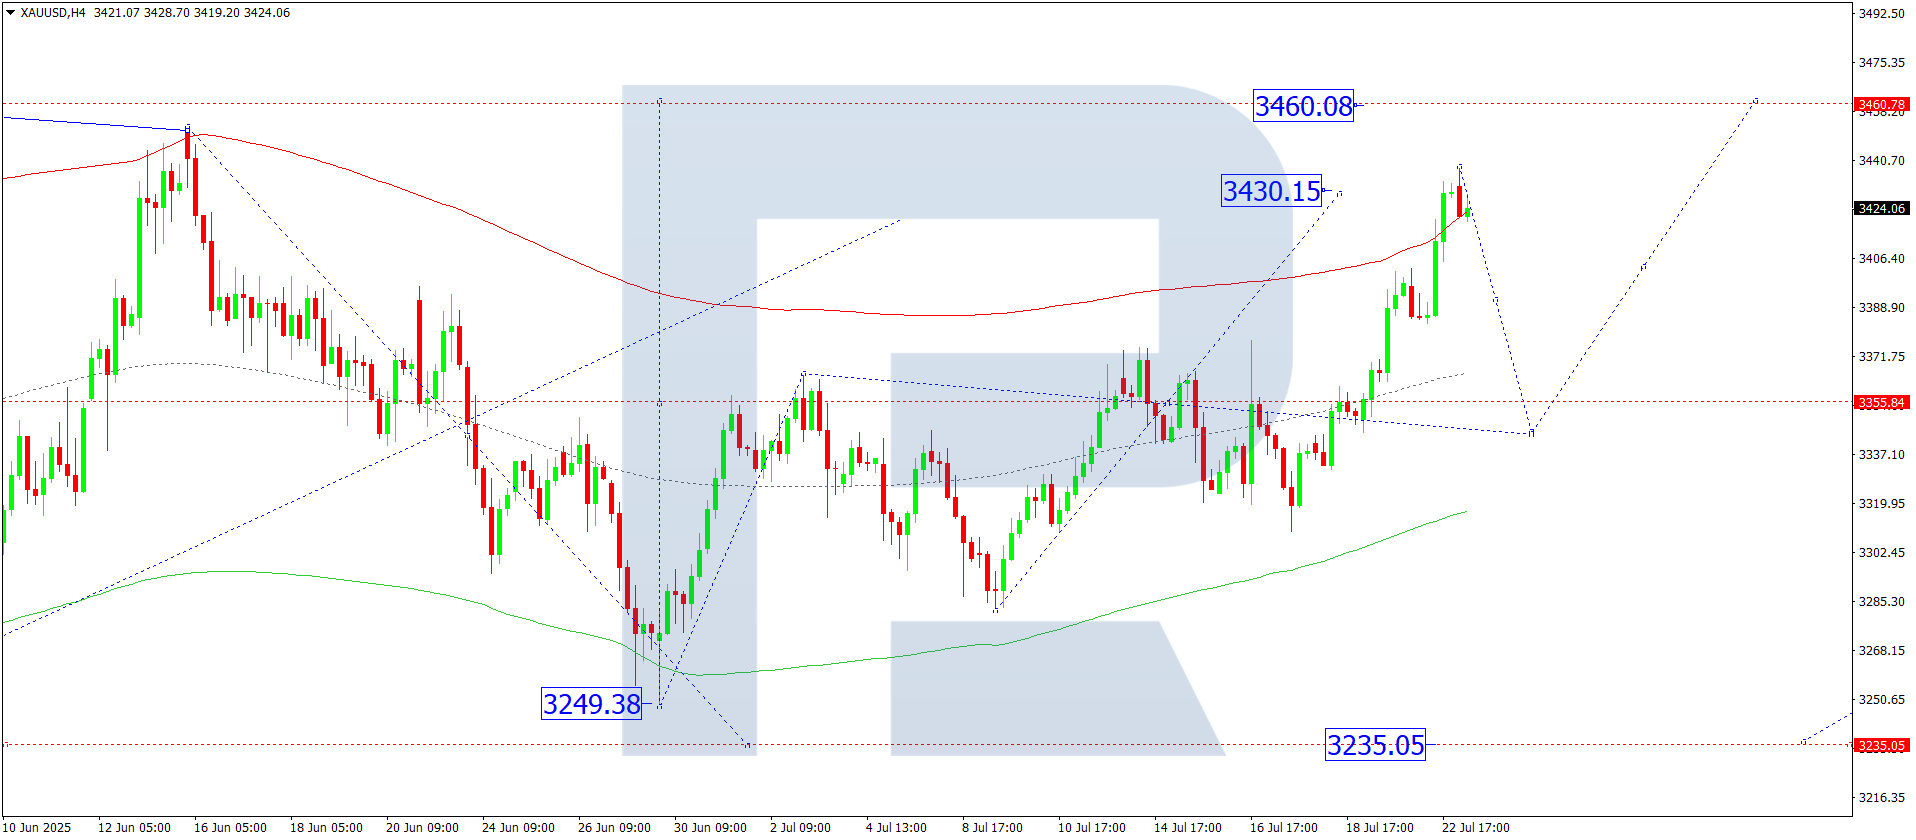
Brent Crude Forecast
On the H4 chart, Brent crude remains in a consolidation phase around $68.60. A downward extension to $67.50 is possible, after which a rally to $69.50 may unfold. A breakout above this level could lead to $71.40. A downside breakout, on the other hand, might extend losses toward $66.90.
This outlook is supported by the Elliott wave structure, with $68.60 identified as the key rotation point. The market is consolidating around the Price Envelope’s central line, with a bullish move to the upper boundary at $71.40 remaining a relevant scenario.
Technical indicators favor a continued rise toward $71.40.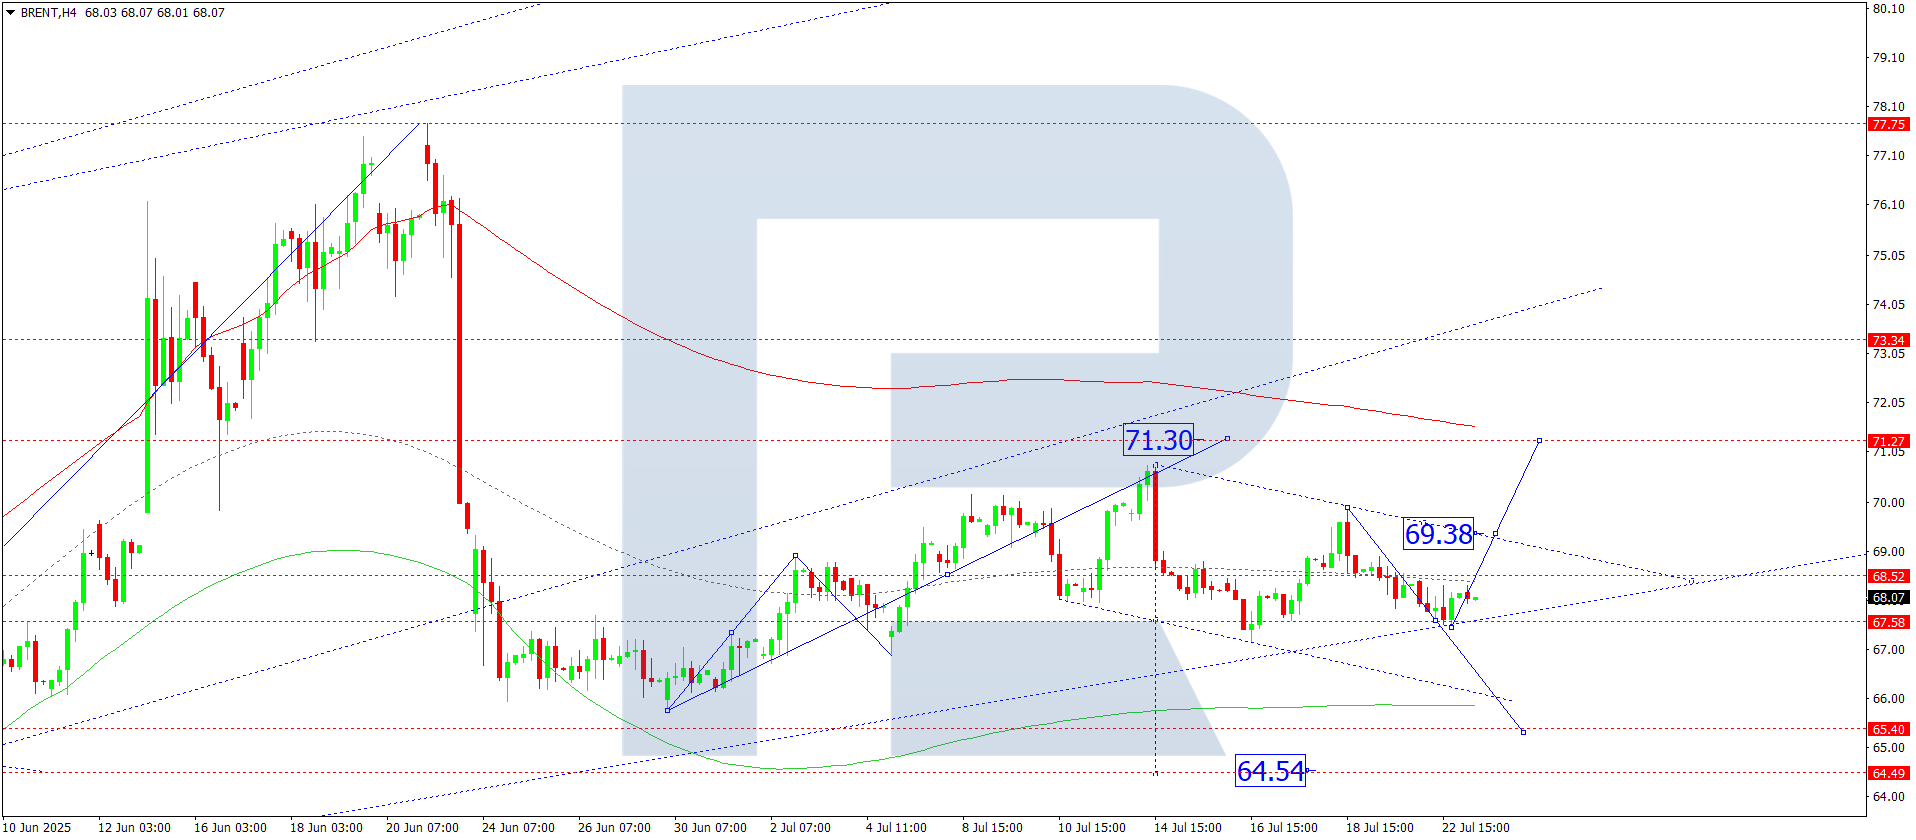
Risk Disclaimer:
Past trading performance does not guarantee future results. All trading involves risk, and it is important to evaluate financial circumstances and risk tolerance before engaging in any trading activity.
Leave a Reply