
Daily Technical Analysis and Forecast – 11 August 2025
EURUSD Forecast – 11 August 2025
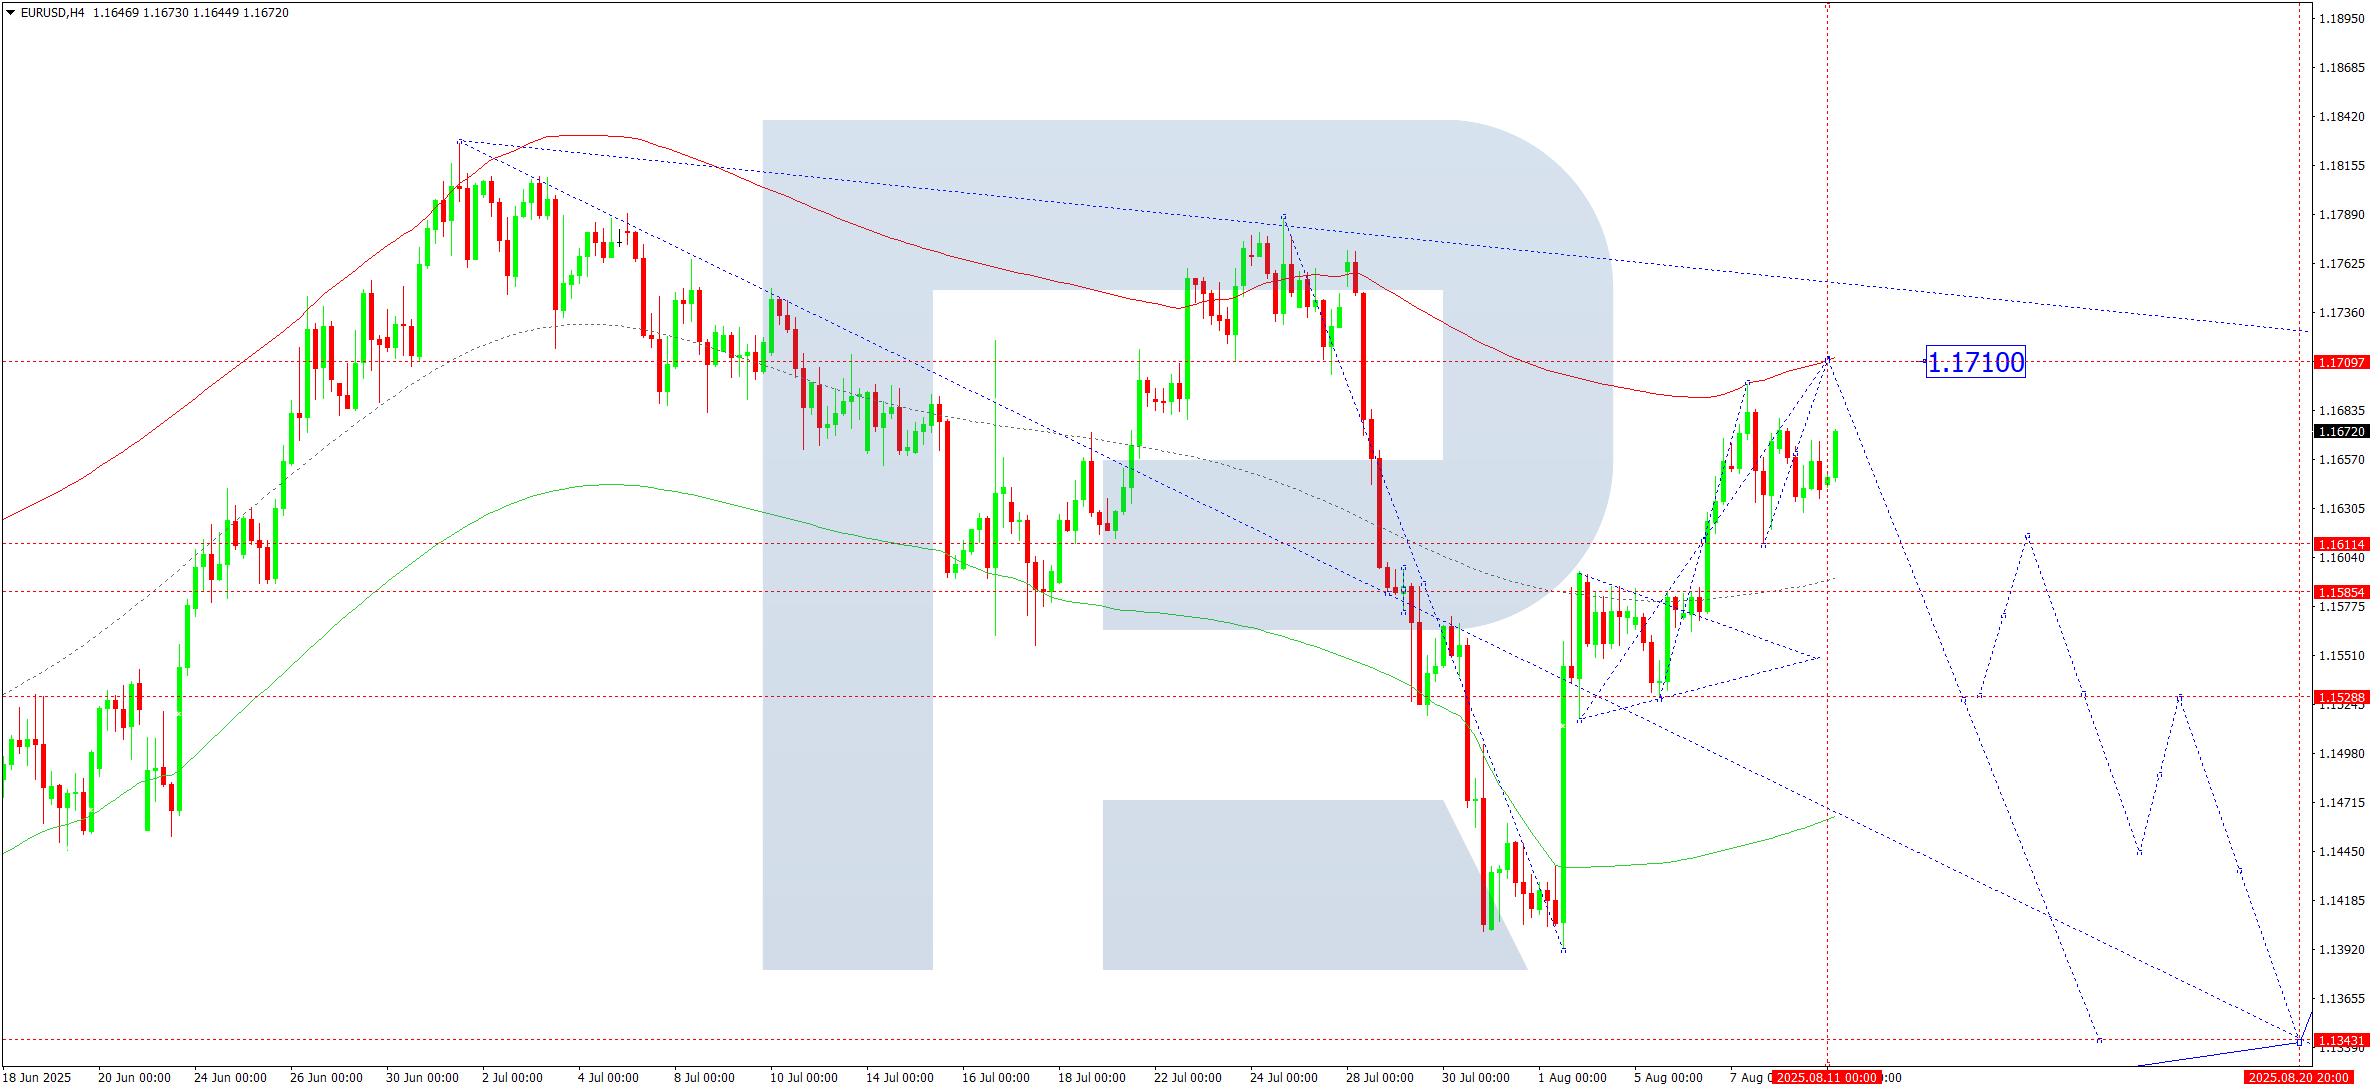
On the H4 chart, EURUSD is consolidating above 1.1611. Today, this range could extend up to 1.1710. If that level holds, a potential decline toward 1.1530 may follow. A break below this support would indicate a continuation of the downtrend, targeting 1.1343.
This outlook is supported by the Elliott Wave pattern and a downward wave structure, with 1.1550 acting as a key pivot. A corrective move recently reached the upper Envelope boundary at 1.1698, with price now consolidating beneath it. A brief move to 1.1710 remains possible before a deeper decline sets in.
Today’s outlook indicates a potential start of a downward wave targeting 1.1343.
USDJPY Forecast – 11 August 2025
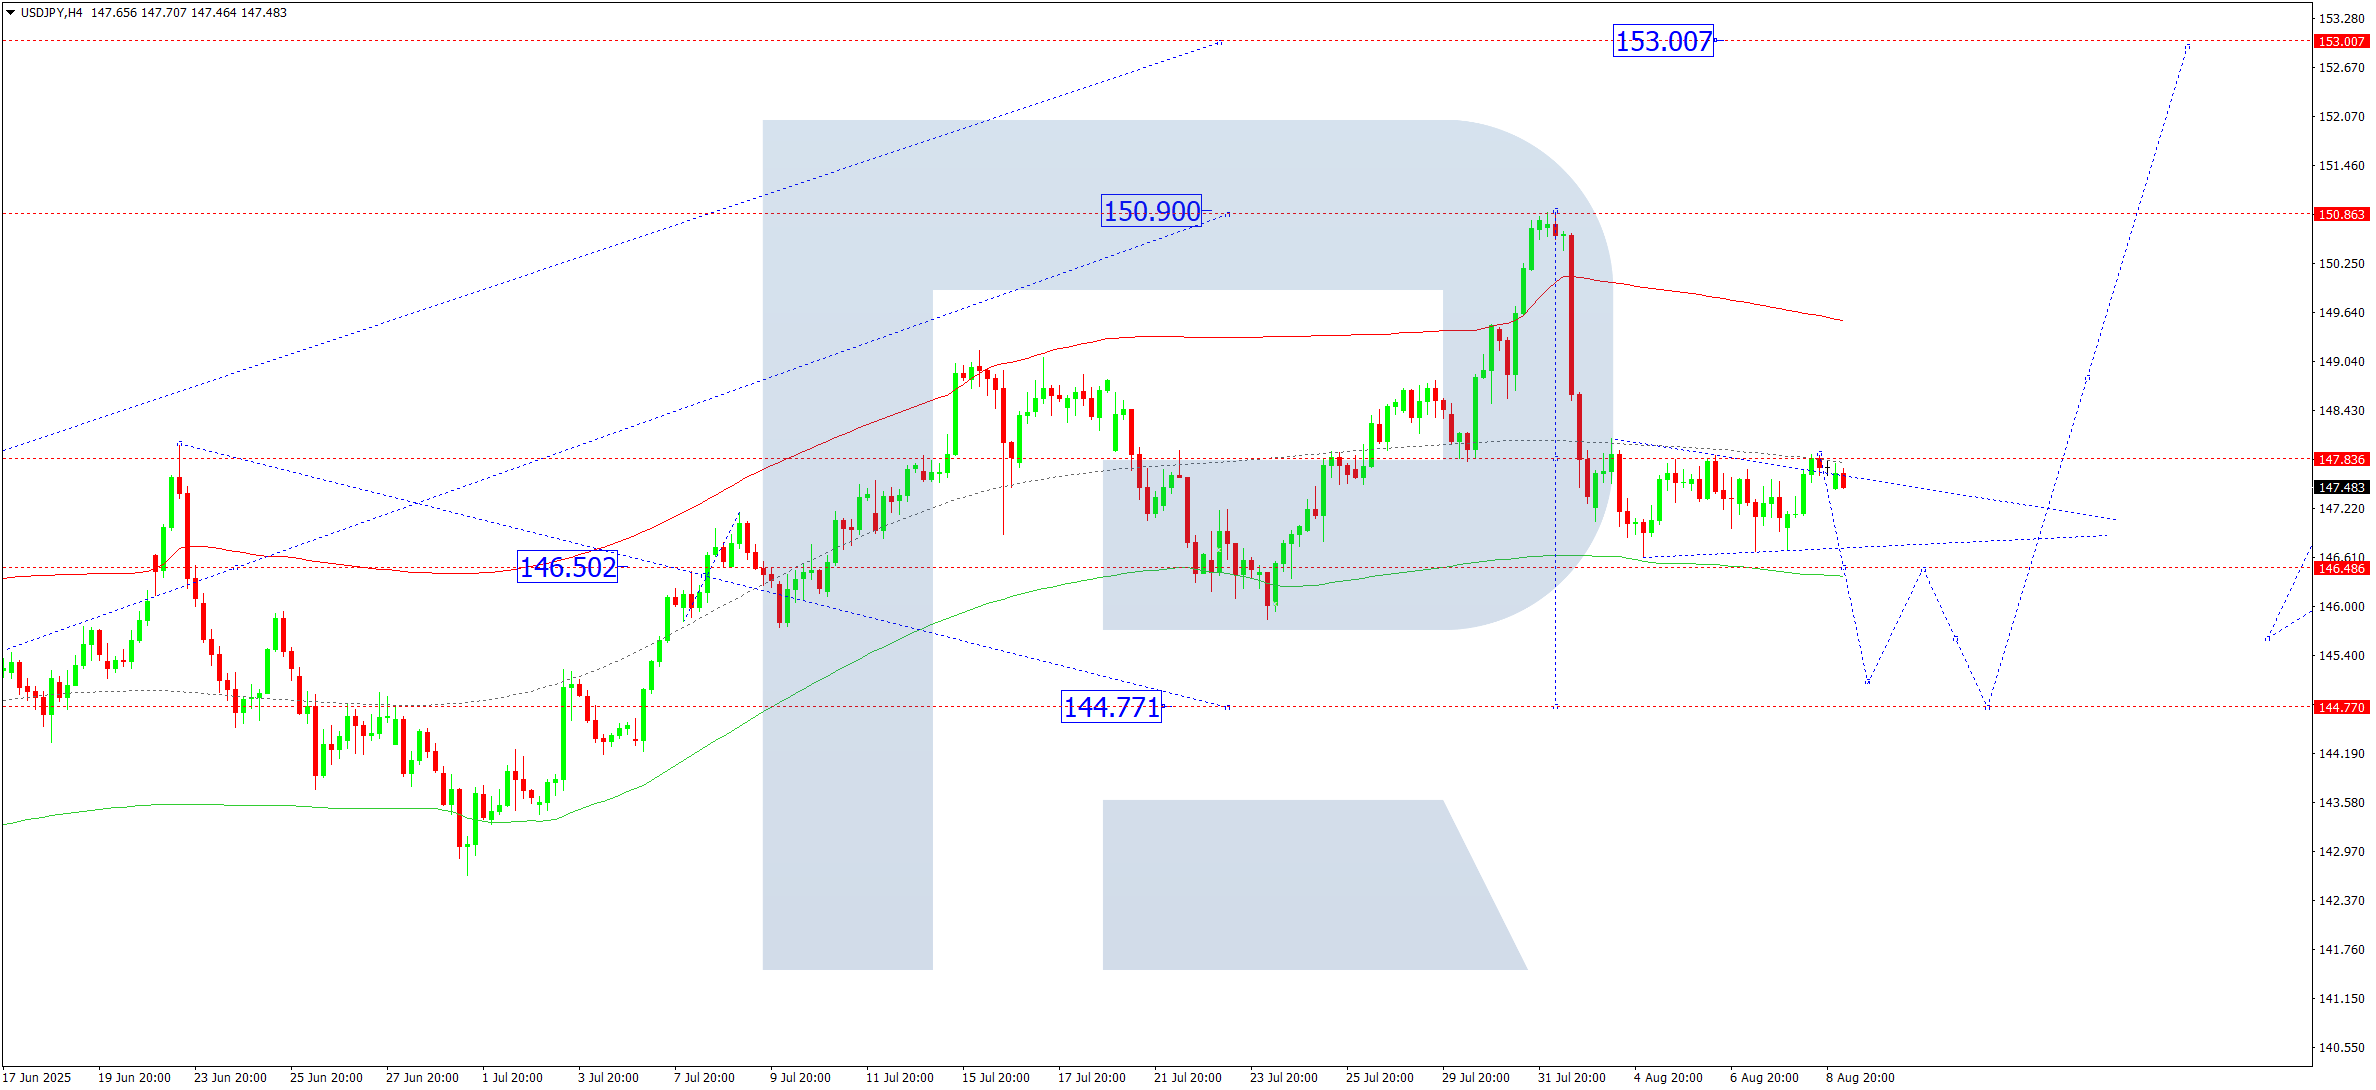
On the H4 timeframe, USDJPY is consolidating below 147.85. Today may bring a downward breakout with a possible decline to 144.77. Conversely, a breakout above the range could push prices toward 149.33, and potentially up to 153.14.
The Elliott Wave structure supports this scenario, with 146.50 as a critical pivot level. The pair is currently correcting towards the lower Envelope boundary at 144.77. Following this, an upward move targeting the 153.14 level is expected.
Technical outlook suggests the correction could continue towards 144.77 before resuming upward momentum.
GBPUSD Forecast – 11 August 2025
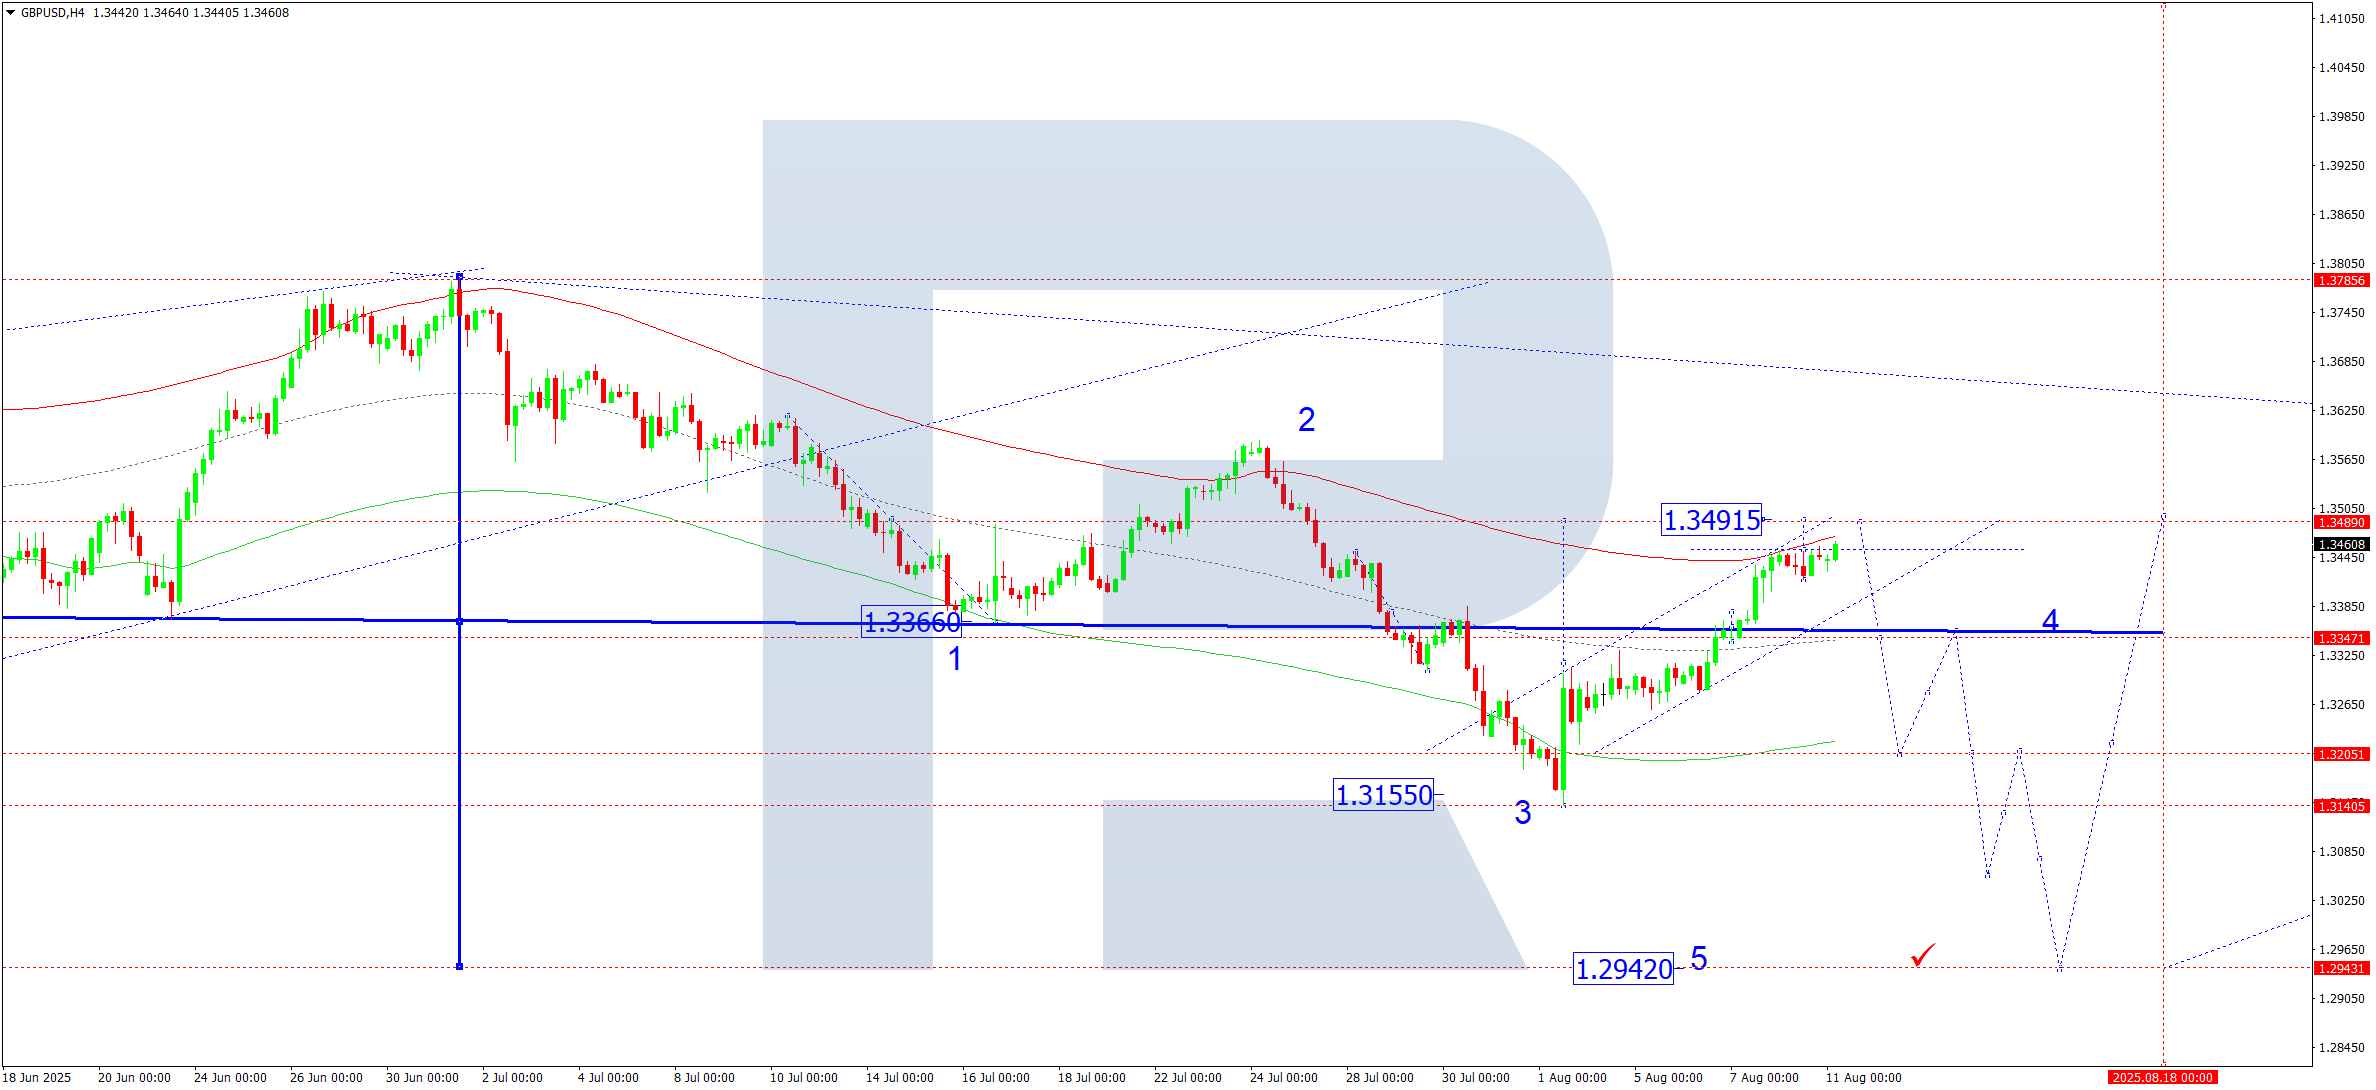
GBPUSD is correcting higher on the H4 chart and may reach 1.3491 today. From there, a downward move is expected toward 1.3200. A break below this level would open the path to 1.2940.
This forecast is backed by the Elliott Wave structure and a downward wave setup with a pivotal level at 1.3366. The recent corrective wave nears the upper Envelope boundary at 1.3444. Price may consolidate beneath this zone before resuming its decline.
Today’s analysis suggests a likely move lower toward 1.3200, and possibly down to 1.2940.
AUDUSD Forecast – 11 August 2025
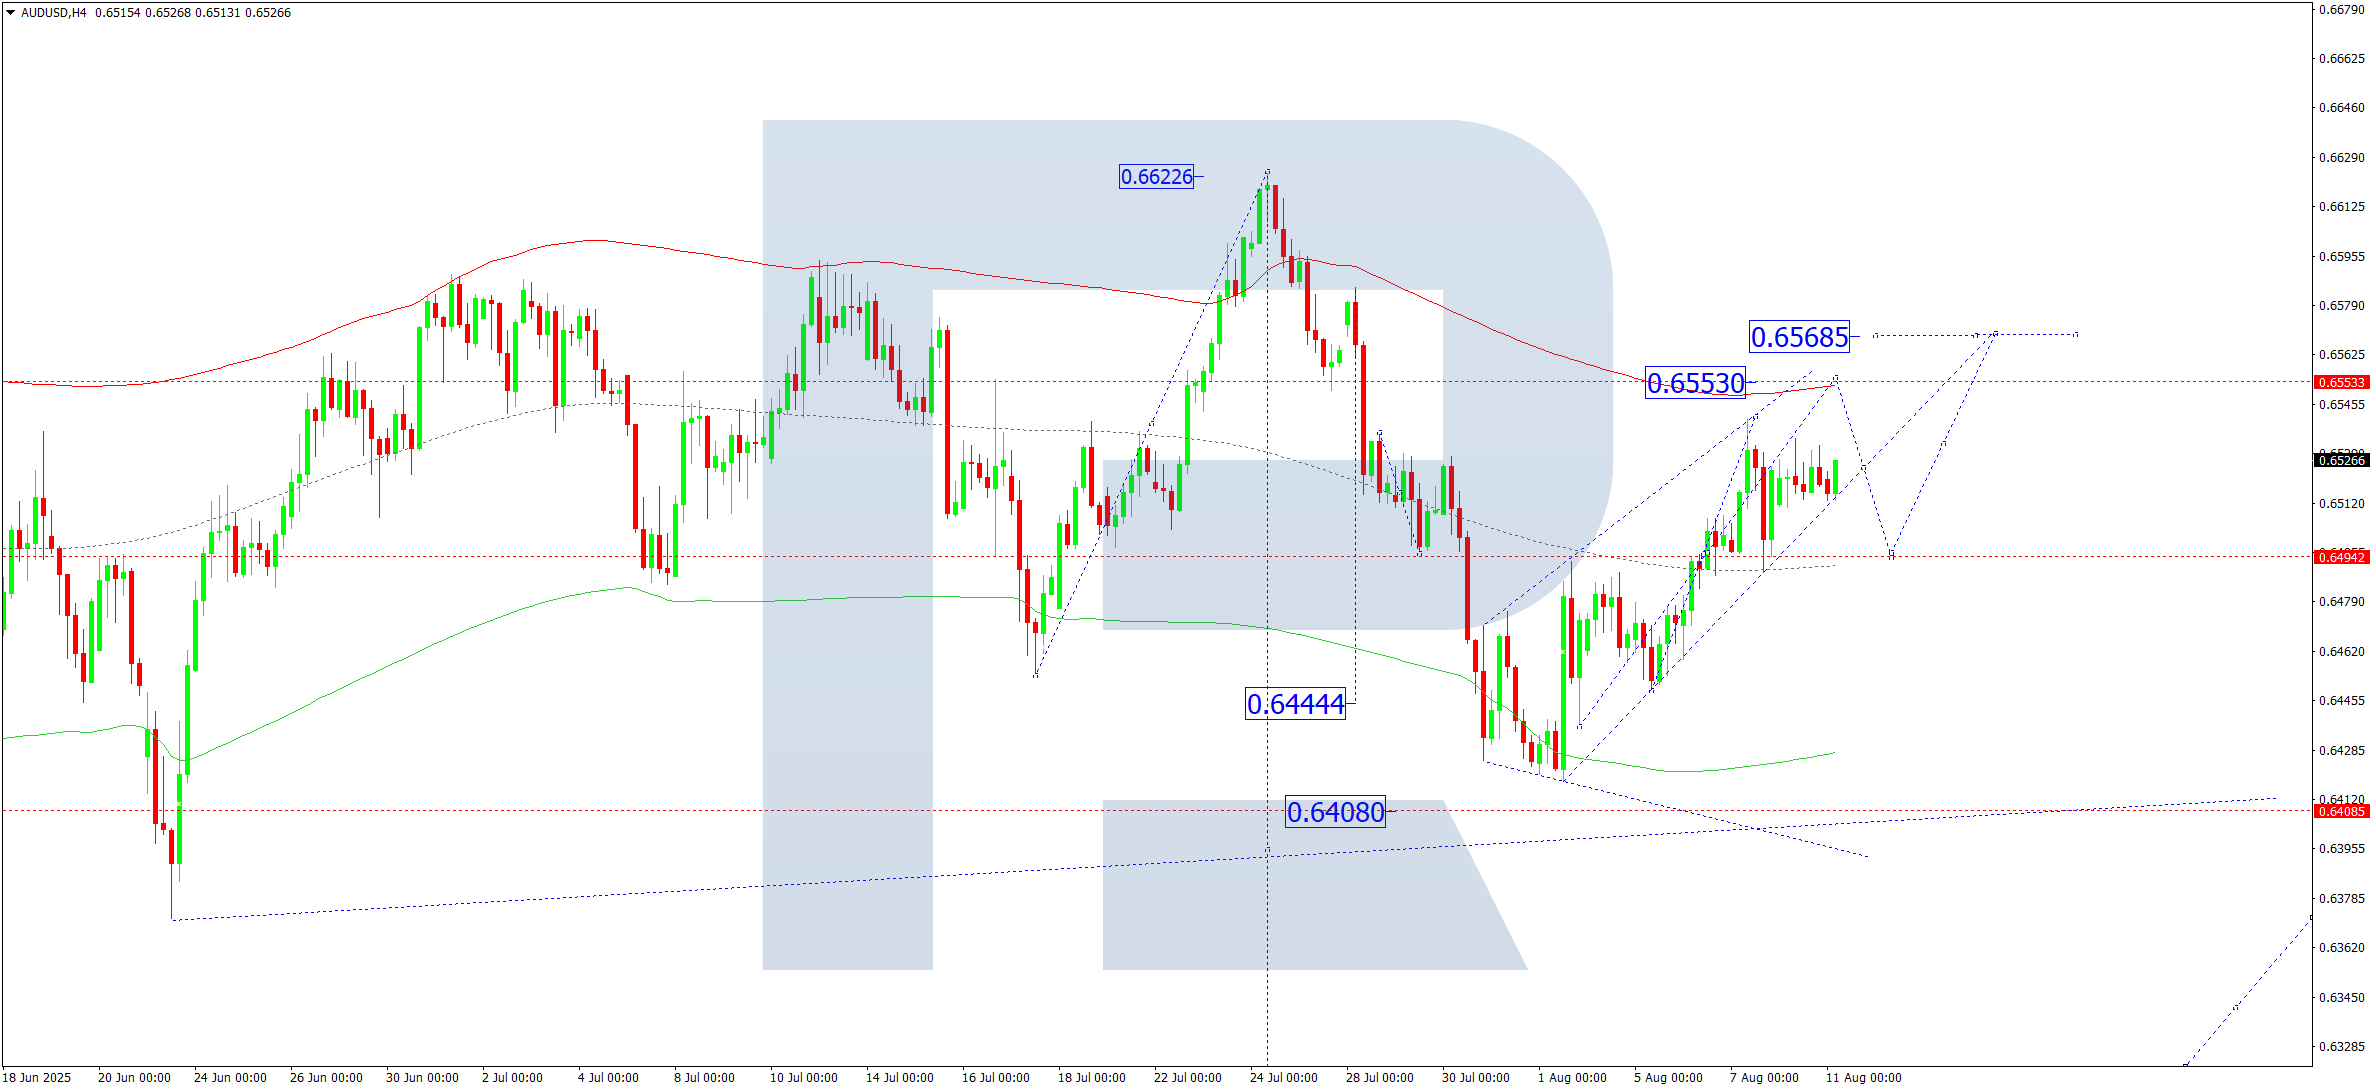
AUDUSD is forming a consolidation range around 0.6466 on the H4 chart. An upward breakout toward 0.6555 is likely today, followed by a potential reversal to 0.6460. A break below that level would indicate a continuation toward 0.6408.
This setup is aligned with the Elliott Wave structure and a downward wave matrix, with 0.6515 acting as the key pivot. The market is currently in a corrective phase heading toward the upper Envelope boundary at 0.6555 before resuming its downward trend.
Today’s indicators point to an initial move toward 0.6555, followed by a possible drop toward 0.6408.
USDCAD Forecast – 11 August 2025
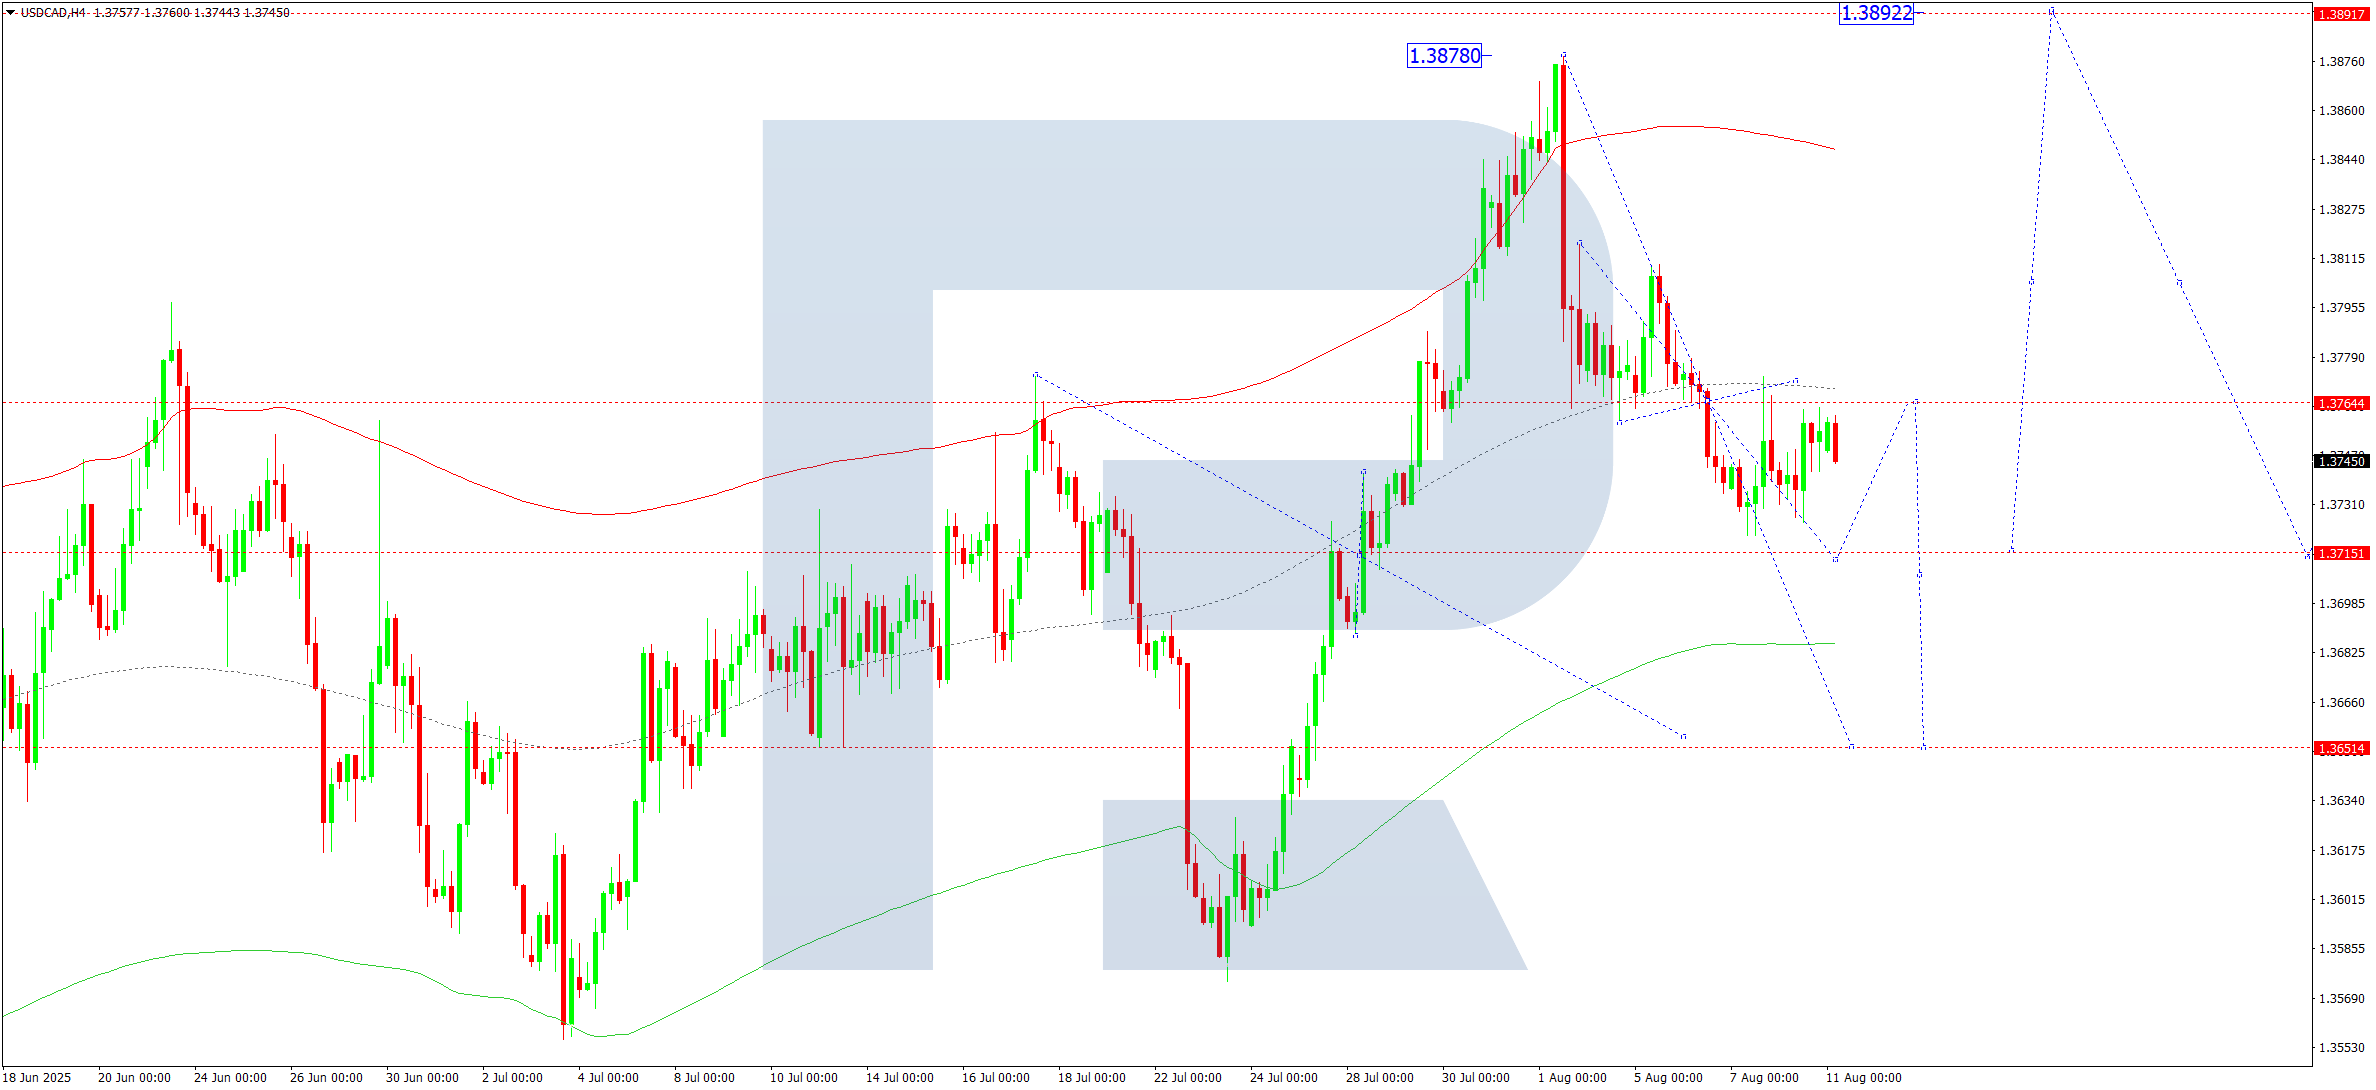
USDCAD continues to correct downward on the H4 chart, with a move to 1.3715 expected today. This correction could extend to 1.3650. Once the correction concludes, the pair is expected to resume its upward trend toward 1.3890.
The Elliott Wave structure and growth wave matrix support this view, with 1.3715 as the critical pivot. The pair has broken below the central Envelope line at 1.3800, with the decline seen as a corrective phase of the larger uptrend.
Today’s forecast anticipates a continued correction to 1.3715 or 1.3650, followed by growth toward 1.3890.
XAUUSD (Gold) Forecast – 11 August 2025
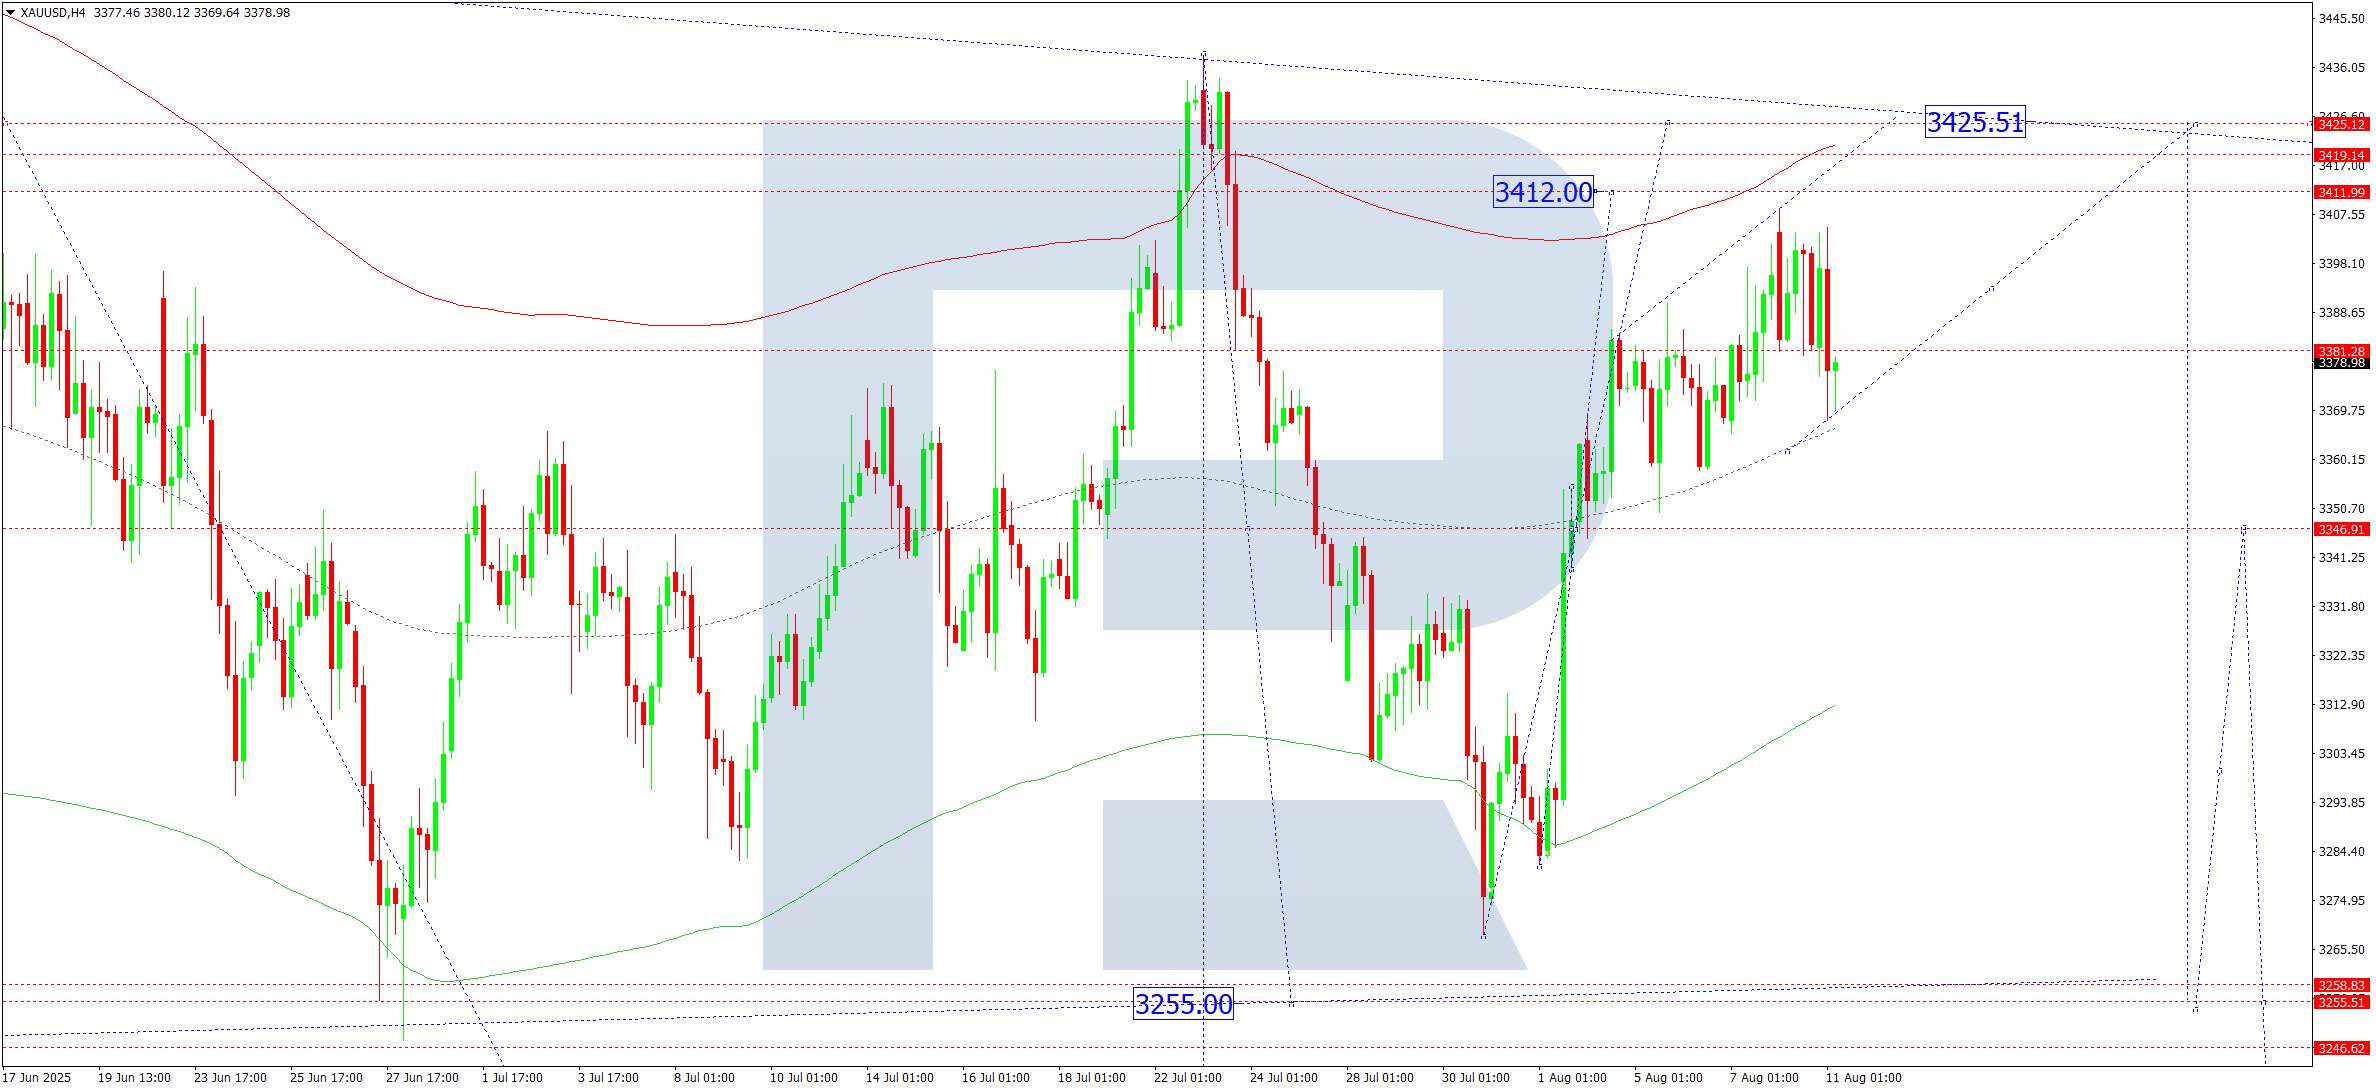
Gold is currently correcting upward on the H4 chart toward 3,412, with a consolidation phase likely below this level. An upward breakout may push price to 3,420. If the correction ends, a decline toward 3,255 is anticipated.
The Elliott Wave pattern and downward wave structure, with 3,345 as the key pivot, support this outlook. A correction toward the upper Envelope boundary at 3,420 is underway, after which a move down to 3,333 and potentially 3,255 is expected.
Today’s forecast points to a potential completion of the correction at 3,420, followed by a decline to 3,255.
Brent Crude Forecast – 11 August 2025
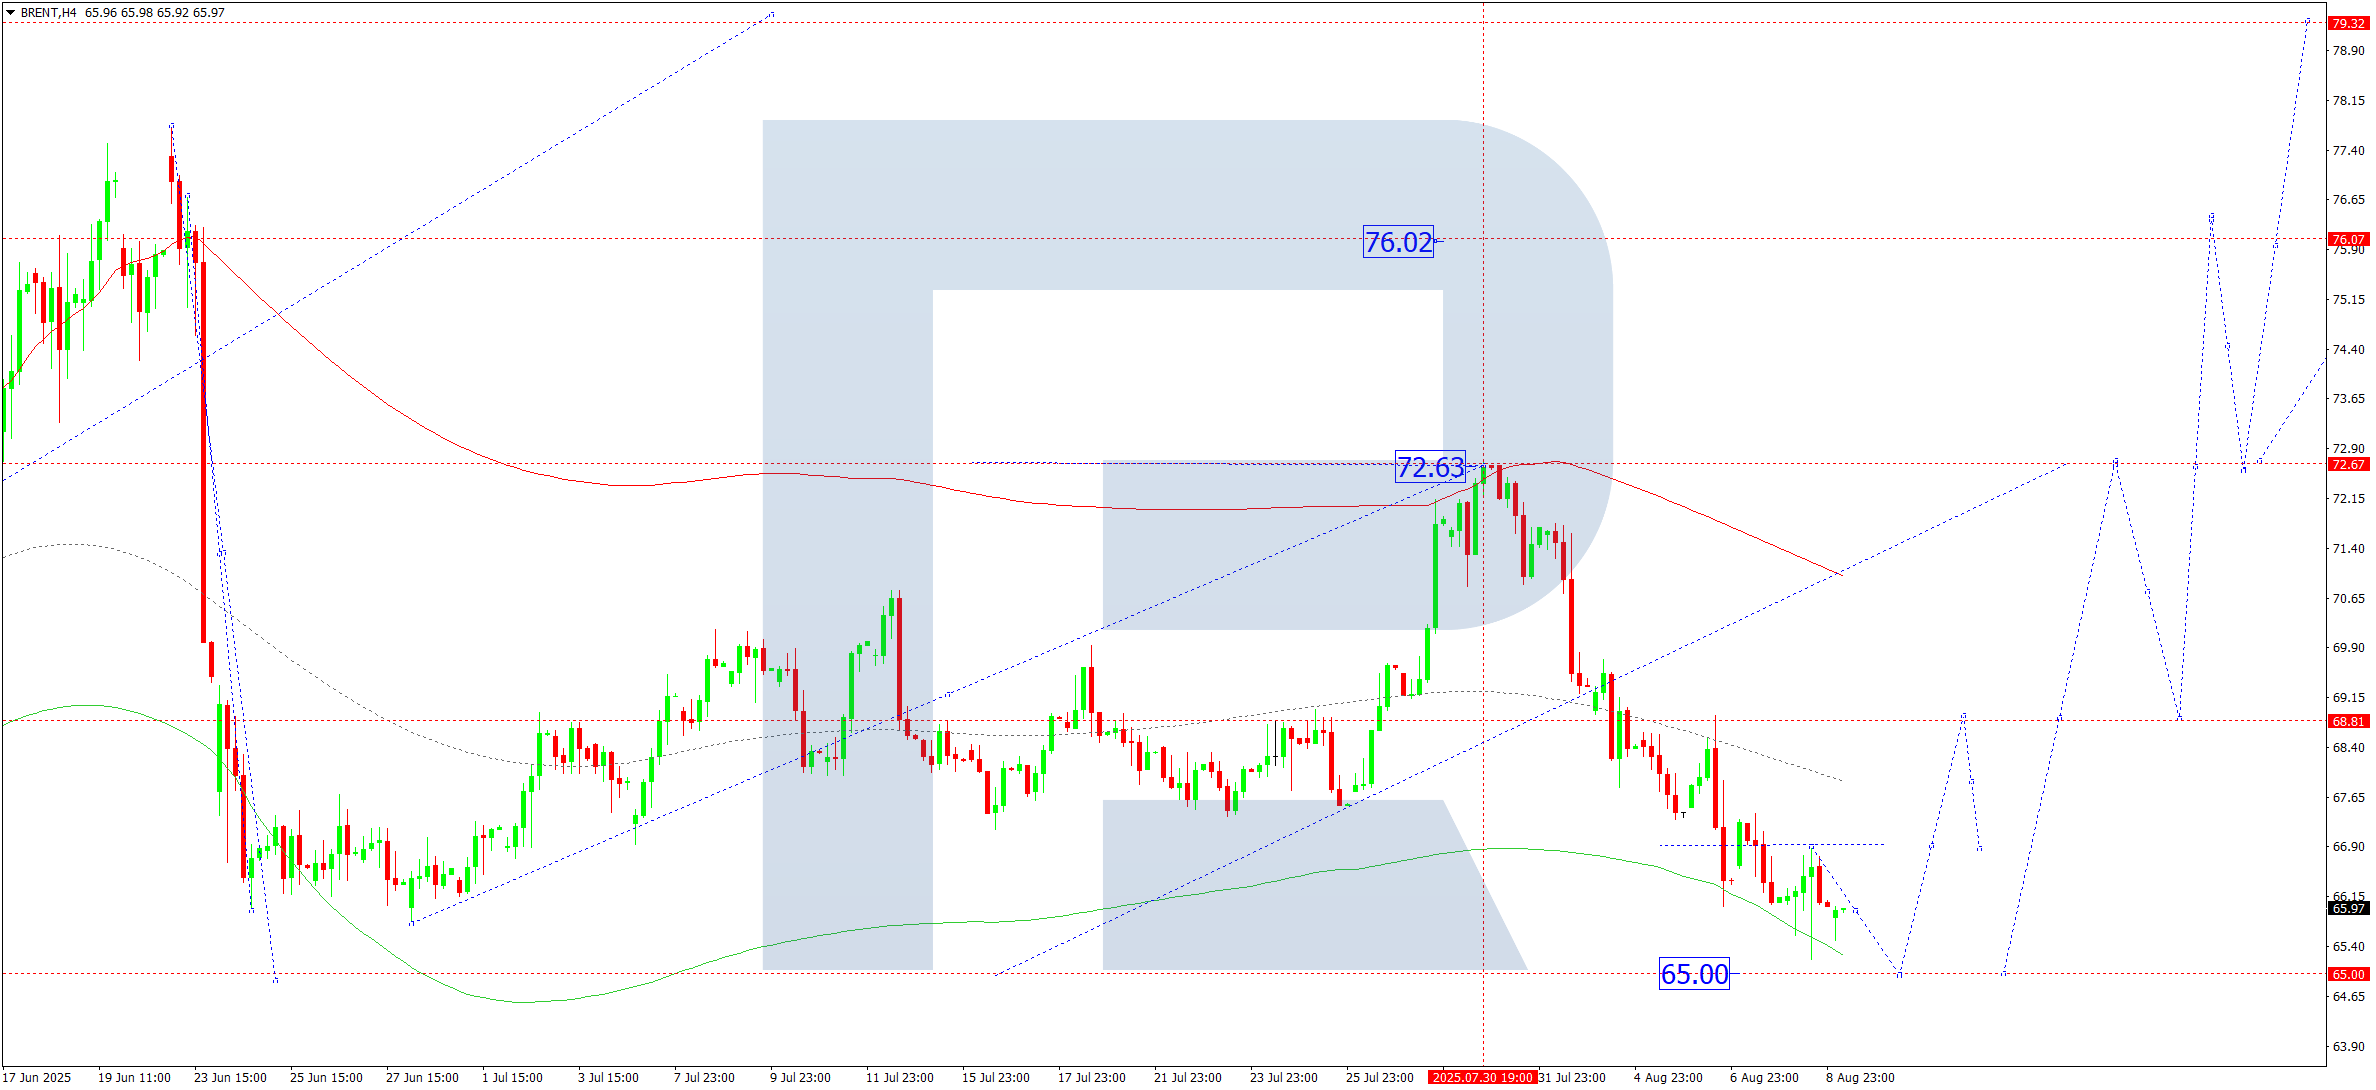
On the H4 chart, Brent is continuing its downward move toward the 65.00 support level. Reaching this target is expected today. Afterwards, a rebound to 68.88 is possible. A breakout above that level could signal a continuation toward 73.65 and higher.
The Elliott Wave structure and the bullish wave matrix support this view, with a key pivot at 69.50. Brent is in a corrective phase down to the lower Envelope boundary at 65.00, from which a new growth phase toward the upper boundary at 72.60 may begin.
Today’s outlook suggests a potential bottom at 65.00, followed by a recovery toward 72.60.
Disclaimer:
Past performance does not guarantee future results. This analysis is for informational purposes only and should not be considered as investment advice. Always do your own research and consult with a professional before making any trading decisions.
Leave a Reply